Maxlum System Correlation
- Göstergeler
- Oky Agus Setiawan
- Sürüm: 1.2
- Etkinleştirmeler: 5
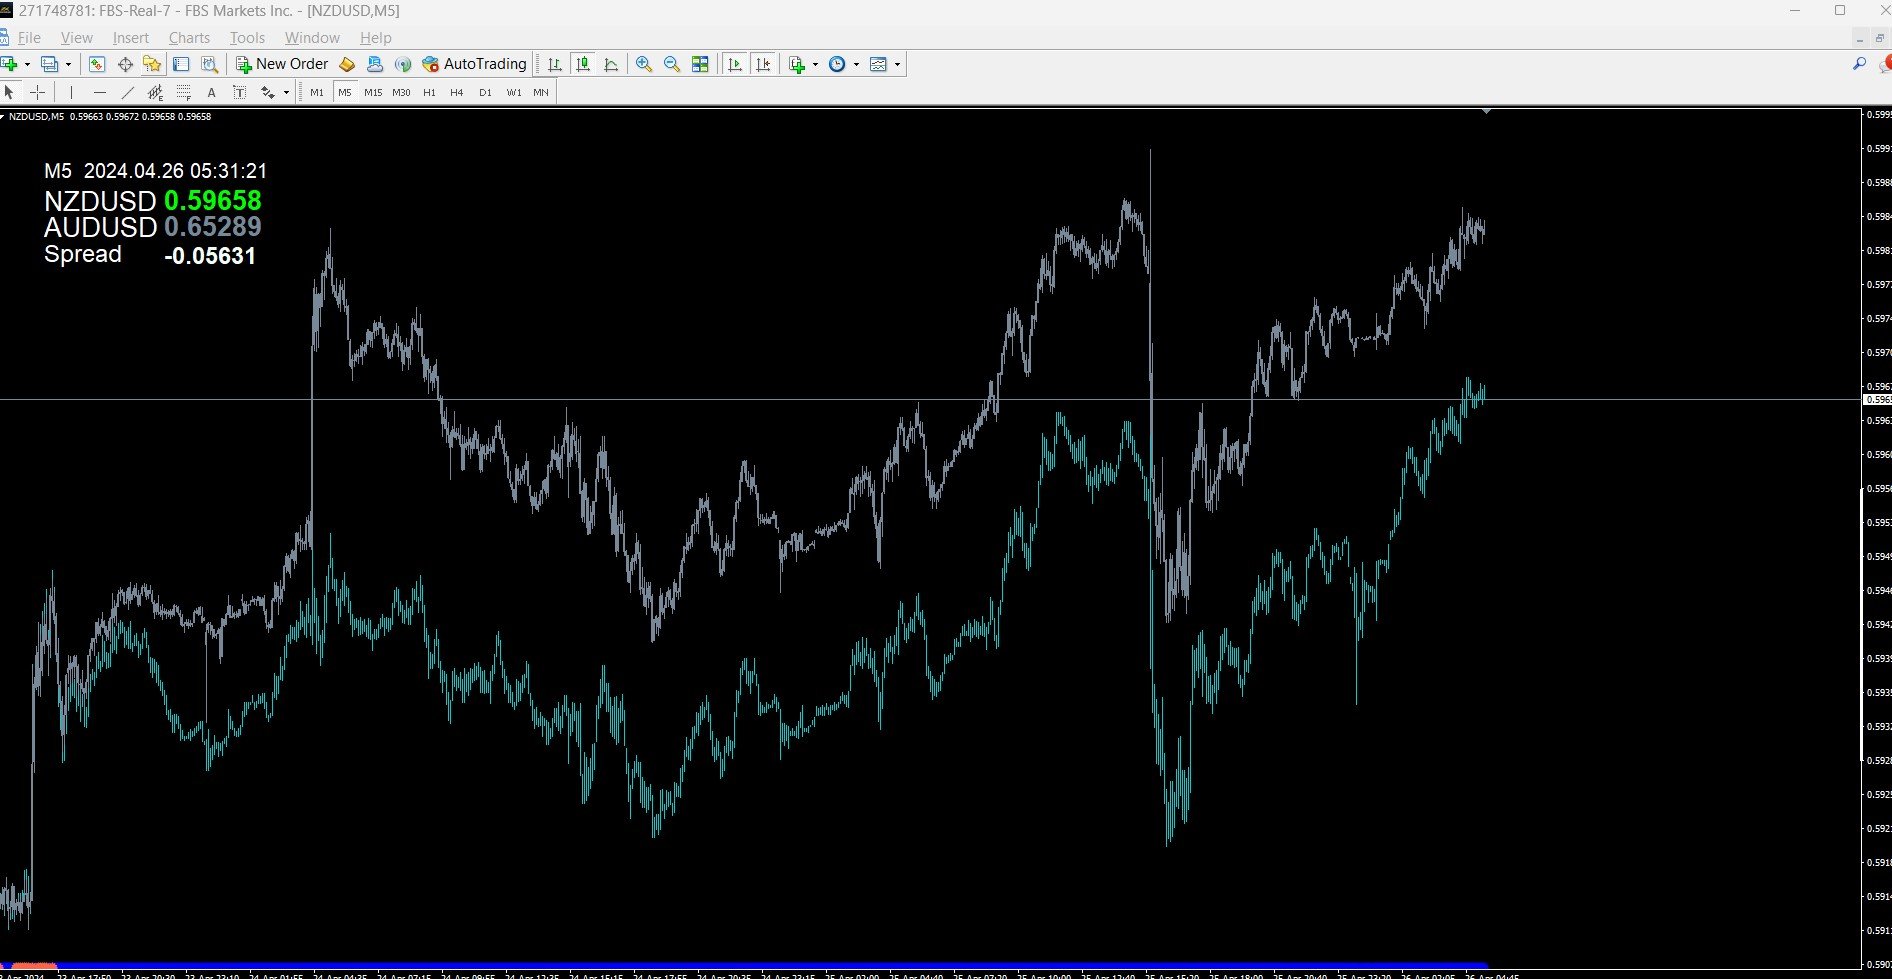
MAXLUM SYSTEM
is a Trading System that uses anti-Margin Call without using SL with a positive correlation Hedging Strategy
Simple example of BUY on EURUSD and SELL on GBPUSD at the same time
This kind of trading will not occur as a Margin Call
By calculating the GAP difference between the 2 pairs
we can take advantage of the GAP
This indicator will be more effective if you use Data Analysis
download excel file on telegram Group
Please join the Maxlum System Telegram group for details
t.me/maxlumsystem
t.me/maxlumgroup
Recommended Pair
NZDUSD - AUDUSD
EURUSD - GBPUSD
NZDJPY - AUDJPY
EURJPY - GBPJPY
Trade history
https://www.mql5.com/en/signals/2215761?source=Site+Signals+My
New Account, because ECN cannot be published in MQL5
Brokers
It is highly recommended to use Low Spread
ECN & Zero Spread
Contact Me
t.me/MaxlumSystem
t.me/MaxlumFX