Basic Theme Builder MT5
- Göstergeler
- Mehran Sepah Mansoor
- Sürüm: 1.0
Yenilikçi Metatrader Tema Oluşturucumuz ile işlem grafiklerinize hayat verin!
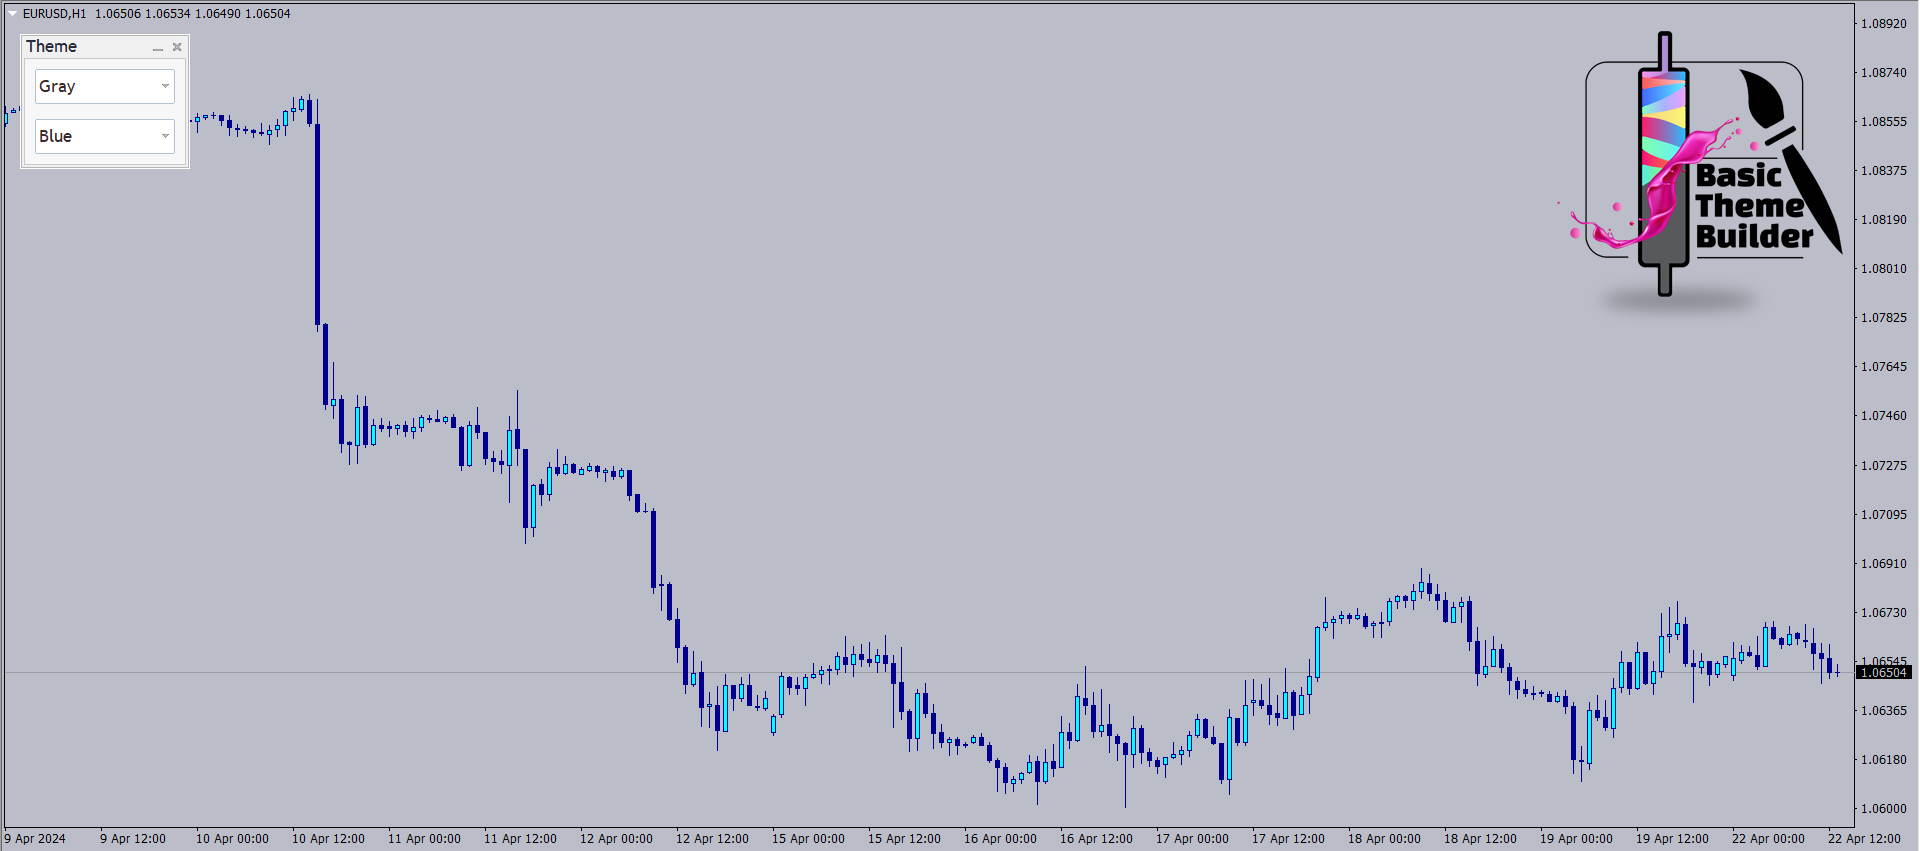
Tema Oluşturucumuz, kişisel tarzınıza ve tercihlerinize uygun bir ticaret ortamı oluşturmanıza olanak tanır. Kullanımı kolay bir arayüzle ve Metatrader'a tamamen entegre olarak, artık grafiklerinizin görünümü ve hissi üzerinde tam kontrole sahipsiniz / Ücretsiz MT4 sürümü.
Özellikler
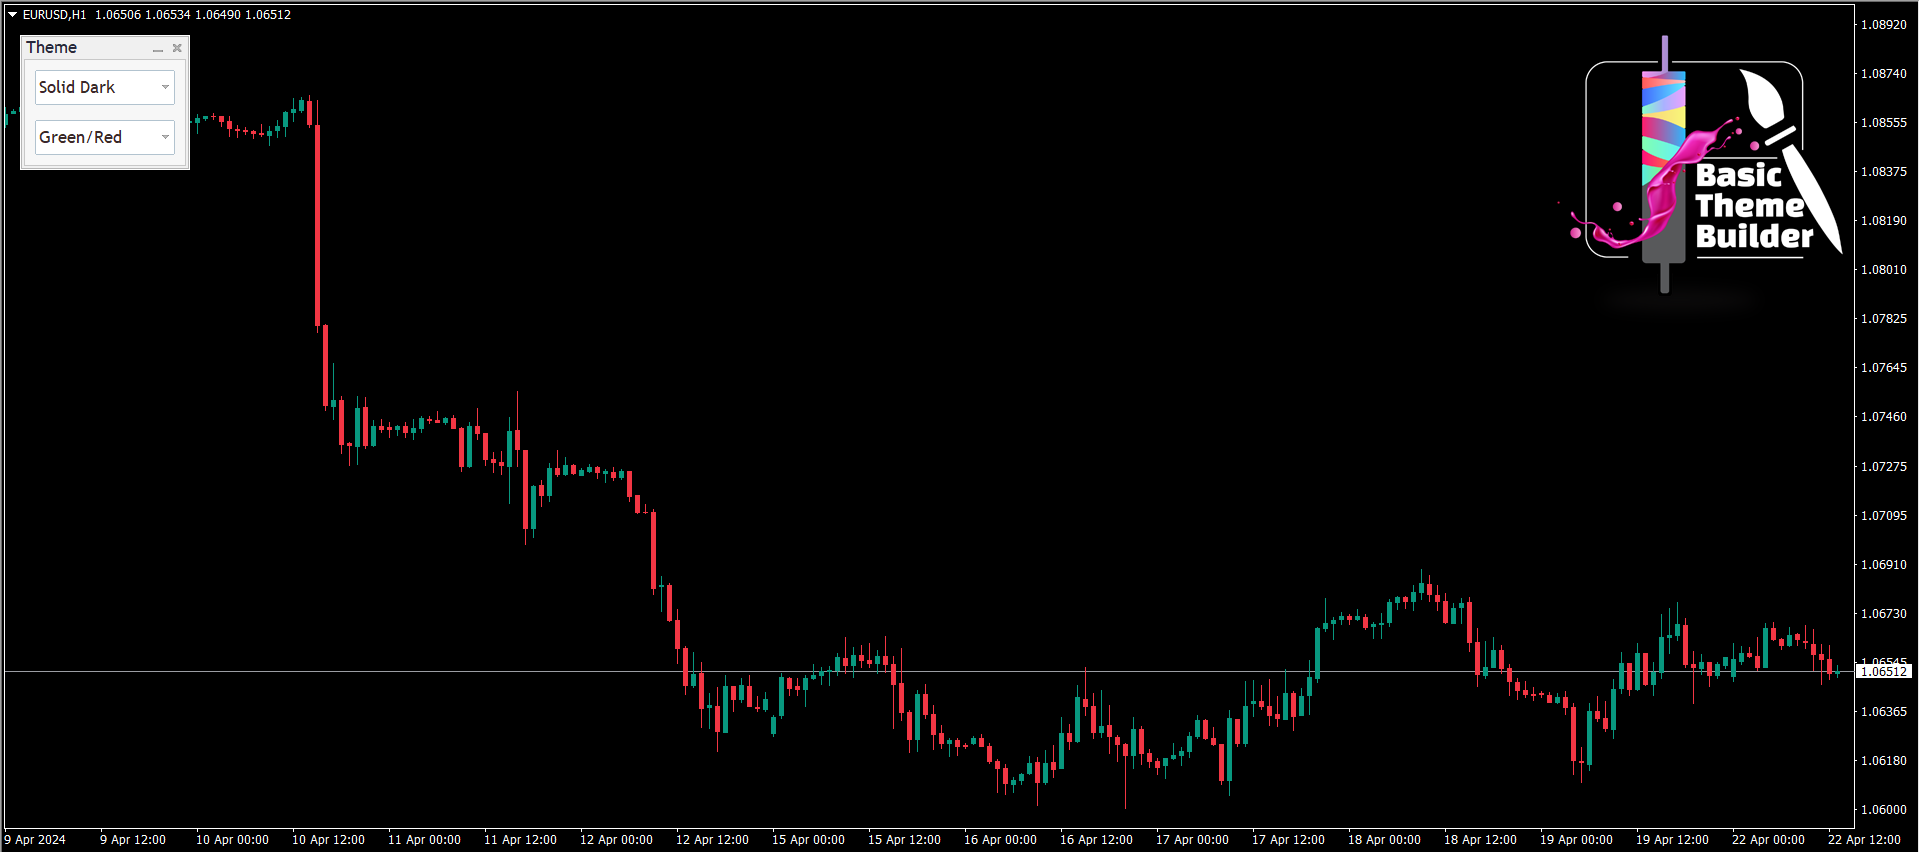
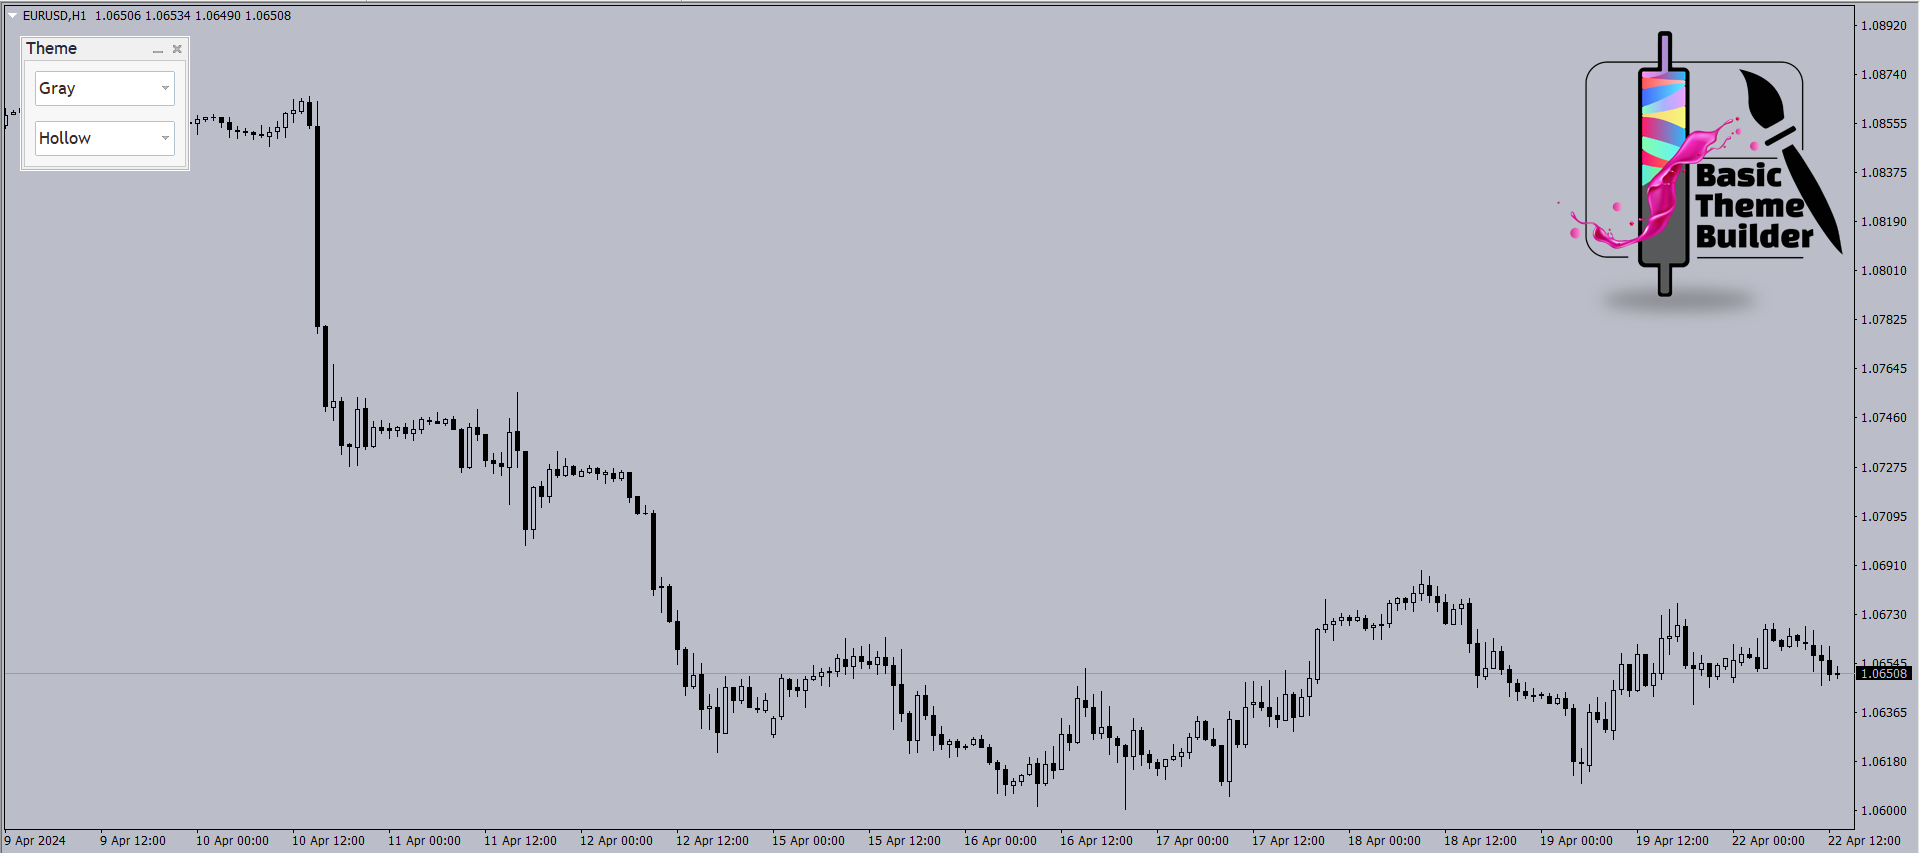
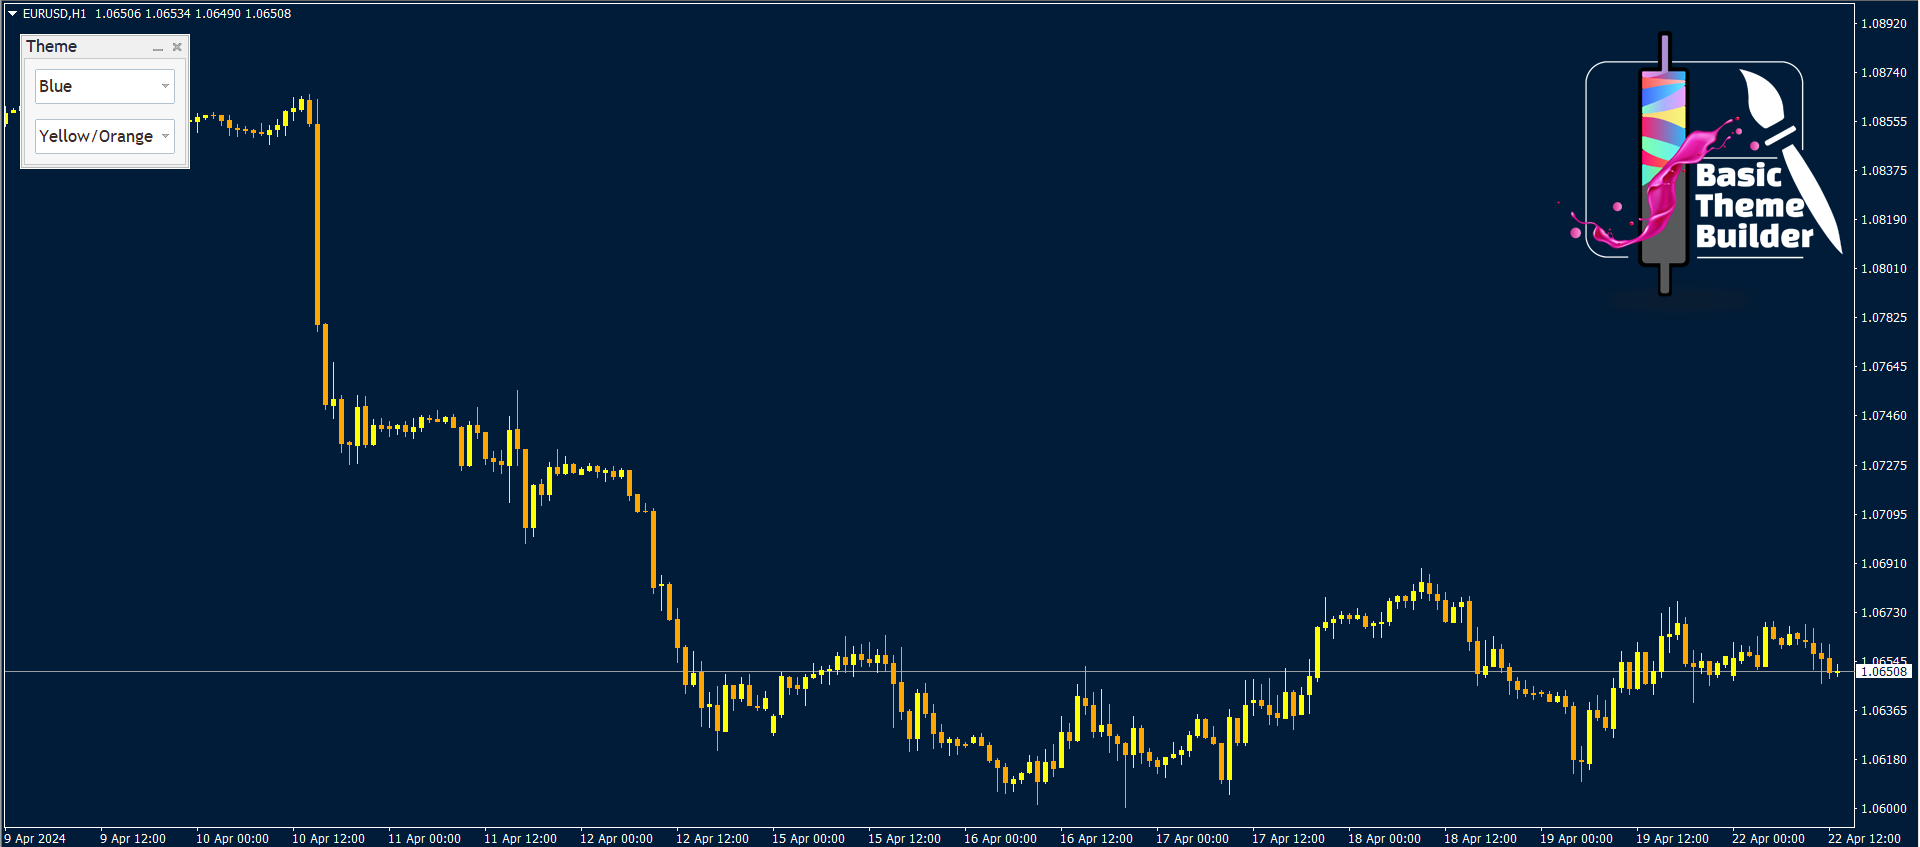
- Tam Özelleştirme: Benzersiz ticaret tarzınızı yansıtmak için mum çubuğu rengini ve grafik arka planını kolayca değiştirin. Yumuşak, profesyonel tonlardan canlı, cesur renklere kadar olasılıklar sonsuzdur.
- Sınırsız Yaratıcılık: Kişiliğinize ve alım satım tercihlerinize uygun mükemmel görünümü bulmak için farklı renk kombinasyonları ve stillerle denemeler yapın - hayal gücünüzü serbest bırakın ve gerçekten benzersiz grafikler oluşturun!
- Kullanım Kolaylığı: Aracımız, yeni başlayan yatırımcılar için bile sezgisel ve kullanımı kolay olacak şekilde tasarlanmıştır. Sadece birkaç tıklama ile grafiklerinizi tamamen özelleştirebilir ve onlara yepyeni bir görünüm ve his verebilirsiniz.
- Ticaret Deneyimini Geliştirir: Görsel olarak çekici bir alım satım ortamına bakmak sadece daha keyifli olmakla kalmaz, aynı zamanda finansal piyasalarda alım satım yaparken odaklanmanızı ve konsantrasyonunuzu da artırabilir.
Nasıl kullanılır
Çok basit, sadece aşağıdaki videoyu izleyin.