Moving Average Scanner MT5
- Göstergeler
- Frederic Jacques Collomb
- Sürüm: 1.0
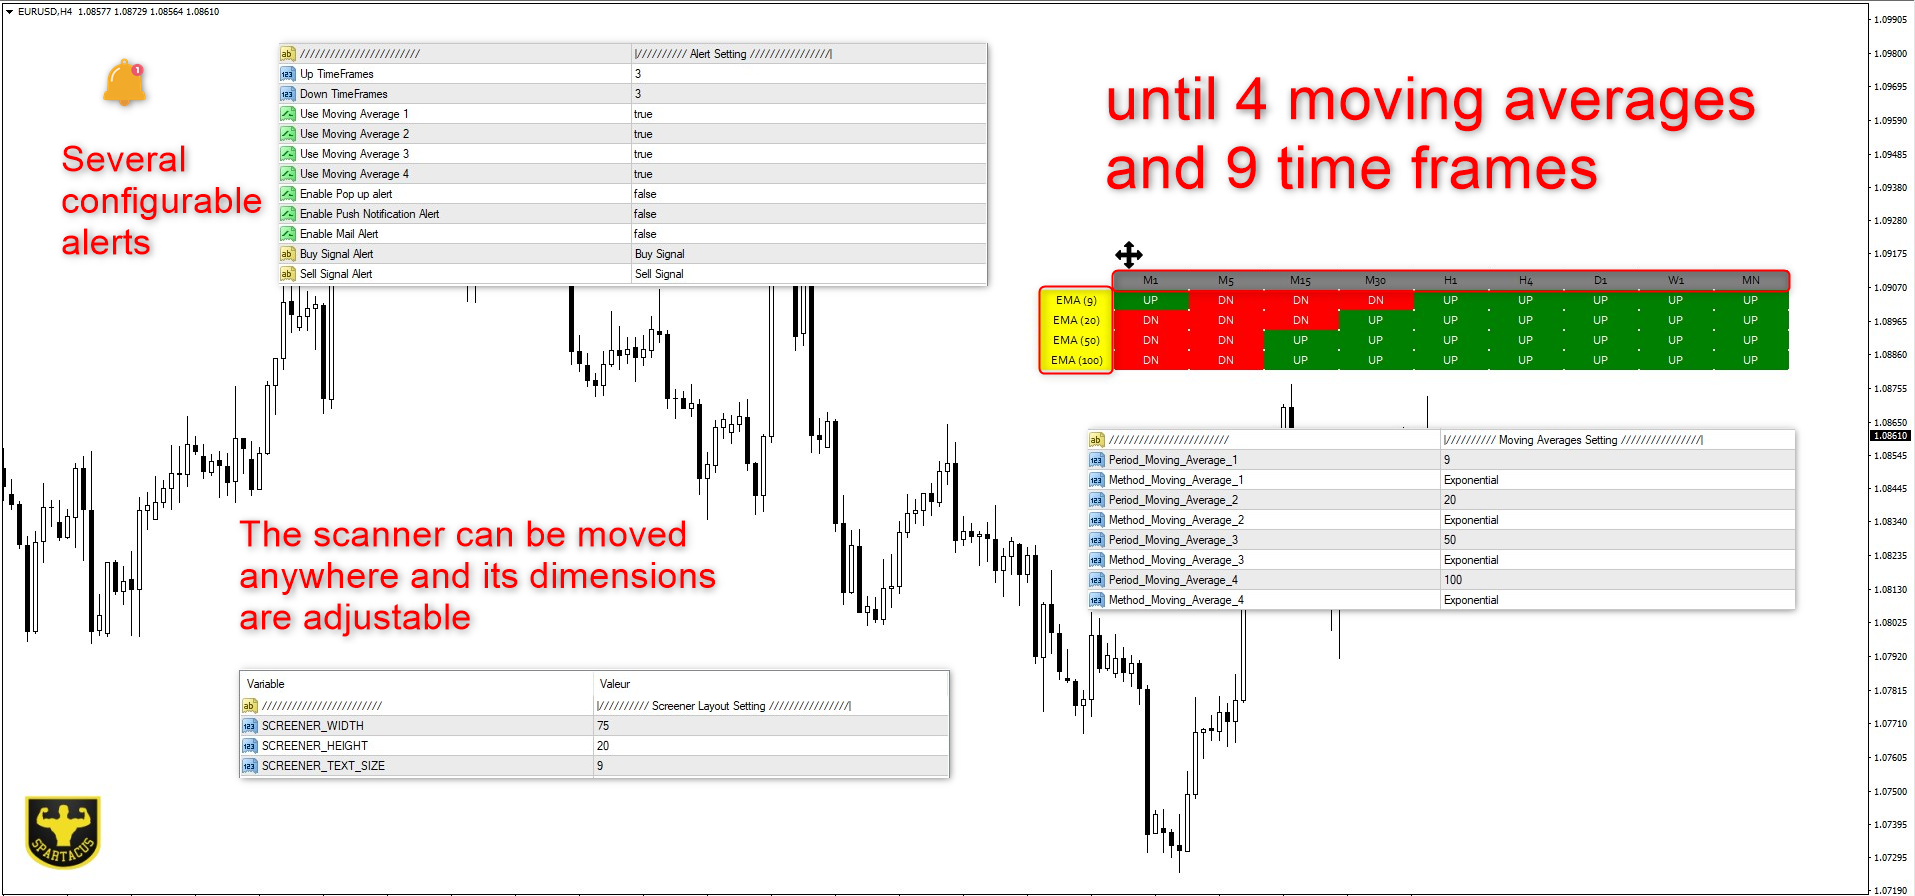
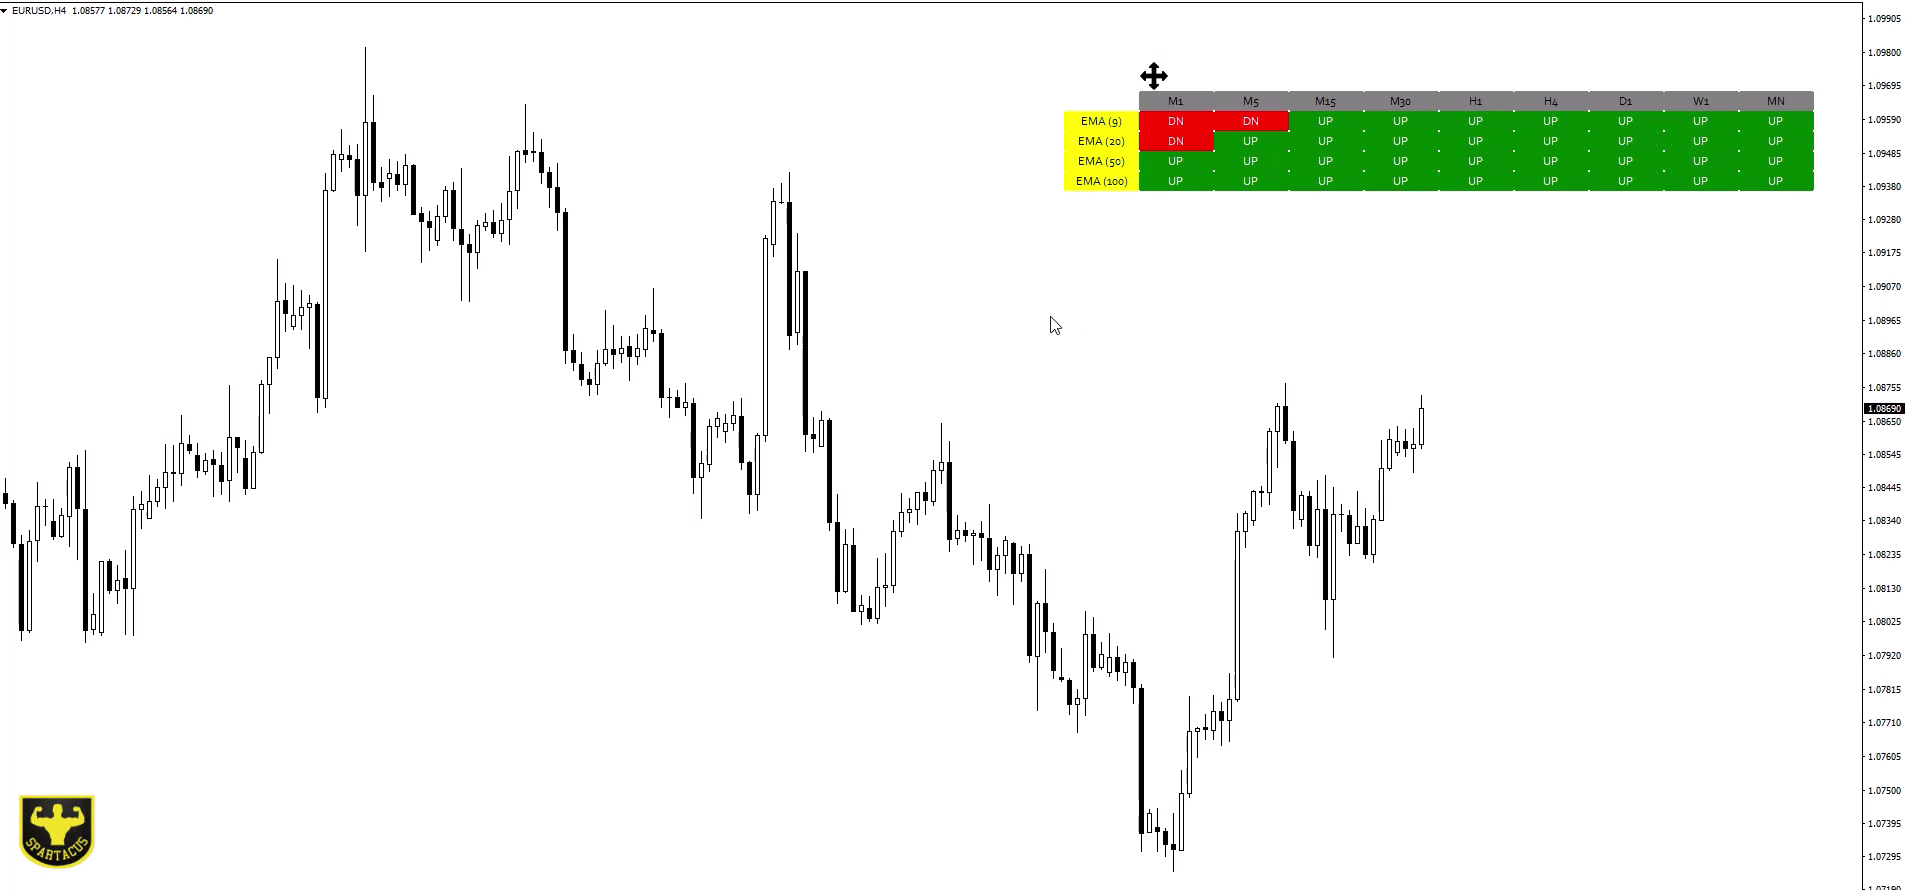
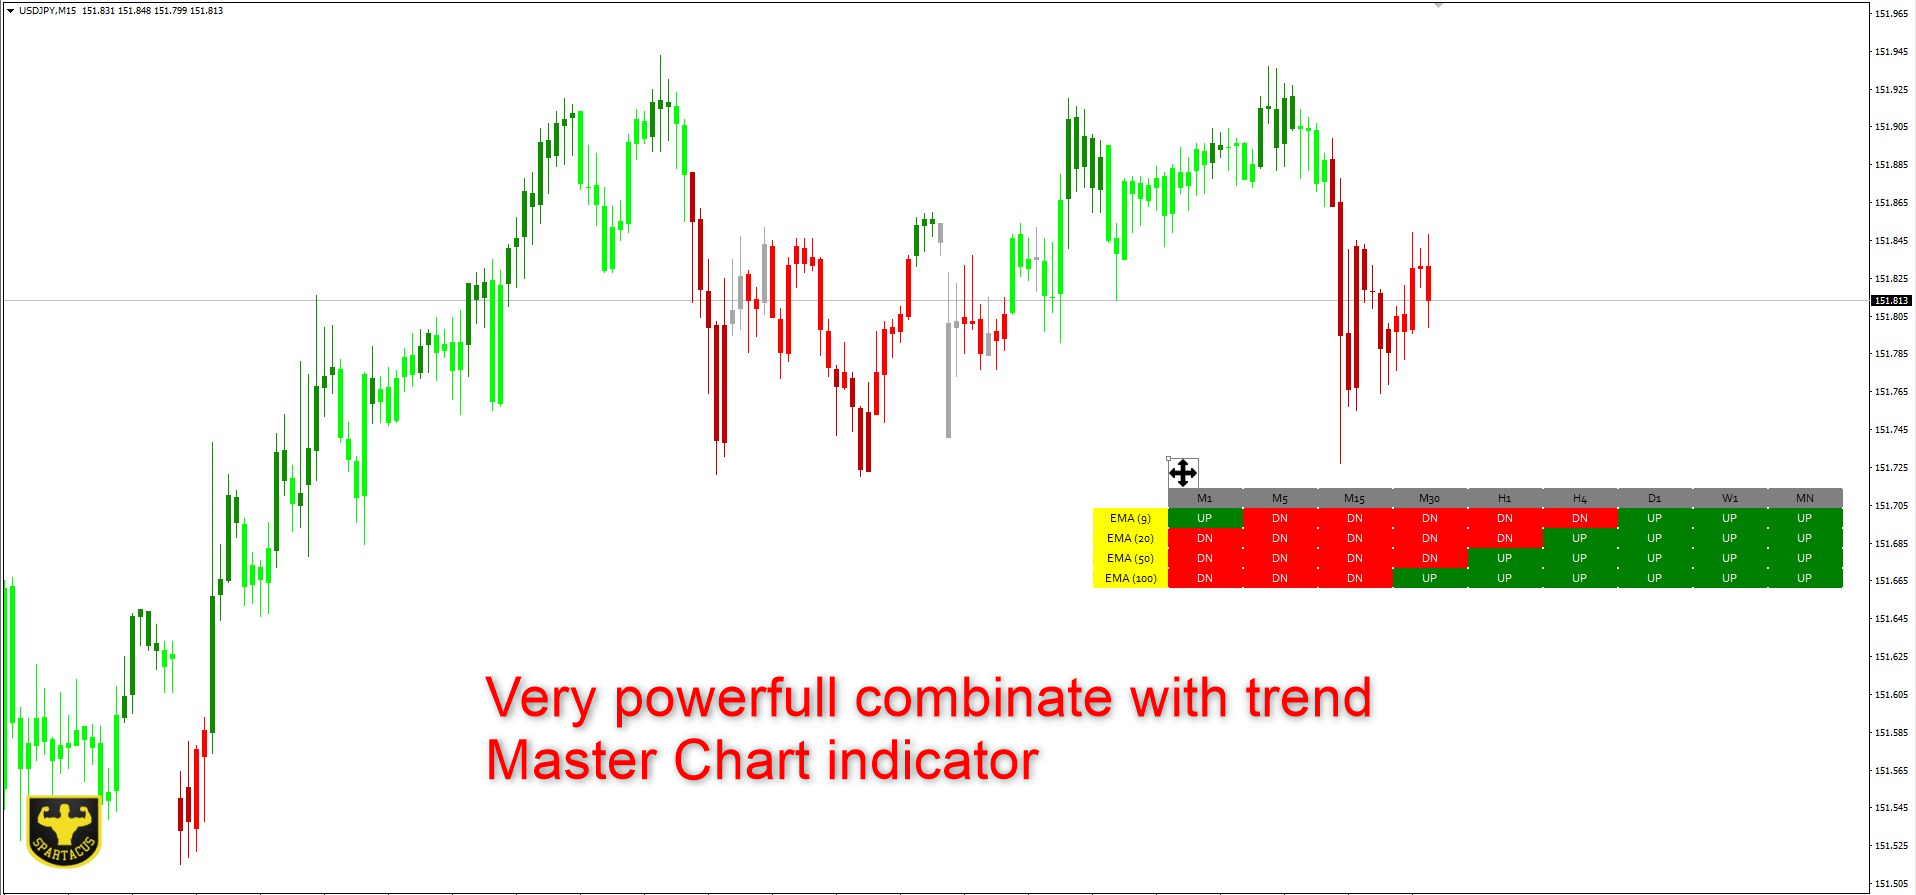
Moving Average Scanner, grafiği değiştirmeden, birkaç zaman dilimindeki trendi bir bakışta görmek için mükemmel, çok zaman dilimli bir tarayıcıdır.
9 zaman birimi üzerinden seçtiğiniz 4'e kadar hareketli ortalamayı kullanabilir. Tamamen yapılandırılabilir ve basitçe "sürükle ve bırak" yöntemiyle grafik üzerinde herhangi bir yere taşınabilir.
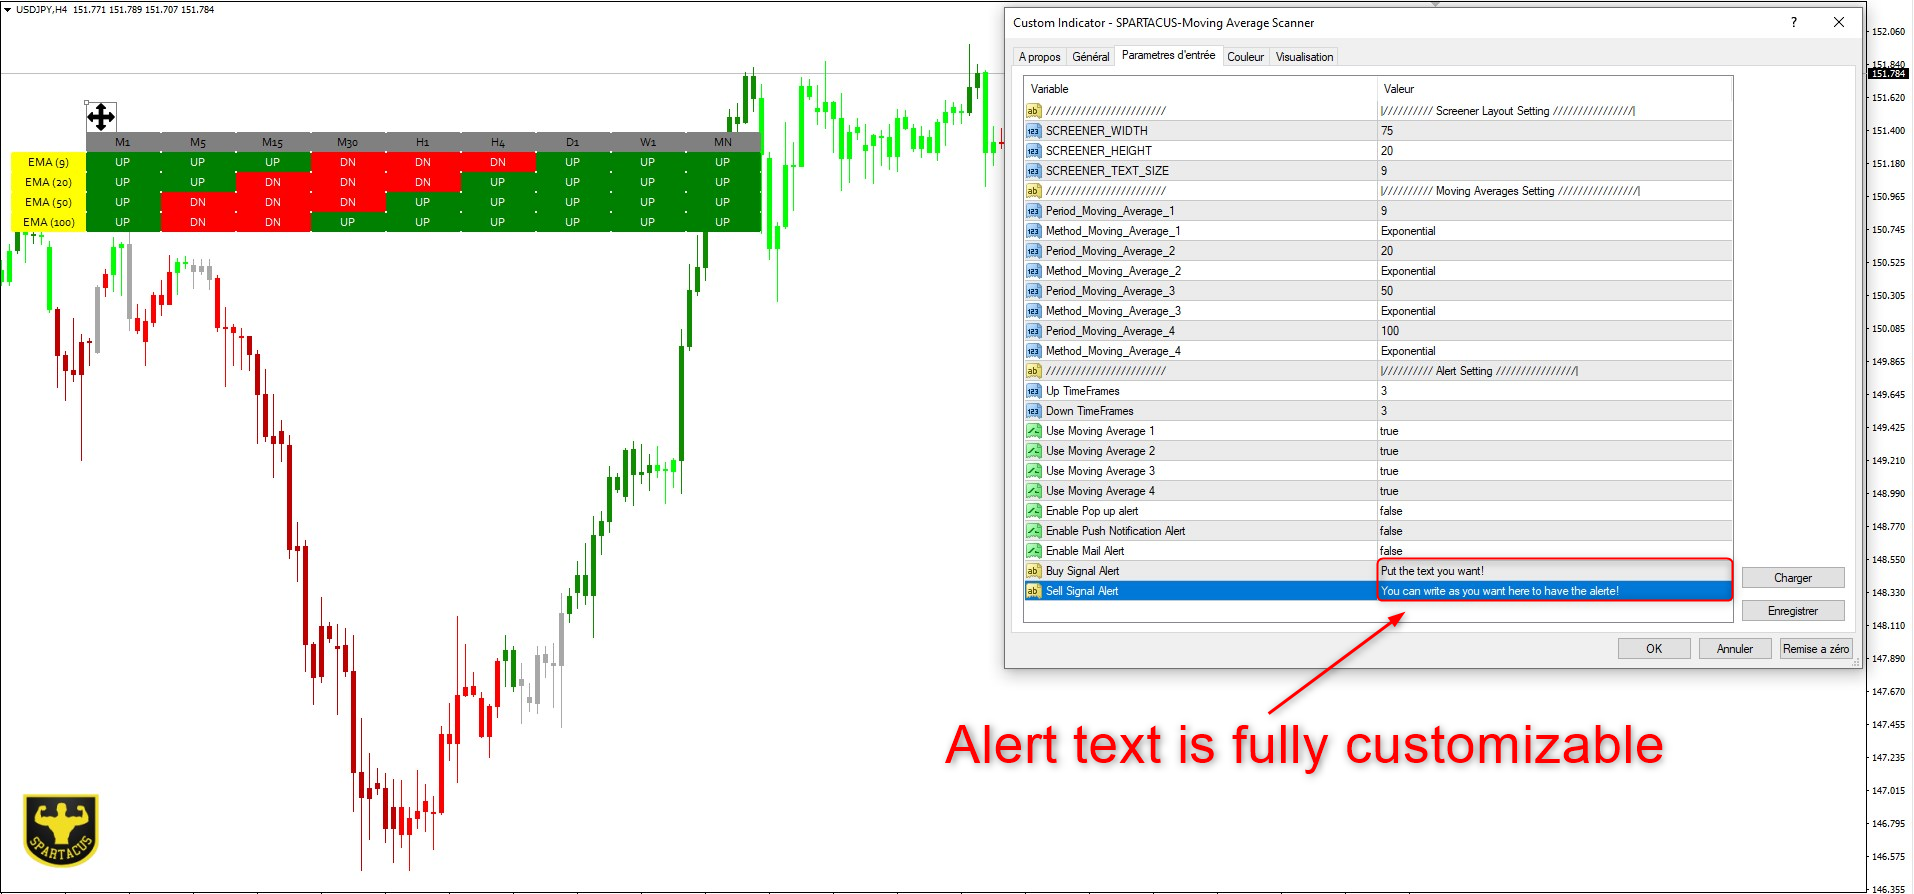
Hareketli ortalamalar 4 farklı hesaplama yöntemiyle yapılandırılabilir. Ayrıca hareketli ortalamaların sayısına ve dönem sayısına göre uyarılar da ayarlayabilirsiniz.
Giriş parametresi:
Eleyici Düzeni:
Grafikte görüntülenen tarayıcının istenen boyutunu ve ekran metninin boyutunu ayarlamanıza olanak tanır.
Hareketli ortalamalar:
4 farklı hareketli ortalama periyodu ve 4 hesaplama yöntemi yapılandırabilirsiniz: Basit/üstel/düzleştirilmiş ve doğrusal ağırlıklı.
Uyarılar:
Bir uyarı oluşturmak için tek yapmanız gereken, uyarıyı tetiklemek için seçilen hareketli ortalama(lar) ile birlikte istediğiniz sayıda zaman dilimini (yükseliş/düşüş) seçmektir.
Açılır pencerede/Push bildiriminde ve postada uyarılar mümkündür. Uyarı metni tamamen özelleştirilebilir.
SARTACUS©2024