Trend Master Chart MT5
- Göstergeler
- Frederic Jacques Collomb
- Sürüm: 1.0
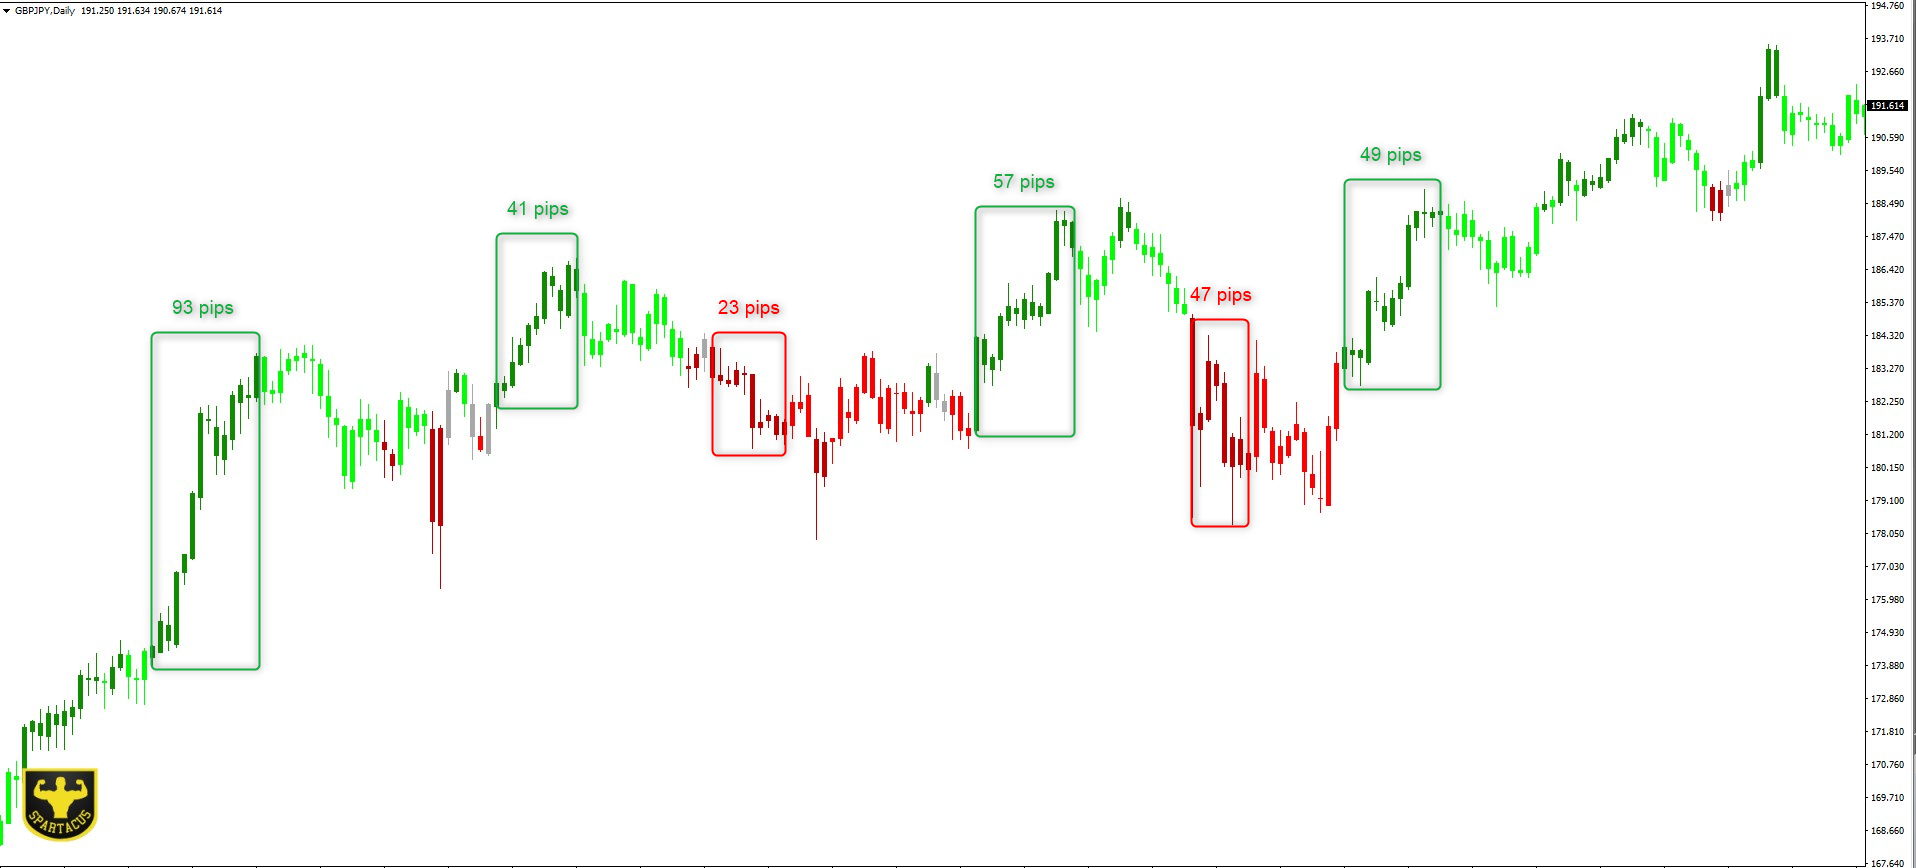
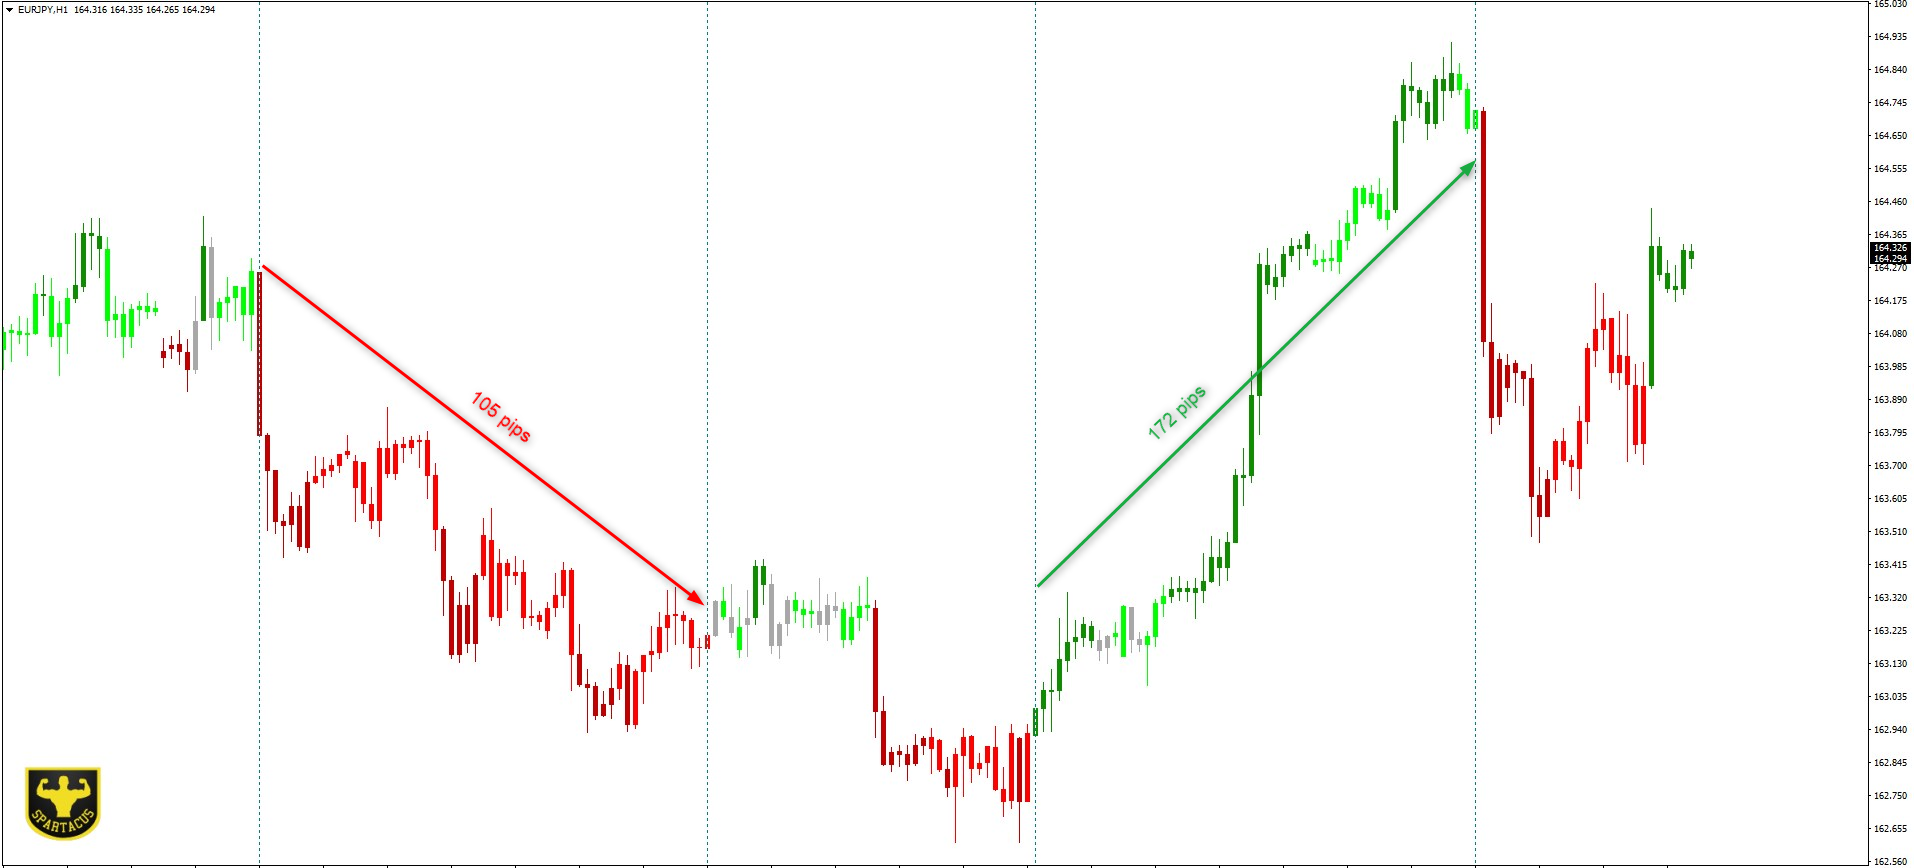
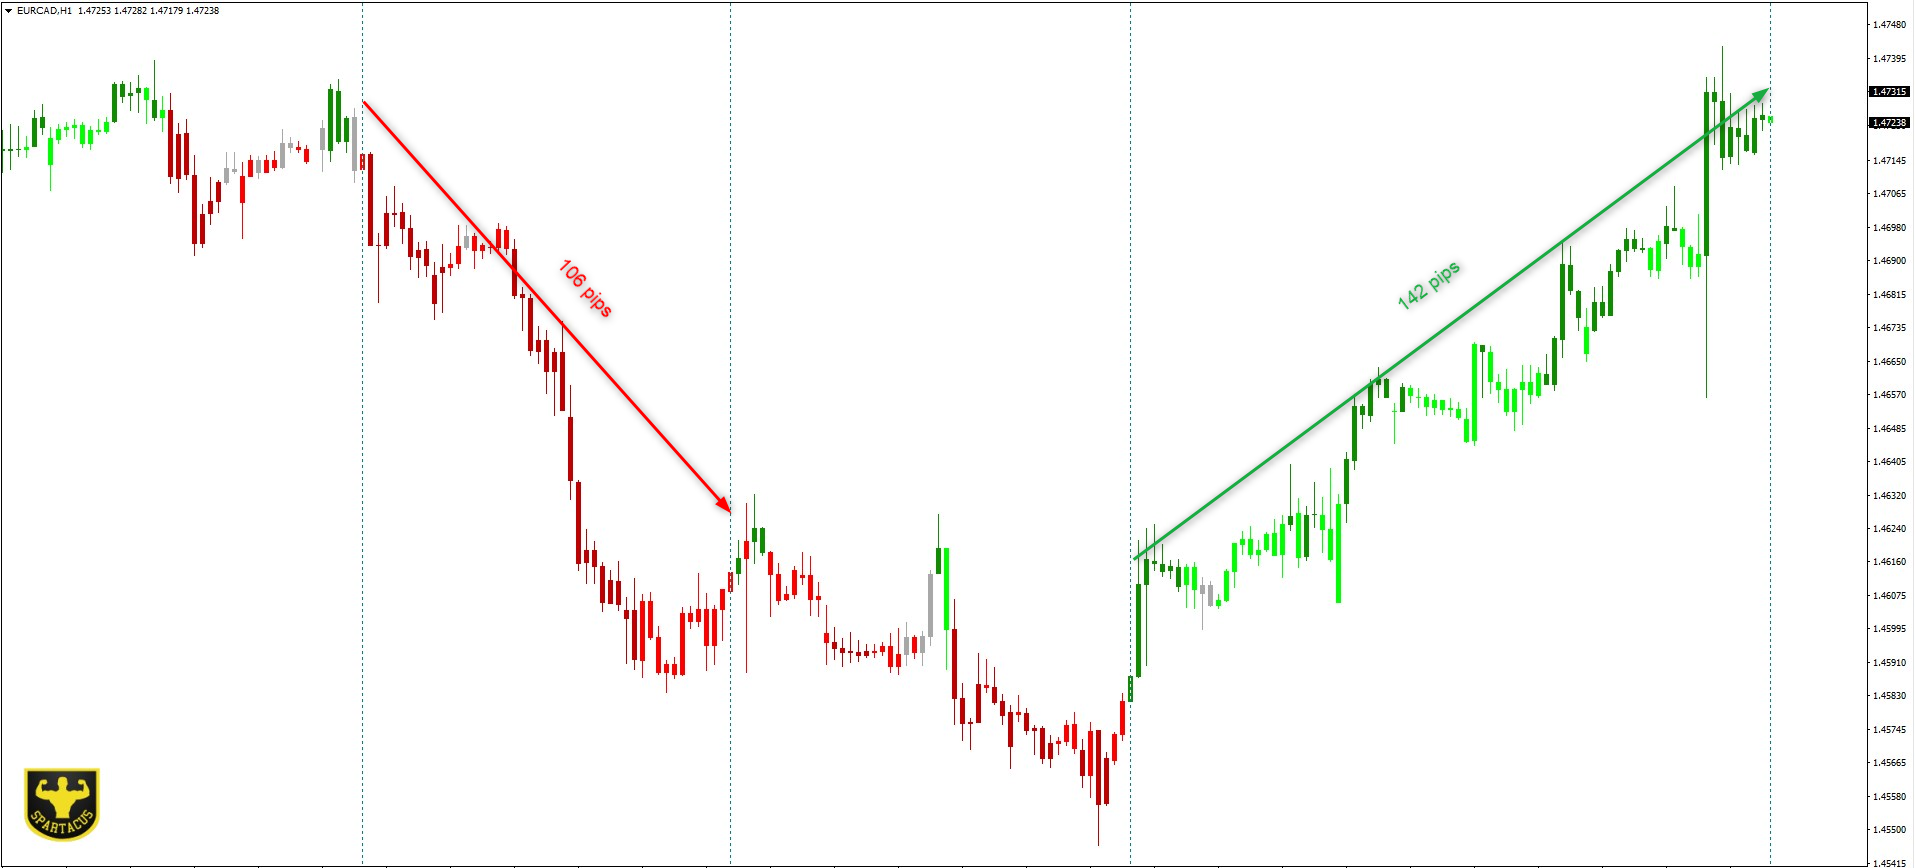
Trend Master Chart ihtiyacınız olan trend göstergesidir. Grafiği kaplar ve farklı pazar trendlerini/hareketlerini tanımlamak için renk kodlamasını kullanır. İki hareketli ortalamayı ve farklı osilatörleri birleştiren bir algoritma kullanır. Bu üç elementin periyotları değiştirilebilir. Herhangi bir zaman diliminde ve herhangi bir Çiftte çalışır.
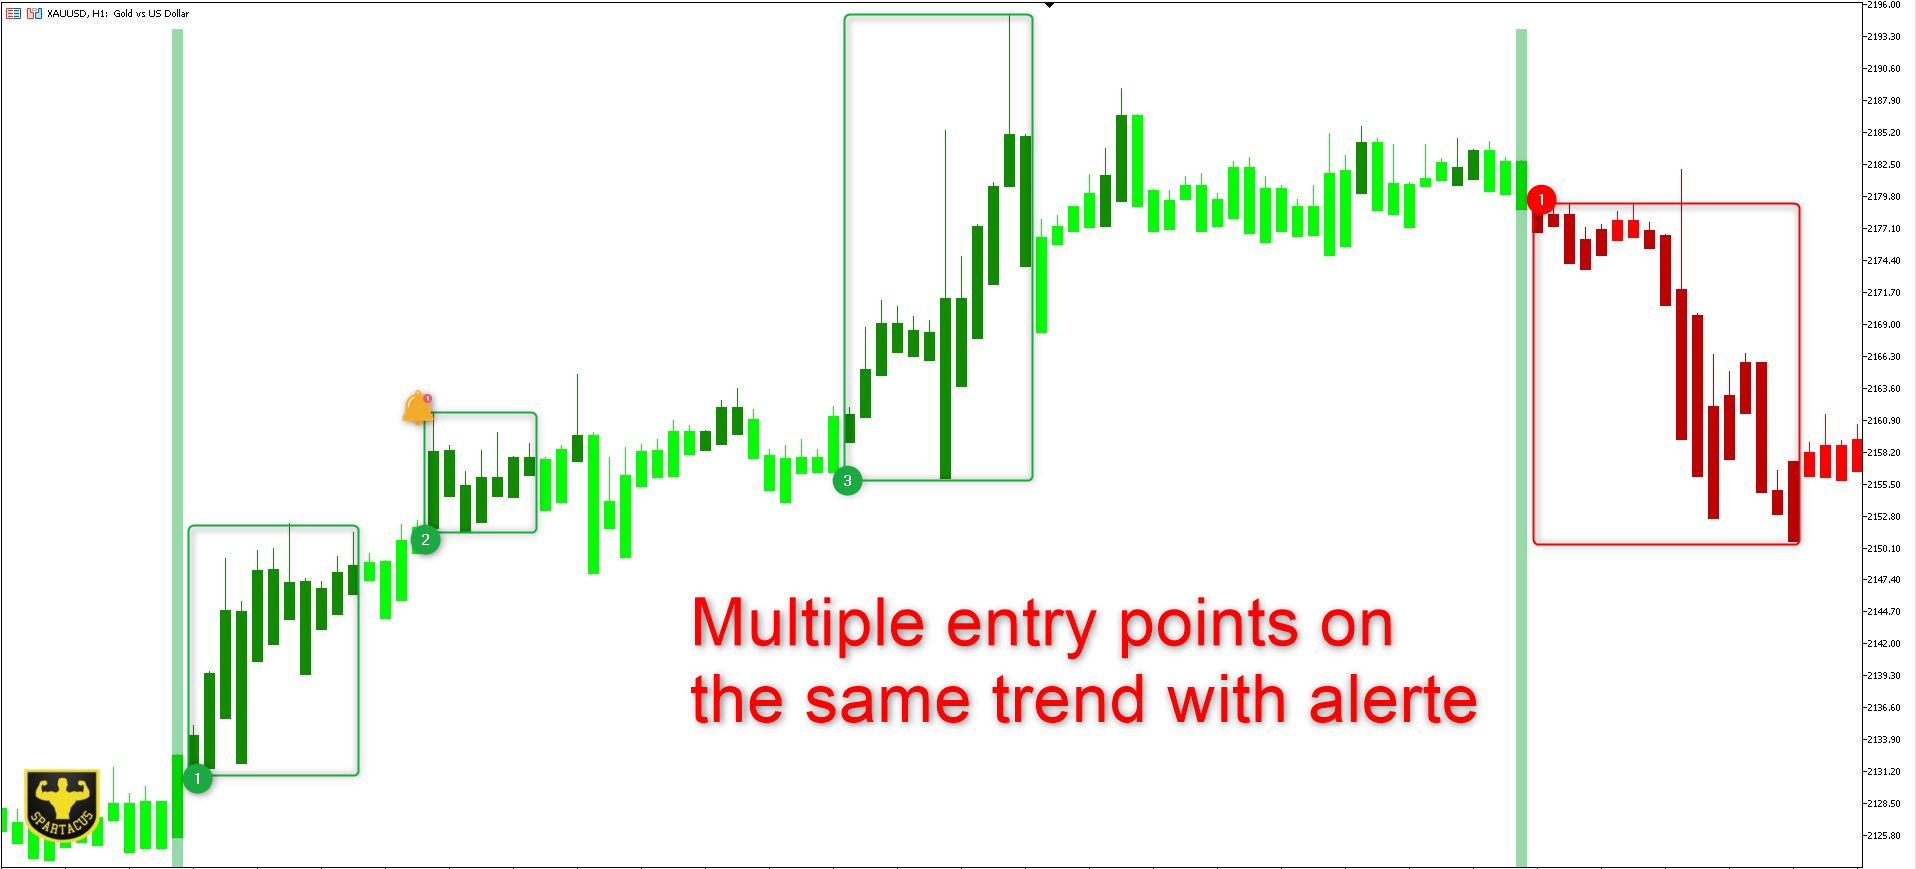
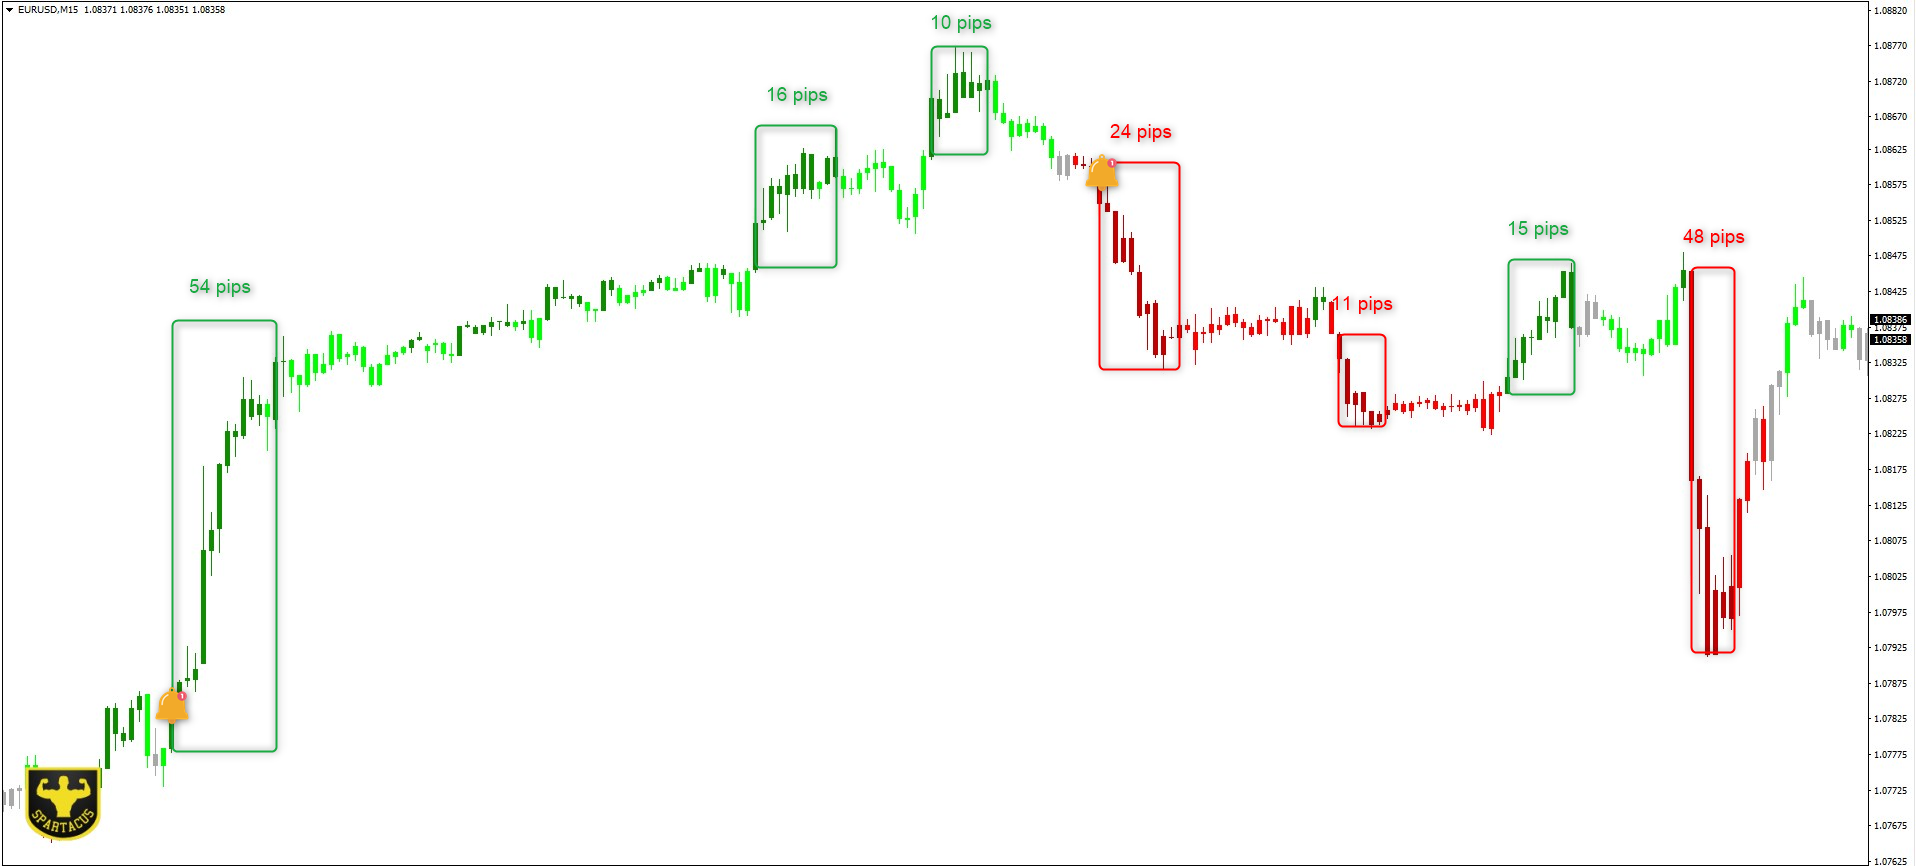
Bir bakışta yükseliş veya düşüş trendini ve bu trende farklı giriş noktalarını tespit edebileceksiniz. Örneğin, belirgin bir yükseliş eğilimi sırasında (açık yeşil renk), bu eğilim içindeki farklı piyasa hareketleri koyu yeşil mumlarla gösterilecektir. Yapılandırılabilir uyarılar, bu dürtülerden hiçbirini asla kaçırmamanıza olanak tanır.
MT4 sürümü.
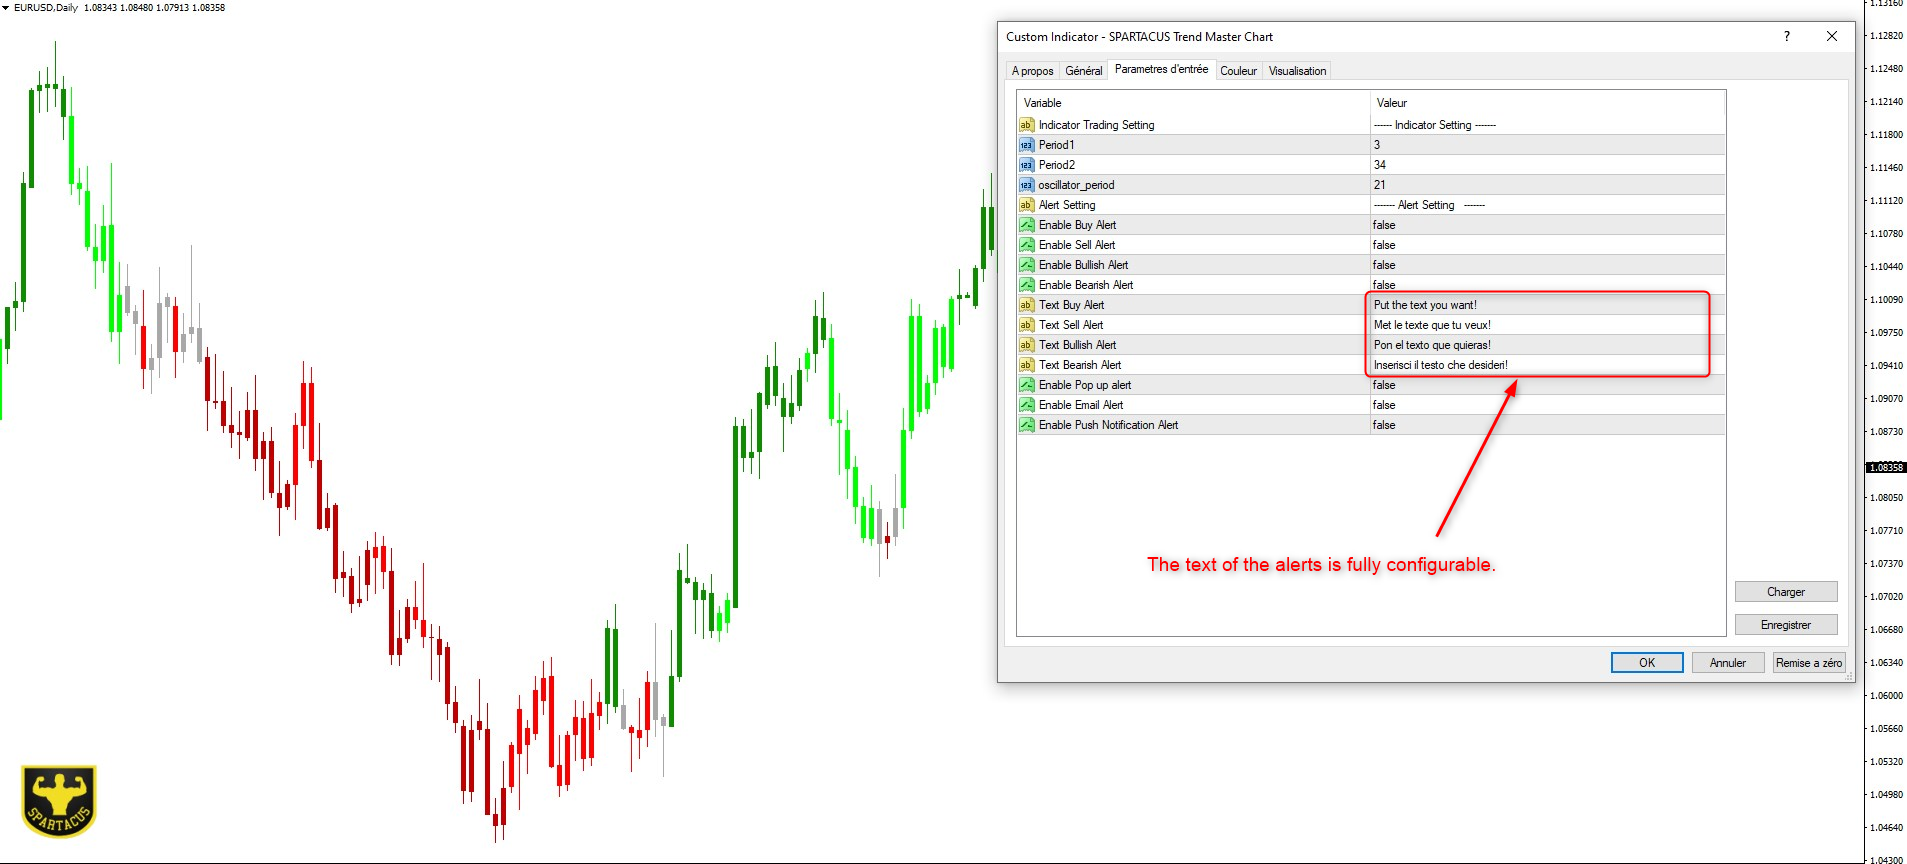
Giriş parametreleri:
Period 1: Hızlı dönem hareketli ortalama.
Period 2: Yavaş dönemli hareketli ortalama.
Oscillator period: osilatör dönemi.
Sell/Buy alert: piyasa dürtüsü uyarıları, trend giriş noktaları.
Bullish/Bearish alert: trend değişikliği durumunda uyarı.
Açılır pencere/posta ve Push bildiriminde uyarılar mümkündür. Tamamen yapılandırılabilir uyarı metni.
Diğer ücretsiz SARTACUS göstergelerini görmek istiyorsanız buraya tıklayın
SPARTACUS©2024


great work