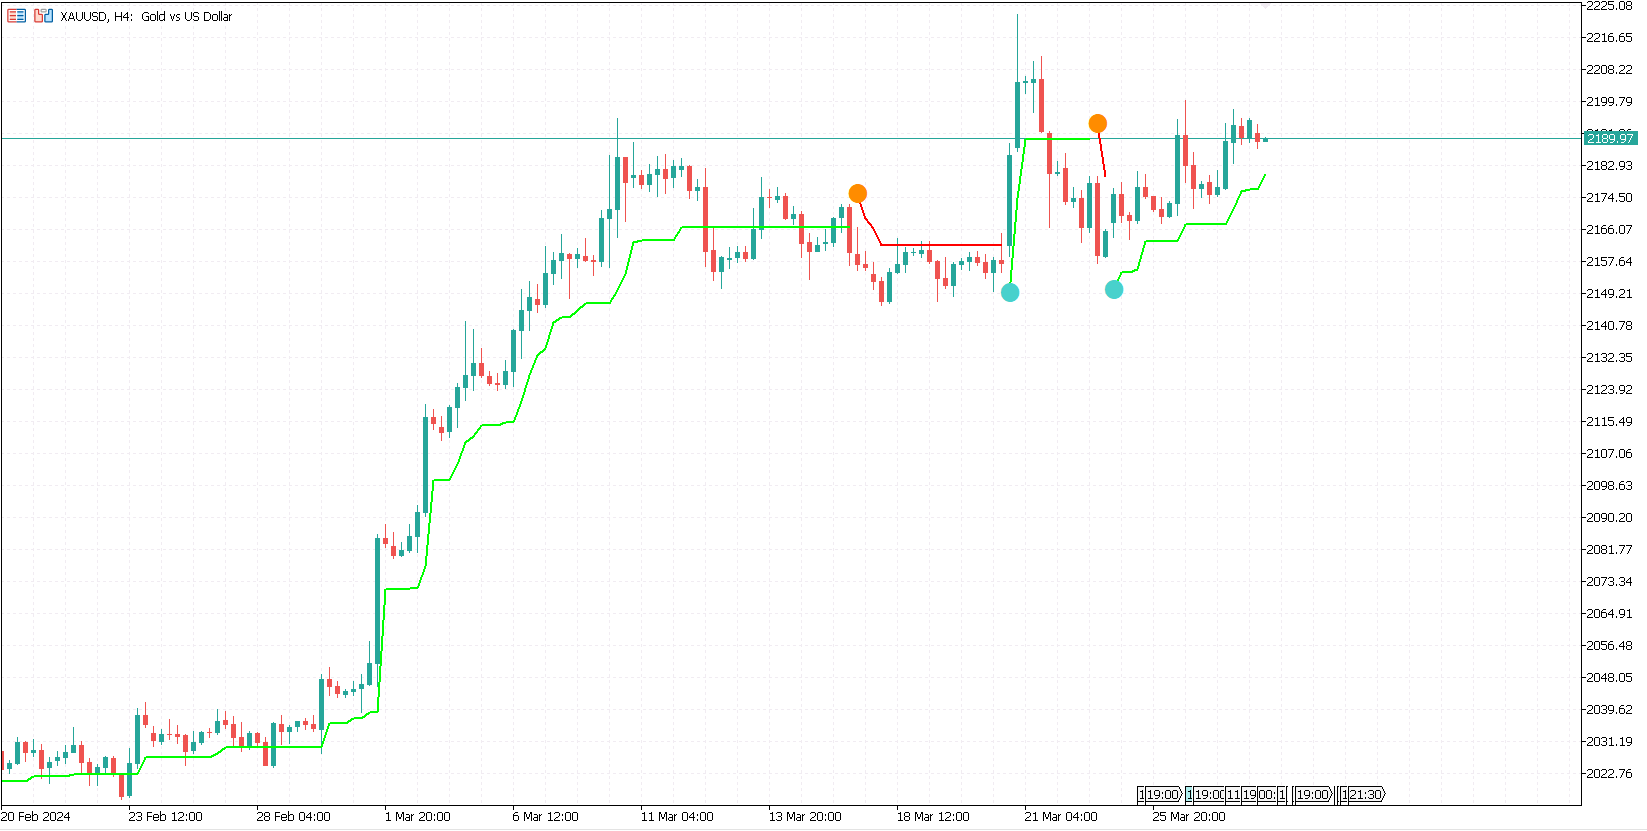
• Genel bakış
  • İncelemeler
  • Yorumlar

SuperTrendCCI

Ünlü Süper Trend göstergesinin tanıtım gerektirmeyen en kaliteli uygulaması.

Orijinal algoritmaya tamamen sadıktır ve CCI indikatörü ile güçlendirilmiştir.


- Ticareti kolay

- Her türlü uyarıyı uygular.

- Çok zaman dilimli bir kontrol paneli uygular.

- Yeniden boyanmaz ve arkadan boyanmaz.


Giriş parametreleri

- ATR Dönemi - Bu ortalama gerçek aralık dönemidir.

- ATR Çarpanı - Trendi tanımlayan ATR çarpanı.

- CCI - Trend takibini güçlü kılar.

- Maksimum Geçmiş Çubukları - Gösterge grafiğe yüklendiğinde değerlendirilecek geçmiş çubukların miktarı.


Uyarılar - Her türlü uyarıyı etkinleştirin veya devre dışı bırakın.

Önerilen ürünler
Gösterge, İKİLİ SEÇENEKLER için giriş sinyalleri üretir, grafikte bir ok çizer ve sesli bir uyarı verir. ÇALIŞMA SAATLERİ: 6.OO GMT/ 17.00 GMT (17.00 GMT'den sonra ve gece çok düşük volatilite ve hacim eksikliği nedeniyle önerilmez) ÇİFTLER: EUR/USD (@EU6), GBP/USD (BP6). Zaman dilimleri: 1,2,3,5,10,15 dakika En iyi zaman aralığı: 3 dakika SON KULLANMA TARİHİ: 1 mum Göstergenin çalışması için gerçek hacimlere (onay hacmi yok) ihtiyacı vardır: EUR/USD, GBP/USD ECC spot çiftlerinde çalı
I do not have the exact indicator for MT4 but the nearest possible look alike can be downloaded from here . Also you may check this link . This is the exact conversion from TradingView: "Donchian Trend Ribbon" By "LonesomeTheBlue". One of the coolest indicators out there to detect trend direction and strength. As a trader you always need such indicator to avoid getting chopped in range markets. There are ten buffers as colors to use in EAs also. The indicator is loaded light and non-repaint. Not
Harmonic Pro
Kambiz Shahriarynasab
Only 5 copies of the EA at $30! Next price --> $45 Find charts and signals based on harmonic patterns, which work great in 1-hour timeframes and up. Buy and sell signs based on different harmonic patterns as follows: 0: ABC_D 1: ABCD_E 2: 3Drive 3: 5_0 4: Gartley 5: Bat 6: Crab 7: Butterfly 8: Cypher 9: NenStar 10: Shark 11: AntiBat 12: AntiGartley 13: AntiCrab 14: AntiButterfly 15: AntiCypher 16: AntiNenStar 17: AntiShark How to use: When there is an opportunity to
Indicator Name: Signal Generator Non Repaint. The arrow is non-repaint. Its a non-repaint arrow or money back guarantee. Arrow appeared after candle closed. Very accurate. Time Frame: Any Assets: Any This is MT5 version I use this to trade Gold, US30, Nasdaq and Dax at New York and London Opening. TF m5/m15 Parameters: Push Notifications = True ( You can set the alert send to your mobile phone) To Setup Sending Alert to your mobile phone 1. At Metatrader Options > Options > Notifications > Ena
Reversible
Vitalii Zakharuk
Reversible indicator. You need to understand that any indicator is just a visual waveform. Currency pairs never rise or fall in a straight line. Their rises and falls are alternated by pullbacks and turns. The Reversible indicator contains an entire trading system, processes information from several technical instruments and the appearance of its signals is the final calculation result. The indicator itself evaluates how strong a signal appears in the market and when to change direction, si
This indicator closes the positions when Profit. This way you can achieve a goal without determine Take Profit.  Parameters: Profit: the amount of Dolllars you want to close when profit.  Just determine Profit section and open new positions. If Any of your positions reaches above Profit , Indicator will close automatically and you will recieve your Profit. 
KT Candlestick Patterns Scanner is a Multi-Symbol and Multi-Timeframe scanner that fetches and shows various candlestick patterns on 28 currency pairs and 9 time-frames concurrently . The scanner finds the candlestick patterns by loading the KT Candlestick Patterns indicator as a resource in the background. Features The scanner can find the candlestick patterns on 252* combinations of symbols and time-frames from a single chart. Open the signal's chart loaded with a predefined template with
This is a simple arrow system based on Engulfing Candlestick Pattern. It gives you alerts on your smartphone when there is an engulfing candlestick pattern happens. Which type of alerts available? 1. It paints on chart Up/Down Arrows. 2. Popup message and sound alert in trading terminal window. 3. Push notification or Alert on your Android and IOS mobile phones (requires MT4 or MT5 app installed!) *Note: Use it on higher timeframes like H4 (4 hours), D1 (1 Day) then find trade opportunities on s
The indicator scans for TD Combo signals in multiple timeframes for the all markets filtered and shows the results on Dashboard. Key Features Dashboard can be used for all markets It can scan for signals on MN1, W1, D1, H4, H1, M30, M15 ,M5, M1 timeframes Parameters UseMarketWatch: Set true to copy all symbols available in market watch MarketWatchCount : Set the number of symbols that you want to copy from the market watch list. CustomSymbols: Enter the custom symbols that you want to be availa
The indicator determines a special pattern of Joe Dinapoli. It gives very high probability buy and sell signals. Indicator does not repaint. Indicator Usage Buy Signal ''B'' Entry : Market buy order at signal bar close Stop : Low of signal bar Take Profit : First swing high Sell Signal ''S'' Entry : Market sell order at signal bar close Stop : High of signal bar Take Profit : First swing low Indicator Parameters Fast EMA : External Parameter (should be kept as default) Slow EMA: External Param
MACDmaxmin
Carlos Andrés Moya Erazo
3 (2)
The indicator shows when there are overpricing and divergences over a normalized MACD Plus, it displays signals with configurable alerts, self-regulating dynamic overprice levels, and a simple setup and interface. The indicator that automatically calculates overprices ranges! MACDmaxmin is an indicator based on the MACD oscillator that effectively identifies trend changes in price, as it is a momentum indicator that captures the trend and shows the relationship between two moving averages of th
RubdFx Perfect Reversal , The reversal indicator is used to determine areas of support and resistance by Drawing an arrow with a level of supply and demand ( ReversalZones ). - You will catch more swings by reducing the period, and less swings if you increase period - Mobile, computer and email alerts available . it is not pushed by price which means the arrow will stay in one place,suitable for scalping and long term trading  Also Compatible with all forex paris , BUY RULES;  open a buy positio
Candle Good Setup
Kibalo Alain Kabissa
You ask yourself the question every time you open your charts: how to win in trading? Will using a lot of indicators work? well know that I also asked myself the same questions when I first started trading. After testing many indicators, I realized that winning trading is simple and accurate trading. after several months of thinking and optimizing I was able to find my solution: Candle Good Setup Candle Good setup is a trend and entry timing indicator analyzing the market in multi-frame to give
Contact me for instruction, any questions! Introduction A flag can be used as an entry pattern for the continuation of an established trend. The formation usually occurs after a strong trending move. The pattern usually forms at the midpoint of a full swing and shows the start of moving. Bullish flags can form after an uptrend, bearish flags can form after a downtrend. Flag Pattern Scanner Indicator It is usually difficult for a trader to recognize classic patterns on a chart, as well as sear
Introduction This indicator detects volume spread patterns for buy and sell opportunity. The patterns include demand and supply patterns. You might use each pattern for trading. However, these patterns are best used to detect the demand zone (=accumulation area) and supply zone (=distribution area). Demand pattern indicates generally potential buying opportunity. Supply pattern indicates generally potential selling opportunity. These are the underlying patterns rather than direct price action. T
Squeeze Momentum Indicator for MetaTrader 5 - Unleash the Power of Market Momentum Introducing the "Squeeze Momentum Indicator" for MetaTrader 5, your gateway to mastering market momentum. This advanced tool is meticulously crafted to provide you with actionable insights into market dynamics, helping you make well-informed trading decisions. Basic Details : Indicator Type : Squeeze Momentum Indicator for MetaTrader 5 Key Metrics : Real-time analysis of market momentum and volatility. Customizati
The indicator is designed to close positions on the market in time. For example: to take profits ahead of schedule if the price has not reached TakeProfit, and the market is turning around. The indicator analyzes the momentum, not the trend. He does not give any information about the trend. The indicator is well suited for finding divergence. The Ershov 38 Parrots indicator dynamically adjusts to the market and detects price movement impulses of medium and high amplitude. It almost does not rea
KT DMA is a modified and advanced version of the classic Displaced Moving Averages with buy/sell crossover alerts and a Multi-Timeframe scanner that shows DMA's direction across each real-time time frame. A Displaced Moving Average is a simple moving average that moves ahead or backward in a time frame (either short-term or long-term). It also allows you to predict price movement more accurately. Features Depicts the trend direction using the alignment of three moving averages. Buy/Sell signa
Gösterge, bir miktar düzeltmeden sonra aynı anda trendi takip eden bir ticarete girmeye yardımcı olur. Belirli sayıda çubuk üzerinde bir döviz çiftinin güçlü trend hareketlerini bulur ve ayrıca bu trend için düzeltme seviyeleri bulur. Eğilim yeterince güçlüyse ve düzeltme parametrelerde belirtilene eşitse, gösterge bunu bildirir. Farklı düzeltme değerleri ayarlayabilirsiniz, 38, 50 ve 62 (Fibonacci seviyeleri) değerleri daha uygundur. Ayrıca minimum trend uzunluğunu, aranacak çubuk geçmişi sayı
- This is an implementation of OCC ==> open close cross - This indicator applies twelve different averaging methods to open and close prices separately to signal the trend switching. - All MA methods are set as input as well as period and different offsets applied to linear regression and ALMA averaging. - Buffers 16 and 17 can be used in EAs to detect trend direction. - You can message in private chat for further changes you need.
PAX BDB Trade Chaos system of Bill Williams   (Bearish/Bullish divergent bar). One of the signals of the "Trade Chaos" system of Bill Williams. (First wiseman) When bar moving away from the  "Alligator" indicator and there is divergence on the Awesome Oscillator indicator, it shows a potential point of movement change. It is based on the opening/closing of the bar, the position relative to the previous ones, the Alligator and AO. When trading, the entrance is at the breakthrough of the bar(sh
Stock Trend Navigator
Mohammad Taher Halimi Tabrizi
In the fast-paced and ever-evolving world of stock trading, having a reliable compass is essential for navigating the complexities of the financial markets. Meet the Stock Trade Navigator, your trusted partner in the quest for investments. Unlock the Power of Data: Our Stock Trade Navigator is not just a tool; it's your data-driven co-pilot. Harnessing cutting-edge algorithms and real-time market data, it empowers you with a comprehensive view of the financial landscape, enabling you to make inf
To get access to MT4 version please click here . - This is the exact conversion from TradingView: "Twin Range Filter" by " colinmck ". - This is a light-load processing and non-repaint indicator. - All input options are available.  - Buffers are available for processing in EAs. - You can message in private chat for further changes you need. Thanks for downloading
1. Why did I develop this series of indicators I found that most traders need to use multiple time frame indicators. They usually switch time frame to see indicators. However, once the timeframe is switched, you cannot see the  corresponding relationship  between  the price in the smaller timeframe  and  the indicator in the larger timeframe . For example: if your price chart is in H1 timeframe, you can see H4, D1 and W1 indicators in H1 timeframe Chart. This is more helpful for you to find t
MACD Alerts MT5
KEENBASE SOFTWARE SOLUTIONS
3 (2)
KT MACD Alerts is a personal implementation of the standard MACD indicator available in Metatrader. It provides alerts and also draws vertical lines for the below two events: When MACD crosses above the zero line. When MACD crosses below the zero line. Features It comes with an inbuilt MTF scanner, which shows the MACD direction on every time frame.  A perfect choice for traders who speculate the MACD crossovers above/below the zero line. Along with the alerts, it also draws the vertical line
Introduction to Fractal Pattern Scanner Fractal Indicator refers to the technical indicator that makes use of the fractal geometry found in the financial market. Fractal Pattern Scanner is the advanced Fractal Indicator that brings the latest trading technology after the extensive research and development work in the fractal geometry in the financial market. The most important feature in Fractal Pattern Scanner is the ability to measure the turning point probability as well as the trend probabil
A useful scanner/dashboard that shows the RSI values for multiple symbols and Time-frames. It can be easily hidden/displayed with a simple click on the scanner man top left of the dashboard. You can input upper and lower RSI values and the colours can be set to show when above/below these values. The default values are 70 and 30. There are also input colours for when the RSI is above or below 50 (but not exceeding the upper/lower levels Symbols and time-frames are input separated by commas.
Ladder Heaven
Gia Thong Nguyen
If you have difficulty determining the trend as well as entry points, stop loss points, and take profit points, "Ladder Heaven" will help you with that. The "Ladder Heaven" algorithm is operated on price depending on the parameters you input and will provide you with signals, trends, entry points, stop loss points, take profit points, support and resistance in the trend That direction. Helps you easily identify trends, stop losses and take profits in your strategy! MT4 Version: Click here F
FREE
Market Noise Piyasa Gürültüsü, fiyat grafiğindeki piyasa aşamalarını belirleyen ve aynı zamanda bir birikim veya dağıtım aşaması meydana geldiğinde net, yumuşak trend hareketlerini gürültülü düz hareketlerden ayıran bir göstergedir. Her aşama kendi ticaret türü için iyidir: trendi takip eden sistemler için trend, agresif sistemler için ise yatay. Piyasa gürültüsü başladığında işlemlerden çıkmaya karar verebilirsiniz. Aynı şekilde ve tam tersi, gürültü biter bitmez agresif ticaret sistemlerini
EYeQ Göstergesi, STEP INDEX, VOLATILITY 10, 25,50,75 100, BOOM ve CRUSH'ta giriş sinyalleri sunmak için güçlü bir araçtır. BOOM ve CRUSH 300, 500 ve 1000'de SPIKES yakalamak için daha etkilidir. EYeQ göstergesi, piyasaları birden fazla zaman diliminde analiz eder ve trendlere göre en uygun giriş noktalarını bulur. Sinyaller yayınlandığında bilgilendirilebilmeniz için yalnızca masaüstü uyarılarını açmanız gerekir. Telefonlar ve tabletler gibi diğer taşınabilir cihazlara yönelik anlık bildiri
Bu ürünün alıcıları ayrıca şunları da satın alıyor
Öncelikle, bu Ticaret Sistemi'nin Non-Repainting, Non-Redrawing ve Non-Lagging Göstergesi olduğunu vurgulamak önemlidir, bu da hem manuel hem de robot ticareti için ideal hale getirir. "Smart Trend Trading System MT5", yeni ve deneyimli tüccarlar için özelleştirilmiş kapsamlı bir ticaret çözümüdür. 10'dan fazla premium göstergeyi birleştiriyor ve 7'den fazla sağlam ticaret stratejisi sunuyor, bu da çeşitli piyasa koşulları için esnek bir seçim yapar. Trend Takip Stratejisi: Trendleri etkili bir
Atomic Analyst MT5
Issam Kassas
4.82 (11)
Öncelikle belirtmek gerekir ki bu Ticaret Göstergesi Yeniden Çizim Yapmaz, Gecikmez ve Gecikme Göstermez, bu da hem manuel hem de robot ticareti için ideal hale getirir. Atom Analisti, Piyasada Daha İyi Bir Avantaj Bulmak İçin Fiyatın Gücünü ve Momentumunu Kullanan PA Fiyat Hareketi Göstergesidir. Gürültüleri ve Yanlış Sinyalleri Kaldırmaya ve Ticaret Potansiyelini Artırmaya Yardımcı Olan Gelişmiş Filtrelerle Donatılmıştır. Birden fazla katmanlı karmaşık göstergeler kullanarak, Atom Analisti
FX Volume MT5
Daniel Stein
4.94 (17)
Sabah Brifingimiz aracılığıyla ayrıntılar ve ekran görüntüleri ile günlük piyasa güncellemenizi alın burada mql5 ve on Telegram ! FX Volume, bir brokerin bakış açısından piyasa duyarlılığı hakkında GERÇEK bir fikir veren İLK ve TEK hacim göstergesidir. COT raporlarından çok daha hızlı bir şekilde, brokerlar gibi kurumsal piyasa katılımcılarının Forex piyasasında nasıl konumlandıklarına dair harika bilgiler sağlar. Bu bilgileri doğrudan grafiğinizde görmek, ticaretiniz için gerçek oyun değiştir
Quantum Trend Sniper
Bogdan Ion Puscasu
5 (37)
Tanıtım       Kuantum Trend Keskin Nişancı Göstergesi   , trend tersine dönmeleri belirleme ve ticaret yapma şeklinizi değiştiren çığır açan MQL5 Göstergesi! 13 yılı aşkın ticaret tecrübesine sahip deneyimli tüccarlardan oluşan bir ekip tarafından geliştirilmiştir.       Kuantum Trend Keskin Nişancı Göstergesi       trend dönüşlerini son derece yüksek doğrulukla belirlemenin yenilikçi yolu ile ticaret yolculuğunuzu yeni zirvelere taşımak için tasarlanmıştır. ***Kuantum Trend Keskin Nişancı Gö
Trend Screener Pro MT5
STE S.S.COMPANY
4.89 (61)
Trend Göstergesi, Trend Alım Satım ve Filtreleme için Çığır Açan Benzersiz Çözüm, Tüm Önemli Trend Özellikleriyle Tek Bir Araç İçinde Yerleştirildi! Forex, emtialar, kripto para birimleri, endeksler ve hisse senetleri gibi tüm sembollerde/araçlarda kullanılabilen %100 yeniden boyamayan çoklu zaman çerçevesi ve Çoklu para birimi göstergesidir. Trend Screener, grafikte noktalarla ok trend sinyalleri sağlayan etkili bir trend trend göstergesidir. Trend analizörü göstergesinde bulunan özellikler: 1.
FX Power MT5 NG
Daniel Stein
5 (4)
Sabah Brifingimiz burada mql5 ve on Telegram! FX Power MT5 NG , uzun zamandır çok popüler olan döviz gücü ölçerimiz FX Power'ın yeni neslidir. Peki bu yeni nesil güç ölçer ne sunuyor? Orijinal FX Power hakkında sevdiğiniz her şey PLUS GOLD/XAU güç analizi Daha da hassas hesaplama sonuçları Ayrı ayrı yapılandırılabilir analiz dönemleri Daha da iyi performans için özelleştirilebilir hesaplama limiti Özel çokluDaha fazlasını görmek isteyenler için örnek ayarlar Her grafikte en sevdiğiniz renkler i
Top indicator for MT5   providing accurate signals to enter a trade without repainting! It can be applied to any financial assets:   forex, cryptocurrencies, metals, stocks, indices .  Watch  the video  (6:22) with an example of processing only one signal that paid off the indicator! MT4 version is here It will provide pretty accurate trading signals and tell you when it's best to open a trade and close it. Most traders improve their trading results during the first trading week with the help of
Öncelikle, bu Ticaret Aracının Non-Repainting, Non-Redrawing ve Non-Lagging Gösterge olduğunu vurgulamakta fayda var, bu da onu profesyonel ticaret için ideal hale getiriyor. Akıllı Fiyat Hareketi Kavramları Göstergesi, hem yeni hem de deneyimli tüccarlar için çok güçlü bir araçtır. İleri ticaret fikirlerini, Inner Circle Trader Analizi ve Smart Money Concepts Ticaret Stratejileri gibi 20'den fazla kullanışlı göstergeyi bir araya getirerek bir araya getirir. Bu gösterge, büyük kurumların tica
RelicusRoad Pro MT5
Relicus LLC
4.82 (22)
Şimdi 147 $ (birkaç güncellemeden sonra 499 $ 'a yükseliyor) - Sınırsız Hesaplar (PC'ler veya Mac'ler) RelicusRoad Kullanım Kılavuzu + Eğitim Videoları + Özel Discord Grubuna Erişim + VIP Durumu PİYASAYA BAKMAK İÇİN YENİ BİR YOL RelicusRoad, forex, vadeli işlemler, kripto para birimleri, hisse senetleri ve endeksler için dünyanın en güçlü ticaret göstergesidir ve yatırımcılara kârlı kalmaları için ihtiyaç duydukları tüm bilgileri ve araçları sağlar. Başlangıç ​​seviyesinden ileri seviyey
Auto Order Block with break of structure based on ICT and Smart Money Concepts Futures Break of Structure ( BoS )             Order block ( OB )            Higher time frame Order block / Point of Interest ( POI )    shown on current chart           Fair value Gap ( FVG ) / Imbalance   ,  MTF      ( Multi Time Frame )    Volume Imbalance     ,  MTF          vIMB Gap’s Equal High / Low’s     ,  MTF             EQH / EQL Liquidity               Current Day High / Low           HOD /
XQ Indicator MetaTrader 5
Marzena Maria Szmit
5 (1)
Step into the realm of Forex trading with confidence and precision using XQ, a cutting-edge Forex indicator designed to elevate your trading game to unprecedented heights. Whether you're a seasoned trader or just stepping into the world of currency exchange, XQ Forex Indicator empowers you with the insights and signals needed to make informed trading decisions. The signal conditions are a combination of three indicators, and XQ Forex Indicator only display  medium and long-term trends . The ind
Blahtech Supply Demand MT5
Blahtech Limited
4.57 (14)
Was: $299  Now: $99   Supply Demand uses previous price action to identify potential imbalances between buyers and sellers. The key is to identify the better odds zones, not just the untouched ones. Blahtech Supply Demand indicator delivers functionality previously unavailable on any trading platform. This 4-in-1 indicator not only highlights the higher probability zones using a multi-criteria strength engine, but also combines it with multi-timeframe trend analysis, previously confirmed swings
Advanced Supply Demand MT5
Bernhard Schweigert
4.53 (15)
Herhangi bir Acemi veya Uzman Tüccar için En İyi Çözüm! Bu gösterge benzersiz, yüksek kaliteli ve uygun fiyatlı bir ticaret aracıdır çünkü bir dizi tescilli özelliği ve yeni bir formülü bir araya getirdik. Bu güncelleme ile çift zaman dilimi dilimlerini gösterebileceksiniz. Yalnızca daha yüksek bir TF gösteremeyeceksiniz, aynı zamanda TF grafiğini ve ARTIK daha yüksek TF'yi de gösterebileceksiniz: YUVARLAK BÖLGELERİ GÖSTERMEK. Tüm Arz Talebi tüccarları buna bayılacak. :) Önemli Bilgiler Açıkland
AW Trend Predictor MT5
AW Trading Software Limited
4.76 (54)
Tek bir sistemde trend ve kırılma seviyelerinin kombinasyonu. Gelişmiş bir gösterge algoritması piyasa gürültüsünü filtreler, trendi, giriş noktalarını ve olası çıkış seviyelerini belirler. Gösterge sinyalleri, sinyal geçmişinin etkinliğini gösteren en uygun enstrümanların seçilmesine izin veren bir istatistiksel modüle kaydedilir. Gösterge Kâr Al ve Zararı Durdur işaretlerini hesaplar. Kılavuz ve talimatlar ->   BURAYA   / MT4 versiyonu ->   BURAYA Gösterge ile nasıl ticaret yapılır: Trend Pre
ICT, SMC, SMART MONEY CONCEPTS, SMART MONEY, Smart Money Concept, Support and Resistance, Trend Analysis, Price Action, Market Structure, Order Blocks, BOS/CHoCH,   Breaker Blocks ,  Momentum Shift,   Supply&Demand Zone/Order Blocks , Strong Imbalance,   HH/LL/HL/LH,    Fair Value Gap, FVG,  Premium  &   Discount   Zones, Fibonacci Retracement, OTE, Buy Side Liquidity, Sell Side Liquidity, BSL/SSL Taken, Equal Highs & Lows, MTF Dashboard, Multiple Time Frame, BigBar, HTF OB, HTF Market Structure
TPSpro TRENDPRO  - is a trend indicator that automatically analyzes the market and provides information about the trend and each of its changes, as well as giving signals for entering trades without redrawing! The indicator uses each candle, analyzing them separately. referring to different impulses - up or down impulse. Exact entry points into transactions for currencies, crypto, metals, stocks, indices!  -  Version MT4                  DETAILED DESCRIPTION        /       TRADING SETUPS       
Gann Kare Göstergesi, W.D. Gann tarafından yazılan "Piyasa Tahminleri için Matematiksel Formül" makalesine dayalı güçlü bir piyasa analizi aracıdır. Bu araç, piyasa analizi için matematiksel ve Gann teorilerini kullanarak hassas analizler gerçekleştirir. 144, 90, 52 karelerini ve ayrıca 9 karesini kullanır. Ayrıca, ın 9 karesi ve bu kareyle ilişkili kanallar ve yıldız modelleri için yöntemini içerir. Kullanıcı Kılavuzu ve Uygulama: Bu göstergeleri kullanmadan önce, kullanıcı kılavuzunu okumanız
Fiyat tersine döndükçe ve geri çekildikçe piyasa yapısından elde edilen kâr değişir. Piyasa yapısını tersine çevirme uyarısı göstergesi, bir trendin veya fiyat hareketinin ne zaman tükenmeye yaklaştığını ve tersine dönmeye hazır olduğunu tanımlar. Genellikle bir geri dönüş veya büyük bir geri çekilme meydana gelmek üzereyken meydana gelen piyasa yapısındaki değişiklikler konusunda sizi uyarır. Gösterge, olası bir tükenme noktasının yakınında her yeni yüksek veya düşük oluştuğunda, başlangıçta
Grafiğinizde otomatik olarak destek ve direnç seviyeleri PLUS itici mum boşlukları çizin, böylece fiyatın nereye gidebileceğini ve / veya potansiyel olarak tersine dönebileceğini görebilirsiniz. Bu gösterge, web sitemde (The Market Structure Trader) öğretilen pozisyon ticareti metodolojisinin bir parçası olarak kullanılmak üzere tasarlanmıştır ve hedefleme ve potansiyel girişler için temel bilgileri görüntüler. MT4 Version:  https://www.mql5.com/en/market/product/97246/ Göstergede 2 TEMEL öze
A key element in trading is zones or levels from which decisions to buy or sell a trading instrument are made. Despite attempts by major players to conceal their presence in the market, they inevitably leave traces. Our task was to learn how to identify these traces and interpret them correctly. Reversal First Impulse levels (RFI)   -  Version MT4                  INSTRUCTIONS                 RUS                 ENG                         R ecommended to use with an indicator   -  TREND PRO  
Tanıtım       Quantum Breakout PRO   , Breakout Bölgeleri ile ticaret yapma şeklinizi değiştiren çığır açan MQL5 Göstergesi! 13 yılı aşkın ticaret tecrübesine sahip deneyimli tüccarlardan oluşan bir ekip tarafından geliştirilmiştir.       Kuantum Breakout PRO       yenilikçi ve dinamik koparma bölgesi stratejisiyle ticaret yolculuğunuzu yeni zirvelere taşımak için tasarlanmıştır. Kuantum Breakout Göstergesi, size 5 kar hedefi bölgesi ile kırılma bölgelerinde sinyal okları ve kırılma kutusuna
The Volume by Price Indicator for MetaTrader 5 features Volume Profile and Market Profile TPO (Time Price Opportunity). Get valuable insights out of currencies, equities and commodities data. Gain an edge trading financial markets. Volume and TPO histogram bar and line charts. Volume Footprint charts. TPO letter and block marker charts including split structures. Versatile segmentation and compositing methods. Static, dynamic and flexible ranges with relative and/or absolute visualizations. Lay
Owl Smart Levels MT5
Sergey Ermolov
4.47 (36)
MT4 versiyonu  |  FAQ Owl Smart Levels Indicator , Bill Williams'ın gelişmiş fraktalları , piyasanın doğru dalga yapısını oluşturan Valable ZigZag ve kesin giriş seviyelerini gösteren Fibonacci seviyeleri gibi popüler piyasa analiz araçlarını içeren tek gösterge içinde eksiksiz bir ticaret sistemidir. pazara ve kar elde edilecek yerlere. Stratejinin ayrıntılı açıklaması Gösterge ile çalışma talimatı Baykuş Yardımcısı ticaretinde Danışman Yardımcısı Kullanıcıların özel sohbeti -> Satın aldıktan
TrendLine PRO MT5
Evgenii Aksenov
4.78 (49)
The Trend Line PRO indicator is an independent trading strategy. It shows the trend change, the entry point to the transaction, as well as automatically calculates three levels of Take Profit and Stop Loss protection Trend Line PRO is perfect for all Meta Trader symbols: currencies, metals, cryptocurrencies, stocks and indices Advantages of Trend Line PRO Never redraws its signals The possibility of using it as an independent strategy It has three automatic levels Take Profit and Stop Loss lev
Gartley Hunter Multi
Siarhei Vashchylka
5 (5)
Gartley Hunter Multi - An indicator for searching for harmonic patterns simultaneously on dozens of trading instruments and on all classic timeframes: (m1, m5, m15, m30, H1, H4, D1, Wk, Mn). Manual (Be sure to read before purchasing) | Version for MT4 Advantages 1. Patterns: Gartley, Butterfly, Shark, Crab. Bat, Alternate Bat, Deep Crab, Cypher 2. Simultaneous search for patterns on dozens of trading instruments and on all classic timeframes 3. Search for patterns of all possible sizes. Fr
Trend Line Map Pro MT5
STE S.S.COMPANY
4.67 (9)
Trend Line Map indicator is an addons for   Trend Screener Indicator . It's working as a scanner for all signals generated by Trend screener ( Trend Line Signals ) . It's a Trend Line Scanner based on Trend Screener Indicator.  If you don't have Trend Screener Pro Indicator,   the Trend Line Map Pro will not work.     LIMITED TIME OFFER : Trend Line Map Indicator is available for only 50 $ and lifetime. ( Original price 125$ ) By accessing to our MQL5 Blog,  you can find all our premium indica
TrendDecoder Premium MT5
Christophe, Pa Trouillas
5 (1)
Aralıkları ve bir sonraki olası hamleleri belirleyin     |    Trendlerin en erken sinyallerini ve gücünü alın     |    Geri dönüşten önce net çıkışlar alın     |    Fiyatın test edeceği Fibo seviyelerini tespit edin   |  Gecikmesiz, takip edilmeyen gösterge - manuel ve otomatik ticaret için ideal - tüm varlıklar ve tüm zaman birimleri için uygun 50 İNDİRİM   - lansman için sonra tekrar   >>   149 $ Satın aldıktan sonra, kişiselleştirilmiş ayarlar için   bu kanaldan benimle iletişime geçin . MT4
MetaBands M5
Vahidreza Heidar Gholami
4.67 (3)
MetaBands uses powerful and unique algorithms to draw channels and detect trends so that it can provide traders with potential points for entering and exiting trades. It’s a channel indicator plus a powerful trend indicator. It includes different types of channels which can be merged to create new channels simply by using the input parameters. MetaBands uses all types of alerts to notify users about market events. Features Supports most of the channel algorithms Powerful trend detection algorith
Was: $249  Now: $99   Market Profile defines a number of day types that can help the trader to determine market behaviour. A key feature is the Value Area, representing the range of price action where 70% of trading took place. Understanding the Value Area can give traders valuable insight into market direction and establish the higher odds trade. It is an excellent addition to any system you may be using. Inspired by Jim Dalton’s book “Mind Over Markets”, this indicator is designed to suit the
TPA True Price Action indicator reveals the true price action of the market makers through 100% non-repainting signals strictly at the close of a candle! TPA shows entries and re-entries, every time the bulls are definitely stronger than the bears and vice versa. Not to confuse with red/green candles. The shift of power gets confirmed at the earliest stage and is ONE exit strategy of several. There are available now two free parts of the TPA User Guide for our customers. The first "The Basics"
Yazarın diğer ürünleri
Heikin Ashi Heikin Ashi, gelecekteki fiyat hareketlerini tahmin etmek için kullanılabilecek bir grafik tekniğidir. Geleneksel mum grafiklerine benzer. Bununla birlikte, normal bir mum grafiği aksine, Heikin Ashi grafiği, piyasadaki trend hareketlerini daha iyi tanımlamak için güçlü fiyat dalgalanmalarını yumuşatarak piyasa gürültüsünün bir kısmını filtrelemeye çalışır. Heiken Ashi'yi oluşturmak için, fiyat verilerinin girildiği bir formül kullanılırken, sıradan mumlar herhangi bir hesaplama kull
MovingAveragePRO
Volkan Mustafaoglu
Çalışma prensiplerinizi alt üst edecek bir buluş. Özellikle yatay ve durgun piyasalarda can sıkıcı kayıplar yaşanabiliyor. Ayrıca trend çizgilerini, destek ve dirençleri takip etmek yorucu olabilir. Tüm bunlara son vermek için profesyonel bir "hareketli ortalama" göstergesi oluşturmaya karar verdim. Tek yapmanız gereken renkleri takip etmek. Ek desteğe ihtiyacınız varsa profilimdeki "Heiken-Ashi" mum göstergesini öneririm. bol kazançlar dilerim..
Supertrend, Ortalama Gerçek Aralık 'a (ATR)   dayanan trendi takip eden bir göstergedir. Tek çizgisinin hesaplanması, eğilim algılama ve volatiliteyi birleştirir. Trend yönündeki değişiklikleri tespit etmek ve durakları konumlandırmak için kullanılabilir. Temel bilgiler Supertrend trendi takip eden bir göstergedir. Ana grafikte yer kaplar ve çizimleri mevcut eğilimi gösterir. Bir Supertrend, değişen sürelerde (günlük, haftalık, gün içi vb.) ve değişen araçlarda (hisse senetleri, vadeli işlemle
Filtrele:
İnceleme yok
İncelemeye yanıt