• Genel bakış
  • İncelemeler
  • Yorumlar
  • Yenilikler

ON Trade VSA

Tanıtıyoruz: "ON Trade VSA" - Hacim ve Dağılım Analizi için Ultimate Araç!

Gücünü, hacim ve dağılım analizinin (VSA) öncü göstergesi "ON Trade VSA" ile keşfedin. VSA, piyasa gücünü değerlendirmek, trendleri tanımlamak ve bilinçli kararlar almak için trader'lar tarafından kullanılan güçlü bir metodolojidir. Şimdi "ON Trade VSA"yı, ticaret cephaneliğinizde vazgeçilmez bir araç haline getiren temel özelliklere göz atalım:

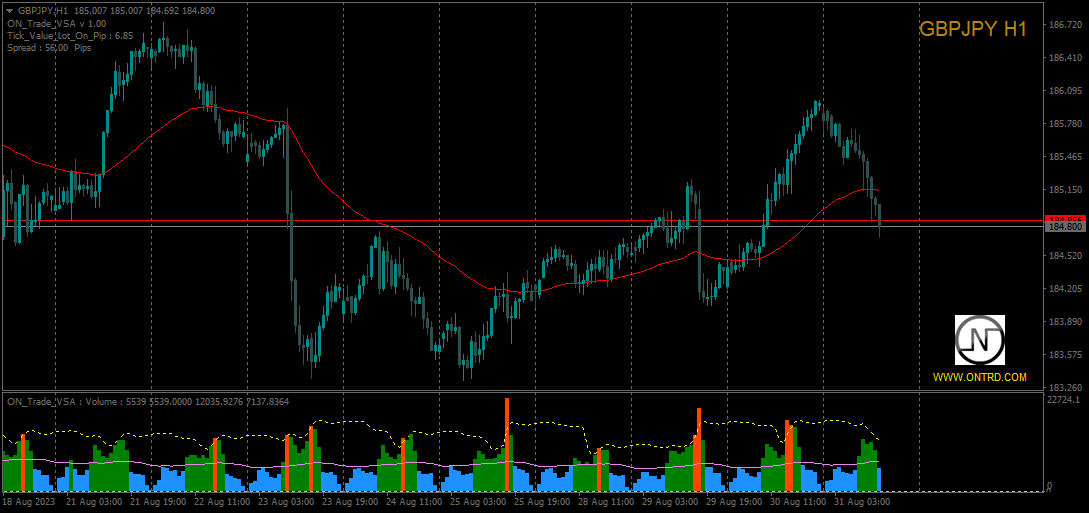
  1. Çok Renkli Hacim Mumları: Ortalama harekete dayalı olarak farklı renkler atayan benzersiz bir özellikle piyasa dinamiğine dair bir bakış açısı elde edin. Bu sezgisel görselleştirme, piyasa duyarlılığında yaşanan değişiklikleri hızla tespit etmenize yardımcı olur.

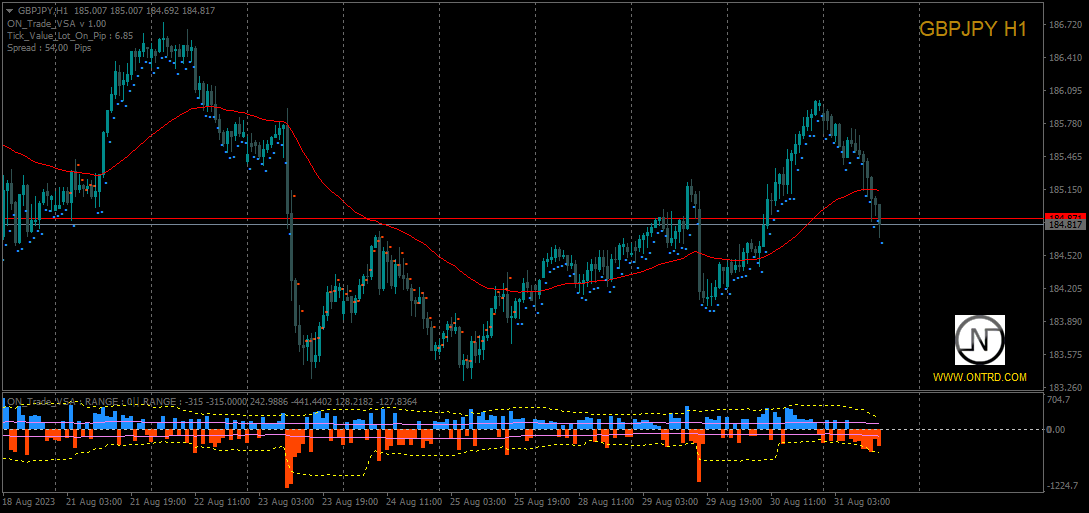
  2. Güçlü Trend Tespiti: Göstergemiz temeldeki unsurların ötesine geçer. Grafikteki en güçlü trendi kesin bir şekilde tanımlar ve çizer, böylece hakim piyasa yönünü net bir şekilde görmenizi sağlar.

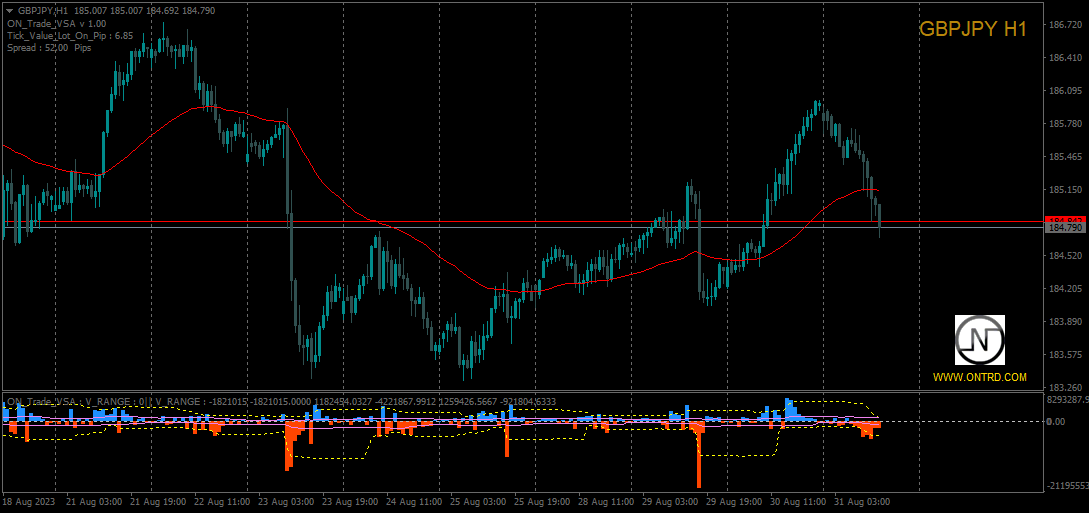
  3. Hacim-Aralık Çarpanı: Aralığa çarpılan hacimleri çizerek gizli desenleri ortaya çıkarın. Hacim ile fiyat aralığı arasındaki ilişkiyi analiz ederek, piyasa volatilitesini ve potansiyel kopuş noktalarını anlama konusunda donanımlı olursunuz.

  4. Volatilite Göstergeleri: Volatilite trend çizgilerimiz aracılığıyla piyasa volatilitesini görselleştirin. Bu çizgiler, piyasa dinamiklerini yorumlamanıza yardımcı olurken zamanında ticaret kararları almanıza destek olur.

  5. Eylem İçin Uyarılar: Gerçek zamanlı uyarılarla işlemlerinizin üzerinde kalın. "ON Trade VSA", önemli piyasa olayları meydana geldiğinde sizi bilgilendirir, böylece ticaret fırsatlarını asla kaçırmazsınız.

"ON Trade VSA" ile ticaret stratejinizi geliştirin ve VSA analizini en iyi şekilde deneyimleyin. Deneyimli bir trader veya yeni başlayan olun, göstergemiz, piyasanın karmaşıklıklarını yönlendirmede işe yarar bilgilerle sizi güçlendirir.

Daha fazla beklemeyin! Ticaret yolculuğunuzu hemen "ON Trade VSA" ile güçlendirin ve ticaret kararlarınızda avantaj elde edin. Daha akıllı ve daha emin bir şekilde ticaret yapmaya hazırlanın.


Önerilen ürünler
Power Renko is an indicator which plots Renko bricks underneath the chart using a histogram. You can select the brick size and the timeframe of the Renko bricks as well as whether or not to use the close price or the high/low price of the candles. Renko bricks are based on price alone, not time, therefor the Renko bricks will not be aligned with the chart's time. They are extremely useful for trend trading and many different strategies can be formed from them. Buffers are provided allowing you t
VR Cub
Vladimir Pastushak
VR Cub , yüksek kaliteli giriş noktaları elde etmenin bir göstergesidir. Gösterge, matematiksel hesaplamaları kolaylaştırmak ve bir pozisyona giriş noktalarının aranmasını basitleştirmek için geliştirildi. Göstergenin yazıldığı ticaret stratejisi uzun yıllardan beri etkinliğini kanıtlamaktadır. Ticaret stratejisinin basitliği, acemi yatırımcıların bile başarılı bir şekilde ticaret yapmasına olanak tanıyan büyük avantajıdır. VR Cub, pozisyon açılış noktalarını ve Kâr Al ve Zararı Durdur hedef sev
This is an arrow indicator without a future function,developed based on the most advanced profit trading algorithms.It has the most innovative and advanced dual trend analysis module, as well as the latest and highly effective market trend prediction algorithm.Trends are your friends, and following larger trends can earn the maximum profit in foreign exchange. This indicator helps traders identify current trends and track them. Someone once made a profit of 10 times in a week by relying on it.No
Trendiness Index
Libertas LLC
5 (3)
"The trend is your friend" is one of the best known sayings in investing, because capturing large trendy price movements can be extremely profitable. However, trading with the trend is often easier said than done, because many indicators are based on price reversals not trends. These aren't very effective at identifying trendy periods, or predicting whether trends will continue. We developed the Trendiness Index to help address this problem by indicating the strength and direction of price trend
Owl smart levels
Sergey Ermolov
4.63 (54)
MT5 versiyonu  |  FAQ Owl Smart Levels Indicator ,   Bill Williams'ın gelişmiş fraktalları , piyasanın doğru dalga yapısını oluşturan Valable ZigZag ve kesin giriş seviyelerini gösteren   Fibonacci seviyeleri   gibi popüler piyasa analiz araçlarını içeren tek gösterge içinde eksiksiz bir ticaret sistemidir. pazara ve kar elde edilecek yerlere. Stratejinin ayrıntılı açıklaması Gösterge ile çalışma talimatı Baykuş Yardımcısı ticaretinde Danışman Yardımcısı Kullanıcıların özel sohbeti -> Satın ald
Renko, Heiken Ashi, Ticks Bar, Range Bar.    Easy switching, easy setup, all in one window.        Place the Custom Chart indicator and view Renko, Heiken Ashi, Tick bar, Range bar charts in real time at real chart.    Position the offline chart window so that the indicator control panel is visible.    Switch the chart mode by click of a button.    Connect to the output chart any indicator, expert advisor without any restrictions.    No, it doesn't work in the tester.    Yes, you can use an
Infinity Trend Pro
Yaroslav Varankin
1 (1)
This is a trend indicator without redrawing Developed instead of the binary options strategy (by the color of the Martingale candlestick) Also works well in forex trading When to open trades (binary options) A signal will appear in the place with a candle signaling the current candle It is recommended to open a deal for one candle of the current timeframe M1 and M5 When a blue dot appears, open a deal up When a red dot appears, open a trade down. How to open trades on Forex. When a signal is rec
Atomic Analyst
Issam Kassas
5 (2)
Öncelikle belirtmek gerekir ki bu Ticaret Göstergesi Yeniden Çizim Yapmaz, Gecikmez ve Gecikme Göstermez, bu da hem manuel hem de robot ticareti için ideal hale getirir. Atom Analisti, Piyasada Daha İyi Bir Avantaj Bulmak İçin Fiyatın Gücünü ve Momentumunu Kullanan PA Fiyat Hareketi Göstergesidir. Gürültüleri ve Yanlış Sinyalleri Kaldırmaya ve Ticaret Potansiyelini Artırmaya Yardımcı Olan Gelişmiş Filtrelerle Donatılmıştır. Birden fazla katmanlı karmaşık göstergeler kullanarak, Atom Analisti
Trend PA
Mikhail Nazarenko
5 (3)
The Trend PA indicator uses   Price Action   and its own filtering algorithm to determine the trend. This approach helps to accurately determine entry points and the current trend on any timeframe. The indicator uses its own algorithm for analyzing price changes and Price Action. Which gives you the advantage of recognizing, without delay, a new nascent trend with fewer false positives. Trend filtering conditions can be selected in the settings individually for your trading style. The indicator
Noize Absorption Index MT4
Ekaterina Saltykova
5 (1)
Noize Absorption Index - is the manual trading system that measures the difference of pressure between bears forces and bulls forces. Green line - is a noize free index that showing curent situation. Zero value of index shows totally choppy/flat market.Values above zero level shows how powerfull bullish wave is and values below zero measures bearish forces.Up arrow appears on bearish market when it's ready to reverse, dn arrow appears on weak bullish market, as a result of reverse expectation. S
Bu, bir mumun kapanış fiyatını tahmin eden bir göstergedir. Gösterge öncelikle D1 çizelgelerinde kullanılmak üzere tasarlanmıştır. Bu gösterge hem geleneksel forex ticareti hem de ikili opsiyon ticareti için uygundur. Gösterge, bağımsız bir ticaret sistemi olarak kullanılabilir veya mevcut ticaret sisteminize ek olarak hareket edebilir. Bu gösterge, mevcut mumu analiz ederek mumun gövdesi içindeki belirli güç faktörlerini ve önceki mumun parametrelerini hesaplar. Böylece gösterge, piyasa hareket
The LineMagnit Indicator for MT4 is a highly precise tool that builds support and resistance levels which magnetically attract prices. This feature allows traders to easily determine the most probable entry and exit points in the market, as well as identify the market's directional forces, as levels are based on capital inflows into the instrument. Equipped with an intuitively understandable graphical interface, the LineMagnit Indicator enables users to quickly locate and analyze support and res
Insider Scalper Binary This tool is designed to trade binary options. for short temporary spends. to make a deal is worth the moment of receiving the signal and only 1 candle if it is m1 then only for a minute and so in accordance with the timeframe. for better results, you need to select well-volatile charts.... recommended currency pairs eur | usd, usd | jpy .... the indicator is already configured, you just have to add it to the chart and trade .... The indicator signals the next can
Gold Phoenix
Yaroslav Varankin
The perfect tool for Scalng in the Forex markets You can trade both from signal to signal and using take profit  The algorithm does not use Zigzag!  No redrawing!  This is a channel instrument that uses a moving average as a filter. Moving Average  There are 2 parameters for the settings Ma Period = 5 period Moving Average  Channel 1.0 distance of channel lines from the chart Price Signal Filter - calculation of signal opening and filter There is a complete set of Alert There is a multi-timefram
It will be the best tool for you to make a profit! Through unique algorithms You're going to see an amazing amount of right trading signals Make huge profits every day and realize more possibilities!   Like the car no money to buy it, the love of the girls dare not to pursue?Or the credit card bill is not paid, the rent does not have the extra money to settle?Or are you fed up with being bossed around by your boss and Hope to get more people's respect?Can't afford to buy the things you want ? wa
Rira Renko
Vitor Palmeira Abbehusen
RENKO on Time Chart This indicator is an enhanced Renko, so you can watch the Renko bricks on the chart to understand price movement more clearly the other improvement is automated box size according to ATR (Average True Range) period you can set the ATR number as you want and the box size of Renko changes automatically based on price movement Inputs Mode: Box size is the input to specify the size of the Renko box you want to print on the chart. This input lets you choose the fixed b
Trend Ray
Andriy Sydoruk
The indicator shows the potential trend direction by cyclical-wave dependence. Thus, all the rays of the intersection will be optimal rays, in the direction of which the price is expected to move, taking into account the indicator period. Rays can be used as a direction for potential market movement. But we must not forget that the approach must be comprehensive, the indicator signals require additional information to enter the market.
Alpha Trend
Evgeny Belyaev
3.33 (3)
Alpha Trend is a trend indicator for the MetaTrader 4 platform; it has been developed by a group of professional traders. The Alpha Trend indicator finds the most probable tendency reversal points, which allows making trades at the very beginning of a trend. This indicator features notifications, which are generated whenever a new signal appears (alert, email, push-notification). This allows you to open a position in a timely manner. Alpha Trend does not redraw, which makes it possible to evalua
The indicator displays the data of the Stochastic oscillator from a higher timeframe on the chart. The main and signal lines are displayed in a separate window. The stepped response is not smoothed. The indicator is useful for practicing "manual" forex trading strategies, which use the data from several screens with different timeframes of a single symbol. The indicator uses the settings that are identical to the standard ones, and a drop-down list for selecting the timeframe. Indicator Parame
Advanced Trend Regime
Shellard Securities (Pty) Ltd
The indicator has been designed to function on any time-frame and any pair.   This regime filter will help the trader better evaluate whether the current market is trending, and in which direction. It quickly reacts to changes in market dynamics using a series of advanced calculations. The user is able to select whether the calculation remains standard, or if a further filter constraint is added to the calculation.   A Yellow moving average of the signal has been included for the trader to smoot
The Stepping Trend Indicator     The Steppi ng Trend indicator uses the  average true range  (ATR indicator) in its calculation. This gives you control to set your own average true range period, I set the Default as 10.   Indicator Details. Green Arrow Up: This means you are at the starting point of a new bullish trend, it’s time to buy.   Red  Arrow  Down : This means you are at the starting point of a new  bearish  trend, it’ s time to sell .   What if you miss the Arrow Signal?   No
Based on MACD indicator waves with standard parameters Applies Fibonacci levels to the last two MACD waves, positive and negative respectively, if at the moment the MACD indicator runs out of negative Wave - the color is green, if at the moment the MACD indicator runs out of positive Wave - the color is red. The Wave termination criterion is two ticks with a different MACD sign. Applies trend lines on the last four MACD Waves. Works well with the expert Figures MACD   https://www.mql5.com/ru/mar
5 signal in 1  Product     TimeFrame   Recommend   1m-5m recommend  signal   TF  5m    Banks Pro Binary Option is Indicator for binary option Can Use Manaul Trade or Robot on Platform  Mt2Trading  https://www.mt2trading.com/?ref=104    Time Trading   good work  EU session    Recommend  Curency   EUR  GBP USD        careful   AUD JPY      Recommend  Martingale 2-5 Step   Recommend  set profit  2%-5%/Day Setting Brake  News Event High volatility   recommend  15-30 min Have Problem Contract
Shark Deal Book
Philip Pankaj Suthagar
4 (3)
Term  "shark"  in the business world denotes a high volume investor who just made a good investment in a highly Potential business deal.So, sharks are the ones who make the market move. In our case, if an American shark bought a Japanese company, he/she has to convert American dollars into Japanese yen to make the deal. So, the demand for the Japanese yen will increase sharply. Thus USD/JPY will go short rapidly if the deal was from the shark. Another example, In the case of forex, if fed increa
COG LR Osc AM
Andriy Matviyevs'kyy
The presented indicator allows you to determine potential entry points into the market and set protective orders at reasonable levels. This product can be useful for both beginners and experienced traders. The indicator is based on calculation methods proven by time and practicing traders. The indicator is calculated in two stages: At the first stage, linear regression (LR) of the selected price type is determined for a given number of chart periods. At the second stage, the obtained data is p
Blahtech Market Profile
Blahtech Limited
4.61 (18)
Was: $249  Now: $99   Market Profile defines a number of day types that can help the trader to determine market behaviour. A key feature is the Value Area, representing the range of price action where 70% of trading took place. Understanding the Value Area can give traders valuable insight into market direction and establish the higher odds trade. It is an excellent addition to any system you may be using. Blahtech Limited presents their Market Profile indicator for the MetaTrader community. Ins
Heiken Ashi candle chart is an improved version of The Japanese candle chart, which can effectively filter the market "noise" of the Japanese candle chart. It is favored by many traders for its simplicity and intuition. For trend traders, the HA candle chart is a magic tool. Unlike the traditional Japanese candle chart, Heikenashi does not reflect the opening price, high price, low price and closing price of the market. Instead, Heikenashi calculates the value of a single K line in the dominant
Binary Options Support Resistance Indicator This indicator is designed for binary options trading and effectively shows retracements from support and resistance levels. Signals appear on the current candle. A red arrow pointing downwards indicates a potential selling opportunity, while a blue arrow pointing upwards suggests buying opportunities. All that needs adjustment is the color of the signal arrows. It is recommended to use it on the M1-M5 timeframes as signals are frequent on these timef
Fibonacci retracement and extension line drawing tool Fibonacci retracement and extended line drawing tool for MT4 platform is suitable for traders who use  golden section trading Advantages: There is no extra line, no too long line, and it is easy to observe and find trading opportunities Trial version: https://www.mql5.com/zh/market/product/35884 Main functions: 1. Multiple groups of Fibonacci turns can be drawn directly, and the relationship between important turning points
PipFinite Trend PRO
Karlo Wilson Vendiola
4.9 (2775)
Breakthrough Solution For Trend Trading And Filtering With All Important Features Built Inside One Tool! Trend PRO's smart algorithm detects the trend, filters out market noise and gives entry signals with exit levels. The new features with enhanced rules for statistical calculation improved the overall performance of this indicator. Important Information Revealed Maximize the potential of Trend Pro, please visit www.mql5.com/en/blogs/post/713938 The Powerful Expert Advisor Version Automa
Bu ürünün alıcıları ayrıca şunları da satın alıyor
TPSproTREND PrO
Roman Podpora
5 (15)
TPSpro TRENDPRO  - is a trend indicator that automatically analyzes the market and provides information about the trend and each of its changes, as well as giving signals for entering trades without redrawing! The indicator uses each candle, analyzing them separately. referring to different impulses - up or down impulse. Exact entry points into transactions for currencies, crypto, metals, stocks, indices!  -  Version MT5               DETAILED DESCRIPTION        /       TRADING SETUPS           
ŞU ANDA %26 INDIRIMLI Yeni Başlayanlar veya Uzman Tüccarlar için En İyi Çözüm! Bu Gösterge benzersiz, yüksek kaliteli ve uygun fiyatlı bir ticaret aracıdır çünkü bir dizi tescilli özellik ve yeni bir formül ekledik. Sadece BİR grafik ile 28 Forex çifti için Döviz Gücünü okuyabilirsiniz! Yeni bir trendin veya scalping fırsatının tam tetik noktasını belirleyebildiğiniz için ticaretinizin nasıl gelişeceğini hayal edin? Kullanım kılavuzu: buraya tıklayın Bu ilk olan, orijinal! Değersiz bir
Şu anda %20 İNDİRİMLİ! Herhangi bir Acemi veya Uzman Tüccar için En İyi Çözüm! Bu gösterge paneli yazılımı 28 döviz çifti üzerinde çalışıyor. Ana göstergelerimizden 2'sine (Gelişmiş Para Birimi Gücü 28 ve Gelişmiş Para Birimi Dürtüsü) dayanmaktadır. Tüm Forex piyasasına harika bir genel bakış sağlar. Gelişmiş Para Birimi Gücü değerlerini, para birimi hareket hızını ve tüm (9) zaman dilimlerinde 28 Forex çifti için sinyalleri gösterir. Trendleri ve / veya scalping fırsatlarını belirlemek içi
Scalper Inside PRO
Alexey Minkov
4.75 (55)
SALE NOW! Limited Time Offer! An exclusive indicator that utilizes an innovative algorithm to swiftly and accurately determine the market trend. The indicator automatically calculates opening, closing, and profit levels, providing detailed trading statistics. With these features, you can choose the most appropriate trading instrument for the current market conditions. Additionally, you can easily integrate your own arrow indicators into Scalper Inside Pro to quickly evaluate their statistics and
TPSpro RFI Levels
Roman Podpora
5 (13)
A key element in trading is zones or levels from which decisions to buy or sell a trading instrument are made. Despite attempts by major players to conceal their presence in the market, they inevitably leave traces. Our task was to learn how to identify these traces and interpret them correctly. Reversal First Impulse levels (RFI)   -  Version MT5                INSTRUCTIONS                 RUS                 ENG                                       R ecommended to use with an indicator   -  
Tanıtım       Kuantum Trend Keskin Nişancı Göstergesi   , trend tersine dönmeleri belirleme ve ticaret yapma şeklinizi değiştiren çığır açan MQL5 Göstergesi! 13 yılı aşkın ticaret tecrübesine sahip deneyimli tüccarlardan oluşan bir ekip tarafından geliştirilmiştir.       Kuantum Trend Keskin Nişancı Göstergesi       trend dönüşlerini son derece yüksek doğrulukla belirlemenin yenilikçi yolu ile ticaret yolculuğunuzu yeni zirvelere taşımak için tasarlanmıştır. ***Kuantum Trend Keskin Nişancı Gö
Quantum Breakout Indicator PRO
Bogdan Ion Puscasu
4.96 (26)
Tanıtım       Quantum Breakout PRO   , Breakout Bölgeleri ile ticaret yapma şeklinizi değiştiren çığır açan MQL5 Göstergesi! 13 yılı aşkın ticaret deneyimine sahip deneyimli tüccarlardan oluşan bir ekip tarafından geliştirilen   Quantum Breakout PRO   , yenilikçi ve dinamik koparma bölgesi stratejisiyle ticaret yolculuğunuzu yeni zirvelere taşımak için tasarlanmıştır. Kuantum Breakout Göstergesi, size 5 kar hedefi bölgesi ile kırılma bölgelerinde sinyal okları ve kırılma kutusuna dayalı ol
Advanced Supply Demand
Bernhard Schweigert
4.92 (310)
CURRENTLY 26% OFF !! Best Solution for any Newbie or Expert Trader! This indicator is a unique, high quality and affordable trading tool because we have incorporated a number of proprietary features and a new formula. With this update, you will be able to show double timeframe zones. You will not only be able to show a higher TF but to show both, the chart TF, PLUS the higher TF: SHOWING NESTED ZONES. All Supply Demand traders will love it. :) Important Information Revealed Maximize the potenti
Mucizevi Forex Göstergesi Tanıtımı: Keskin Ticaretin Gücünü Serbest Bırakın Tüm zaman dilimlerinde gerçekten olağanüstü sonuçlar sunan en iyi Forex göstergesini aramaktan sıkıldınız mı? Artık aramayın! Mucizevi Forex Göstergesi, ticaret deneyiminizi devrimleştirip kazançlarınızı yeni zirvelere taşımak için burada. Gelişmiş teknoloji ve yılların özenli geliştirmesi temelinde Mucizevi Forex Göstergesi, döviz piyasasında güç ve keskinlik açısından doruğa çıkar. Bu olağanüstü araç, tüm seviyelerdeki
Entry Points Pro
Yury Orlov
4.7 (225)
Yeniden boyamadan bir ticarete girmek için doğru sinyaller sağlayan MT5 için en iyi gösterge! Herhangi bir finansal varlığa uygulanabilir: forex, kripto para birimleri, metaller, hisse senetleri, endeksler. MT5 versiyonu burada Oldukça doğru alım satım sinyalleri sağlayacak ve bir alım satımı açıp kapatmanın en iyi zamanını size söyleyecektir. Göstergeyi ödeyen yalnızca bir sinyali işleme örneğiyle videoyu (6:22) izleyin! Çoğu tüccar, Giriş Noktaları Pro göstergesinin yardımıyla ilk işl
TrendMaestro
Stefano Frisetti
5 (2)
note: this indicator is for METATRADER4, if you want the version for METATRADER5 this is the link: TRENDMAESTRO recognizes a new TREND in the bud, he never makes mistakes. The certainty of identifying a new TREND is priceless. DESCRIPTION TRENDMAESTRO identifies a new TREND in the bud, this indicator examines the volatility, volumes and momentum to identify the moment in which there is an explosion of one or more of these data and therefore the moment in which prices have strong probability of f
FX Volume
Daniel Stein
4.6 (35)
Sabah Brifingimiz aracılığıyla ayrıntılar ve ekran görüntüleri ile günlük piyasa güncellemenizi alın burada mql5 ve on Telegram ! FX Volume, bir brokerin bakış açısından piyasa duyarlılığı hakkında GERÇEK bir fikir veren İLK ve TEK hacim göstergesidir. COT raporlarından çok daha hızlı bir şekilde, brokerlar gibi kurumsal piyasa katılımcılarının Forex piyasasında nasıl konumlandıklarına dair harika bilgiler sağlar. Bu bilgileri doğrudan grafiğinizde görmek, ticaretiniz için gerçek oyun değiştir
Price Action Entry Alerts
Stephen Sanjeeve Sahayam
5 (3)
Bu gösterge, alış veya satış baskısı için her çubuğu tarar ve en yüksek hacme sahip 4 tip mum modelini tanımlar. Bu mumlar daha sonra Alış veya Satış sinyallerini göstermek için birkaç doğrusal filtre kullanılarak filtrelenir. Sinyaller, daha yüksek zaman çerçevesi yönüyle bağlantılı olarak ve yüksek hacimli saatlerde alım satım yapıldığında en iyi sonucu verir. Tüm filtreler özelleştirilebilir ve bağımsız çalışır. Bir düğmeyi tıklayarak tek bir yönün sinyallerini görüntüleyebilir. Bu gösterge
How to use Pair Trading Station Pair Trading Station is recommended for H1 time frame and you can use it for any currency pairs. To generate buy and sell signal, follow few steps below to apply Pair Trading Station to your MetaTrader terminal. When you load Pair Trading Station on your chart, Pair Trading station will assess available historical data in your MetaTrader platforms for each currency pair. On your chart, the amount of historical data available will be displayed for each currency pai
FX Power MT4 NG
Daniel Stein
5 (8)
Sabah Brifingimiz burada mql5 ve on Telegram! FX Power MT4 NG , uzun zamandır çok popüler olan döviz gücü ölçerimiz FX Power'ın yeni neslidir. Peki bu yeni nesil güç ölçer ne sunuyor? Orijinal FX Power hakkında sevdiğiniz her şey PLUS GOLD/XAU güç analizi Daha da hassas hesaplama sonuçları Ayrı ayrı yapılandırılabilir analiz dönemleri Daha da iyi performans için özelleştirilebilir hesaplama limiti Özel çokluDaha fazlasını görmek isteyenler için örnek ayarlar Her grafikte en sevdiğiniz renkler i
Öncelikle, bu Trading Sisteminin Non-Repainting, Non-Redrawing ve Non-Lagging Gösterge olduğunu vurgulamak önemlidir, bu da profesyonel ticaret için ideal hale getirir. "Smart Support and Resistance Trading System", yeni ve deneyimli tüccarlar için özel olarak tasarlanmış gelişmiş bir göstergedir. Forex piyasasında tüccarları hassasiyet ve güvenle donatır. Bu kapsamlı sistem, 7'den fazla strateji, 10 gösterge ve günlük ticaret stratejisi, swing ticaret stratejisi, destek ve direnç stratejisi,
Cycle Sniper
Elmira Memish
4.4 (35)
NEW YEAR SALE PRICE FOR LIMITED TIME!!! Please contact us after your purchase and we will send you the complimentary indicators to complete the system Cycle Sniper is not a holy grail but when you use it in a system which is explained in the videos, you will feel the difference. If you are not willing to focus on the charts designed with Cycle Sniper and other free tools we provide, we recommend not buying this indicator. We recommend watching the videos about the indiactor and system before pu
Precision Index Osilatörü (Pi-Osc) - Precision Trading Systems'dan Roger Medcalf Sürüm 2, grafiklerinizde hızlı bir şekilde yüklenmek üzere dikkatle yeniden kodlandı ve deneyimi artırmak için bazı teknik geliştirmeler de içerdi. Pi-Osc, herkesin stoplarını almak için zorlanan pazarların gitmek zorunda kaldığı aşırı yorgunluk noktalarını bulmak için tasarlanmış doğru ticaret zamanlama sinyalleri sunmak amacıyla oluşturuldu. Bu ürün, aşırı noktaların nerede olduğunu bilmek gibi yaşlı bir so
TakePropips Donchian Trend Pro
Eric John Pajarillaga Aldana
4.82 (17)
TakePropips Donchian Trend Pro   (MT4), Donchian Kanalı'nı kullanarak trendin yönünü otomatik olarak tespit eden ve size ticarete giriş ve çıkış sinyalleri sağlayan güçlü ve etkili bir araçtır! Bu çok işlevli gösterge, bir trend tarayıcı, ticaret sinyalleri, istatistiksel panel, tarayıcı, ticaret oturumları ve uyarı geçmişi panosu içerir. Size ticaret sinyalleri sağlamak ve çizelgeleri analiz ederek saatlerce tasarruf etmenizi sağlamak için tasarlanmıştır! Kullanım kılavuzunu ve kurulum kılavuzu
GOLD Impulse with Alert
Bernhard Schweigert
4.56 (9)
Bu gösterge, 2 ürünümüz Advanced Currency IMPULSE with ALERT  +   Currency Strength Exotics  'in süper bir kombinasyonudur. Tüm zaman dilimleri için çalışır ve 8 ana para birimi artı bir Sembol için grafiksel olarak güç veya zayıflık dürtüsünü gösterir! Bu Gösterge, Altın, Egzotik Çiftler, Emtialar, Endeksler veya Vadeli İşlemler gibi herhangi bir sembol için para birimi gücü ivmesini göstermek için uzmanlaşmıştır. Türünün ilk örneğidir, Altın, Gümüş, Petrol, DAX, US30, MXN, TRY, CNH vb.
Precision Divergence Finder, Precision Trading Systems tarafından piyasa diplerini kesinlikle ve sıkça bulmak amacıyla tasarlandı. Teknik analizde, dipleri seçme sanatı genellikle zirveleri seçmekten çok daha kolaydır ve bu ürün tam olarak bu görev için tasarlandı. Boğa ayrıştırması tanımlandıktan sonra alım yapmadan önce trendin yukarı dönmesini beklemek mantıklıdır. Bir giriş yapmak için 10 veya 20 çubuk yüksekliği kullanabilir veya trend değişikliğini belirlemek için yükselen bir 15-30 har
Roger Medcalf tarafından geliştirilen PTS Divergence Finder Satış Göstergesi - Precision Trading Systems. Bu gösterge yalnızca Ayı - Satış İşaretleri vermektedir. Öncelikle, neden birçok yıl boyunca alım sinyali farklılaşma bulucu sağlarken satış farklılaşma göstergesi sağlamadığımı birçok kez sordular. Cevabım, satış farklılaşmalarının alım farklılaşmalarından daha güvenilir olmadığı yönündeydi, ki bu hala doğrudur. Bunu değiştirmek için bazı çözümler bulundu, ancak bunlar daha katı varsayılan
Up down v6T
Guner Koca
5 (1)
Thise indicator is up down v6  comes with tradingwiev version. purchased people, after installed on terminal ,contact me on mql5  to get BONUS  TradingView version. up-down indicator is no repaint and works all pairs and lower than weekly time frames charts. it is suitable also 1 m charts for all pairs. and hold long way to signal. dont gives too many signals. when red histogram cross trigger line that is up signal.and price probably will down when blue histogram cross trigger line that is dow
TPA True Price Action indicator reveals the true price action of the market makers through 100% non-repainting signals (except early signals mode) strictly at the close of a candle! TPA shows entries and re-entries, every time the bulls are definitely stronger than the bears and vice versa. Not to confuse with red/green candles. The shift of power gets confirmed at the earliest stage and is ONE exit strategy of several. There are available now two free parts of the TPA User Guide for our custo
Indicator : RealValueIndicator Description : RealValueIndicator is a powerful tool designed specifically for trading on the EURUSD pair. This indicator analyzes all EUR and USD pairs, calculates their real currency strength values, and displays them as a single realistic value to give you a head start on price. This indicator will tell you moves before they happen if you use it right. RealValueIndicator allows you to get a quick and accurate overview of the EURUSD currency pair tops and bottoms,
Reversal Sniper
Elmira Memish
5 (3)
Reversal Sniper is designed to find the extreme reversals of the price. Indicator collects data of Cycle Sniper Indicator. NOTE: REVERSAL SNIPER Indicator is made for Cycle Sniper Users as an additional tool.  However, it can be used by the traders who look for finding out strong reversal levels. Indicator works on all timeframes and all instruments. Reversal  Sniper  Checks: Harmonic Patterns RSI Zig Zag and Harmonic Swings Cycle Sniper Indicator's Buy / Sell Signals The complex algo i
XQ Indicator MetaTrader 4
Marzena Maria Szmit
3 (2)
Step into the realm of Forex trading with confidence and precision using XQ, a cutting-edge Forex indicator designed to elevate your trading game to unprecedented heights. Whether you're a seasoned trader or just stepping into the world of currency exchange,   XQ Forex Indicator   empowers you with the insights and signals needed to make informed trading decisions. The signal conditions are a combination of three indicators, and XQ Forex Indicator only display  medium and long-term trends . The
Quantum Heiken Ashi PRO MT4
Bogdan Ion Puscasu
4.43 (7)
Tanıtımı       Quantum Heiken Ashi PRO   çizelgeleri Pazar eğilimleri hakkında net bilgiler sağlamak için tasarlanan Heiken Ashi mumları, gürültüyü filtreleme ve yanlış sinyalleri ortadan kaldırma yetenekleriyle ünlüdür. Kafa karıştırıcı fiyat dalgalanmalarına veda edin ve daha sorunsuz, daha güvenilir bir grafik sunumuna merhaba deyin. Quantum Heiken Ashi PRO'yu gerçekten benzersiz kılan şey, geleneksel şamdan verilerini okunması kolay renkli çubuklara dönüştüren yenilikçi formülüdür. Kırmızı v
XPointer
Andrey Kozak
5 (3)
XPointer is a completely ready trading system. It shows the trader when to open and close a trade. It works on all currency pairs and all time frames. Very easy to use and does not require additional indicators for its operation. Even a beginner trader can start working with XPointer. But it will also be useful for professional traders to confirm the opening of orders. Features of the XPointer indicator It does not redraw its values. It works on all currency pairs and all time frames. It has a
Sizlere ON Trade Waves Patterns Harmonic Elliot Wolfe'u tanıtmaktan mutluluk duyarız. Bu, manuel ve otomatik yöntemleri kullanarak piyasada çeşitli desenleri tespit etmek için tasarlanmış gelişmiş bir göstergedir. İşte nasıl çalıştığı: Harmonik Desenler: Bu gösterge, grafiğinizde görünen harmonik desenleri tanımlayabilir. Bu desenler, Scott Carney'in "Harmonic Trading vol 1 & 2" adlı kitabında açıklandığı gibi harmonik ticaret teorisini uygulayan tüccarlar için önemlidir. Onları manuel olarak ç
Yazarın diğer ürünleri
Gann Kare Göstergesi, W.D. Gann tarafından yazılan "Piyasa Tahminleri için Matematiksel Formül" makalesine dayalı güçlü bir piyasa analizi aracıdır. Bu araç, piyasa analizi için matematiksel ve Gann teorilerini kullanarak hassas analizler gerçekleştirir. 144, 90, 52 karelerini ve ayrıca 9 karesini kullanır. Ayrıca, ın 9 karesi ve bu kareyle ilişkili kanallar ve yıldız modelleri için yöntemini içerir. Kullanıcı Kılavuzu ve Uygulama: Bu göstergeleri kullanmadan önce, kullanıcı kılavuzunu okumanız
Bu gösterge, Elliott dalga teorisi ile iki şekilde çalışır: Otomatik Çalışma: Bu modda gösterge, Elliott dalga teorisine uygun olarak grafikteki beş hareket dalgasını otomatik olarak tespit edecek ve tahminlerde bulunacak, potansiyel ters dönüş bölgelerini belirleyecektir. Ayrıca, önemli gelişmeler hakkında tüccarları uyarılar ve bildirimlerle bilgilendirebilme yeteneğine sahiptir. Bu otomatik işlev, Elliott dalga desenlerinin tanımlanması ve analiz sürecini basit hale getirir. Manuel Çalışma: B
Shepherd Harmonic Pattern
Abdullah Alrai
4.68 (59)
Bu gösterge, manuel ve otomatik yöntemlerle çizilen harmonik desenleri algılar. Kullanım kılavuzuna şu bağlantıdan erişebilirsiniz: İncelemenizi ekleyin ve ürünü almak için bizimle iletişime geçin. Bu ürünü mt4'te denemek için ücretsiz bir sürümü vardır. Gartley ve Nenstar desenlerini algılamak için kullanabilirsiniz: https://www.mql5.com/en/market/product/30181 Tam MT4 sürümünü şuradan satın alabilirsiniz: https://www.mql5.com/en/market/product/15212 Notlar Gösterge kontrol paneline sahiptir ve
MT4 için Astronomi Göstergesini Tanıtıyoruz: En İleri Göksel Ticaret Arkadaşınız Ticaret deneyiminizi göksel seviyelere yükseltmeye hazır mısınız? MT4 için devrim niteliğindeki Astronomi Göstergemizi arayın. Bu yenilikçi araç karmaşık algoritmaları kullanarak eşsiz astronomik içgörüler ve hassas hesaplamalar sunmak için geleneksel ticaret göstergelerini aşmaktadır. Bilgi Evreni Parmaklarınızın Ucunda: Göksel verilerin hazinelerini açığa çıkaran kapsamlı bir paneli gözlemleyin. Gezegenlerin geo/h
Bu gösterge, W.D. Gann'ın dokuzun karesi ve 144'ün karesine bağlı olarak yazdığı "Piyasa tahminleri için matematiksel formül" makalesine dayanan bir piyasa analiz yöntemidir. Kullanım kılavuzu: Add Your review And contact us to get it Tam MT4 Sürümünü Şunlardan Satın Alabilirsiniz: https://www.mql5.com/en/market/product/15316 MT4'te ücretsiz olarak test edebilirsiniz: https://www.mql5.com/en/market/product/15320?source=Site +Profile+Seller#!tab=reviews Bu ürün sizin için Düz
Conclusioni: L'Indicatore ON Trade Numerology Mirror introduce una nuova prospettiva nell'analisi delle inversioni di prezzo integrando la saggezza antica della numerologia. Decifrando i modelli invertiti delle sequenze di numeri, ottieni una prospettiva unica sulle possibili inversioni di prezzo. Poiché il successo nel trading dipende da molti fattori, considera questo indicatore come parte integrante della tua strategia di trading globale. [Avviso: Il trading comporta rischi, e l'indicatore d
This indicator will detect harmonic patterns that are drawn on the chart by manual and automatic methods. You can see user manual from this link: https://www.mql5.com/en/blogs/post/719257 There is a free version (it detect only Gartley and Nenstar Patterns) to try this product. You can buy the full MT4 version from: https://www.mql5.com/en/market/product/104689 Notes When you use this indicator and change the settings, add indicators like Moving Average or Bollinger Bands, this indicator will
FREE
Bu gösterge, W.D. Gann'ın dokuzun karesi ve 144'ün karesine bağlı olarak yazdığı "Piyasa tahminleri için matematiksel formül" makalesine dayanan bir piyasa analiz yöntemidir. Kullanım kılavuzu: Add Your review And contact us to get it Tam MT5 Sürümünü Şunlardan Satın Alabilirsiniz: https://www.mql5.com/en/market/product/28669 MT4'te ücretsiz olarak test edebilirsiniz: https://www.mql5.com/en/market/product/15316 Bu ürün sizin için Düzeyler / Yıldız / Izgara / Gann hayranları
FREE
Gann Kare Göstergesi, W.D. Gann tarafından yazılan "Piyasa Tahminleri için Matematiksel Formül" makalesine dayalı güçlü bir piyasa analizi aracıdır. Bu araç, piyasa analizi için matematiksel ve Gann teorilerini kullanarak hassas analizler gerçekleştirir. 144, 90, 52 karelerini ve ayrıca 9 karesini kullanır. Ayrıca, 'ın 9 karesi ve bu kareyle ilişkili kanallar ve yıldız modelleri için yöntemini içerir. Kullanıcı Kılavuzu ve Uygulama: Bu göstergeleri kullanmadan önce, kullanıcı kılavuzunu okumanız
Shepherd Numeroloji Seviye Göstergesi ile ticarette devrim yaratan bir yaklaşımı keşfedin. Bu yenilikçi araç, geleneksel ticaret tekniklerini antik numeroloji bilgisiyle birleştirerek grafiklerinizdeki önemli destek ve direnç seviyelerini belirlemenize yardımcı olur. Dokuzun karesi yöntemini kullanarak bu gösterge, piyasa mekanizmalarına farklı bir bakış açısı sunar ve daha bilinçli ticaret kararları almanıza olanak tanır. Ana Özellikler ve Avantajlar: Numeroloji ve Dokuzun Karesi: Shepherd Nume
Bu gösterge, ticaret grafiğinizde Donchian kanalını görsel olarak temsil etme amacını taşır. Donchian kanalı, belirli bir dönemde en yüksek yüksek ve en düşük düşük arasındaki aralığı gösteren basit bir teknik araçtır. Bu gösterge, fiyat hareketlerinin görsel analizini geliştirerek potansiyel kırılma ve trend devam noktalarına dair anlayış sunar. Donchian kanalı, bu seçeneği etkinleştirmeyi tercih ederseniz hem geçerli zaman dilimine hem de daha yüksek bir zaman dilimine uygulanabilir. Gösterge
FREE
Introducing the Pivot Point Selector Indicator: Your Ultimate Tool for Custom Pivot Levels Are you ready to take your trading to the next level? Say hello to the Pivot Point Selector Indicator, a game-changing tool that puts you in control of your pivot levels. This innovative indicator empowers you to choose three specific points that will determine the pivot level calculations, giving you unparalleled customization and precision in your trading strategy. Key Features and Benefits: Custom Pivo
FREE
Maravilla Square Göstergesi Tanıtımı: Öngörülü İşlem İçin Yardımcınız Maravilla Square göstergesini keşfedin: Öngörülü işlem için anahtarınız. Bu eşsiz araç, fiyat tersine dönmeleri hakkında içgörü sunar ve yüksek ve düşük noktalar arasında ayarlanabilir bir eğilim çizgisi sunar. Trend Çizgisi Dinamiği: Maravilla Square göstergesi, grafiğin yüksek ve düşük noktalarına uyum sağlayabileceğiniz bir trend çizgisi sunar. Bu dinamik özellik, gösterge ile fiyat hareketleri arasında doğrudan bir bağlan
FREE
ON Trade Marubozu Mum Modeli Göstergesi Marubozu mum modeli, piyasa duyarlılığını ve potansiyel trend dönüşlerini değerli bilgilerle sunabilen güçlü ve açık bir mum modelidir. Bu model, uçlarından birinde çok küçük veya hiç gölge (fitil) bulunmayan ve baskın trendin yönünde uzanan uzun bir gövdeye sahip bir mumla karakterizedir. Bu model, alıcılar ve satıcılar arasında güçlü bir dengesizliği temsil eder ve piyasada momentumun güçlü bir şekilde tek taraflı olduğunu gösterir. Özellikler ve Faydala
FREE
This indicator offers a comprehensive and efficient solution for traders seeking optimal entries in scalping strategies. Leveraging moving averages and stochastic indicators, it employs a systematic approach to identify favorable trade opportunities. The indicator goes beyond mere analysis, actively drawing clear and actionable entry points on your chart, denoted by arrows. Moreover, it provides the convenience of alerts to ensure you never miss these potential setups. Key Features and Benefits:
FREE
ON Trade Pivots is A technical indicator that Draws all Pivot levels depending on time frame that defined in settings. Notes It will be good tool for all traders who use pivot levels in their trades. Let me inform you that this indicator draw this level as buffers not as objects then you can connect it easily to EA. This indicator allow you to find pivots levels for any time frame not only daily you are free to choose time frame from settings. Parameters Use_System_Visuals - Enable /Disable
FREE
Altın Gram Fiyatı Hesaplayıcı Gösterge Tanıtımı Yerel para biriminizdeki altın fiyatını sürekli olarak takip etmek istiyor musunuz? Daha fazla aramayın, Altın Gram Fiyatı Hesaplayıcı Gösterge, tercih ettiğiniz yerel para biriminde gerçek zamanlı olarak gram başına altın fiyatını hesaplamanıza olanak sağlayan yenilikçi bir araç sunar. Bu gösterge ile finansal bilgileri kullanarak bilinçli kararlar alabilirsiniz. Ana Özellikler: Yerelleştirilmiş Altın Fiyatı: Altın Gram Fiyatı Hesaplayıcı Gösterge
FREE
"Bu gösterge basit bir eğilim tespit aracıdır. Skalping modu gibi iyi girişlere sahip olmak için stratejinizle birlikte kullanabilirsiniz. Fiyatın etrafında bir kanal çizecektir ve zaman arttıkça genişleyecektir; özel dönemlerde algoritma çalışma süresi ve fiyatı bir araya getirerek artış noktasının başlangıcına dönecektir. Ters dönüş işaretleri göründükten sonra kanalın en düşük sınırından satın alabilirsiniz. Ve ters dönüş işaretlerini gördükten sonra en yüksek kanal sınırından satabilirsiniz
Rsi Channel
Abdullah Alrai
5 (1)
This indicator displays the channel of Relative Strength Index. When you see that the price touches the red line and retreats from it many times, then you will know that the general trend is down. When it retreats from the blue line many times, that means that the general trend is up. This lines express the RSI values attributed to the price values on the main chart. You can add this indicator to your strategy, it will help you. This indicator will work best on 5 minutes and higher time frames.
Bu araç sayesinde grafiklerinizde regresyon kanalını kontrol etme yeteneği elde edersiniz. Kanal seviyelerini, destek ve direnç seviyelerini sağlayacaktır. Ayrıca düzeltme dalgası seviyelerini sunar. Ayrıca, dolum ve ışın seçenekleri gibi kanalı doğrudan kontrol etme imkanını sağlayan bir kontrol paneli üzerinden kanalı yönetebilirsiniz. Ayrıca, farklı çiftlerle işlem yaparken daha iyi bir görünüm elde etmek için daha yüksek zaman dilimlerinden veri yükleyebilirsiniz. Nasıl Kullanılır: Trend Çiz
Güçlü Forex göstergemizi sizlere sunuyoruz. Bu gösterge, ticaret stratejinizi geliştirmeniz ve size piyasa trendleri hakkında kesin bilgiler sağlamanız için tasarlanmıştır. Bu yenilikçi araç, mum ölçümlerini ayrıntılı bir şekilde analiz eden ve en iyi hassasiyeti elde etmek için ayarlamalar yapan sofistike bir özel algoritma kullanır. Sonuç? Grafiğinizde stratejik giriş noktalarını gösteren dikkatlice çizilmiş bir ok takımı. Bu göstergenin arkasındaki dahilik, mum desenlerinin gücünden faydalanm
Shepherd Gann Squares
Abdullah Alrai
4.9 (10)
Bu gösterge, W.D. Gann'ın dokuzun karesi ve 144'ün karesine bağlı olarak yazdığı "Piyasa tahminleri için matematiksel formül" makalesine dayanan bir piyasa analiz yöntemidir. Kullanım kılavuzu: Add Your review And contact us to get it Tam MT5 Sürümünü Şunlardan Satın Alabilirsiniz: https://www.mql5.com/en/market/product/28669 MT4'te ücretsiz olarak test edebilirsiniz: https://www.mql5.com/en/market/product/15320?source=Site +Profile+Seller#!tab=reviews Bu ürün sizin için
Bu gösterge, Gann teorisinden türetilmiş özel bir desen olan elmas Gann dalgalarını tespit etmek ve görselleştirmek için tasarlanmıştır. Desenin ABC noktalarına dayanarak noktaları (P) çizerek traderlere potansiyel piyasa dönüşleri hakkında görüşler sunar. Ayrıca, gösterge tahmin edilen noktalardan (P) dikey çizgiler çizerek traderlerin potansiyel dönüş noktalarını daha kolay tanımasına yardımcı olur. Gösterge Özellikleri: Use_System_Visuals: Bu parametre, göstergenin görünümü için sistem teması
"Bu gösterge, Bystra deseni teorisine dayalı olarak girişleri tespit eder ve hedef ve durma seviyeleri ile sınırlı emirleri yerleştirmek için giriş değerlerini sağlar. Bu, risk yüzdesini hesaplamanıza olanak tanır. Notlar: Bu gösterge, Uzman Danışmanlar (EA) içinde kullanım için tamponlara sahiptir. Bu ürünle çalışırken iyi bir para yönetimi uygulamanız önemlidir. Zaman diliminizi değiştirdiğinizde, Gösterge, son oturumunuzda kullanılan şablonu kaydedecektir. Bu yöntemi öğrenmek için bir kitaba
"Fibo Star" göstergesi, Fibonacci Fanlarını yıldız şeklinde grafik üzerine çizmek için tasarlanmıştır. Bu Fibonacci Fanları, fiyat hareketlerini analiz etmek için güçlü bir araçtır ve potansiyel destek ve direnç seviyeleri hakkında görüşler sunabilir. Bu gösterge, çizim ve yapılandırma sürecini kolaylaştırmayı amaçlayan kullanıcı dostu bir kontrol paneli ile donatılmıştır, böylece zaman ve çaba tasarrufu sağlar. Kullanım Talimatları: Bu gösterge manuel kullanım içindir. Etkili bir şekilde kullan
"Para Birimi Gücü" göstergesi, forex piyasasındaki farklı para birimlerinin göreceli gücünü sağlamak amacıyla tasarlanmış güçlü bir araçtır. Her bir para biriminin belirtilen zaman dilimine göre gücünü hesaplayarak ve temsil ederek, bu gösterge, trader'lara potansiyel işlem fırsatlarını tanımlama imkanı sunar, özellikle belirgin ayrışmalar veya kesişmeler gözlendiğinde. Gösterge Ana Özellikleri: 1. Para Birimi Gücü Hesaplama: Gösterge, her bir para biriminin belirtilen zaman dilimine göre gücünü
Bu gösterge, manuel ve otomatik yöntemlerle çizilen harmonik desenleri tespit edecektir. Lütfen görüşlerinizi ekleyin. Notlar: Bu gösterge bir kontrol paneline sahiptir ve her (grafik ve zaman dilimi) ayarını kaydedecektir. Daha fazla grafik alanı için onu küçültebilir ve diğer analiz araçlarıyla çalışmayı tercih ederseniz tüm gösterge verilerini gizlemek için kapatma düğmesini kullanabilirsiniz. Bu göstergenin ayarlarını değiştirirken Hareketli Ortalama veya Bollinger Bantları gibi göstergeler
Hikkake Japon Şamdan Deseni, grafikte oluşan Hikkake Fiyat Hareket Desenlerini belirlemek ve tespit etmek üzere tasarlanmış özel bir göstergedir. Bu desenler, genellikle potansiyel ticaret fırsatlarına yol açan bir iç çubukta sahte bir dışarı çıkma kavramına dayanır. Göstergenin temel işlevi, grafiğin son beş şamdanını analiz etmek ve bu şamdanların Hikkake deseninin özelliklerini sergileyip sergilemediğini belirlemektir. Bu desen onaylandığında, gösterge deseni oluşturan şamdanların etrafına bi
Güçlü Fiyat Hareketi Desenlerini Algılayan Teknik Gösterge: Pin Bar, Inside Bar ve Outside Bar Giriş: Teknik analizin alanında, fiyat hareketi desenleri potansiyel piyasa hareketlerinin önemli göstergeleri olarak işlev görür. Grafiklerde sağlam fiyat hareketi desenlerini tanımlamanın kolaylaştırıldığı sofistike bir teknik gösterge geliştirdik. Göstergemiz, üç temel deseni tanıma konusunda uzmanlaşmıştır: Pin Bar, Inside Bar ve Outside Bar. Ana Desenlerin Algılanması: Pin Bar: Pin Bar deseni, piy
MetaTrader için Numeroloji Temelli Destek ve Direnç Göstergesi Giriş: MetaTrader için geliştirdiğimiz Numeroloji Temelli Destek ve Direnç Göstergesi ile teknik analizde yeni bir boyut keşfedin. Bu benzersiz araç, numerolojinin gücünü kullanarak grafiklerinizdeki ana destek ve direnç seviyelerini belirlemek suretiyle potansiyel fiyat hareketleri hakkında değerli görüşler sunar. Ana Konseptler: Tradingde Numeroloji: Numeroloji, sayıların ve anlamlarının mistik olarak incelenmesidir. Numeroloji ilk
Filtrele:
İnceleme yok
İncelemeye yanıt
Sürüm 1.1 2023.10.21
- improvements