KT Donchian Channel Robot MT5
- Uzman Danışmanlar
- KEENBASE SOFTWARE SOLUTIONS
- Sürüm: 1.0
- Etkinleştirmeler: 5
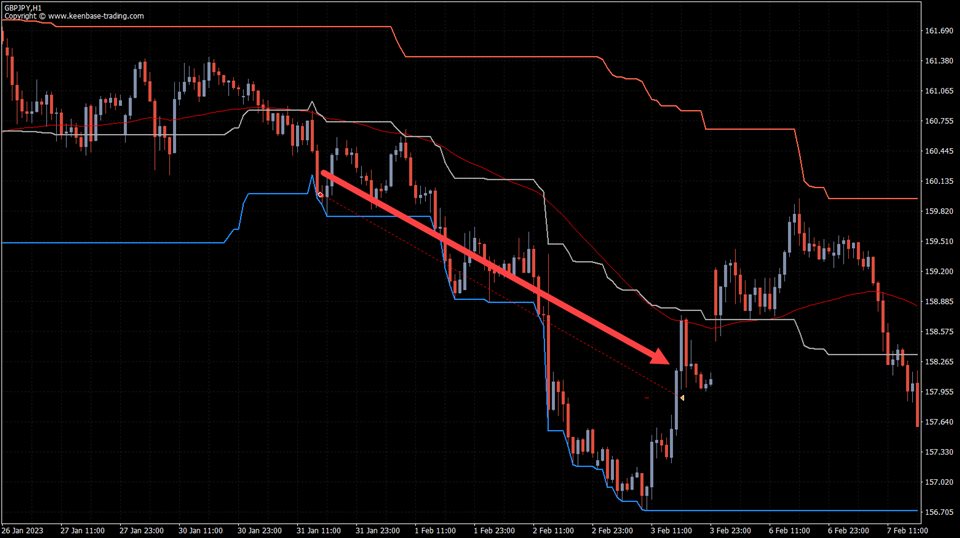
KT Donchian Channel Robot employs a powerful strategy that combines the breakout of the Donchian Channel with the EMA's rising or falling direction while incorporating a volatility measurement using ATR.
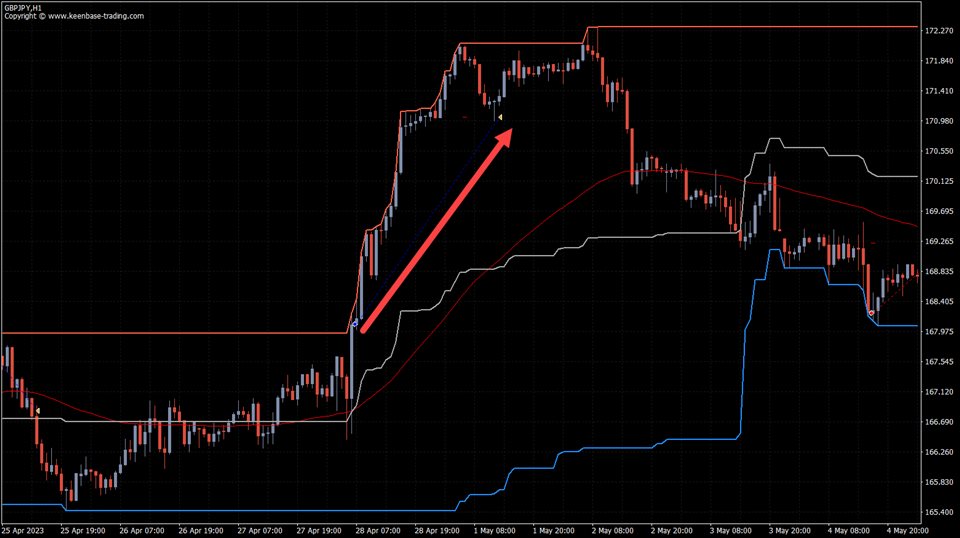
- Buy Entry: Upper Donchian Channel Break + EMA is rising + Volatility is increasing.
- Sell Entry: Bottom Donchian Channel Break + EMA is falling + Volatility is decreasing.
Features
- Not sensitive to broker conditions, the EA works equally well on all accounts.
- All trades are protected by stop-loss and take-profit.
- Dangerous techniques like martingale, grid, averaging, etc., are not used.
- Minimal and straightforward input parameters for the user.
- No additional download is required. All the necessary dependencies are embedded in the EA.
Configuring the Input Settings
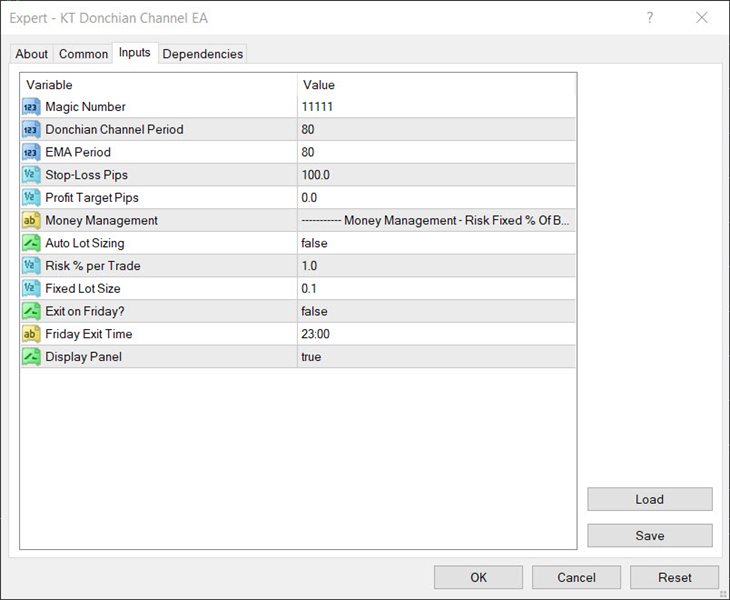
It offers an impressive degree of customization, allowing you to fine-tune your trading strategy based on your unique preferences and the current market conditions.
One of the key adjustable settings in the EA involves the periods used for each indicator - the Donchian Channel, Exponential Moving Average (EMA), and the Average True Range (ATR).
The period refers to the number of bars, or timeframes, used to calculate the indicator's value. For instance, a period of 20 for the Donchian Channel would mean that the upper band represents the highest price over the past 20 bars, and the lower band represents the lowest price over the same span.
Trading Strategy
The EA employs an entire system of data-driven strategy, taking advantage of the strong interaction between the Donchian Channel indicator, Exponential Moving Average (EMA), and Average True Range (ATR).
Buy Entry
- The price needs to close above the upper band of the Donchian Channel. This typically indicates a bullish breakout, suggesting that the price is steadily moving upwards.
- The EMA needs to be rising. The EMA is a moving average that gives more weight to recent prices. When the EMA is increasing, it suggests that the average price over the defined period is rising, indicating a potential uptrend.
- The "fast" ATR must be above the "slow" ATR. ATR is a measure of market volatility. When the fast (shorter period) ATR is above the slow (longer period) ATR, it implies that recent volatility is higher than the average volatility over a longer period, potentially indicating an increase in bullish momentum.
Sell Entry
- The price needs to close below the lower band of the Donchian Channel. This is seen as a bearish breakdown, suggesting the price moves downwards with strong momentum.
- The EMA should be falling. When the EMA is decreasing, it suggests that the average price over the defined period is declining, indicating a potential downtrend.
- The fast ATR should be below the slow ATR. This suggests that recent volatility is lower than the average volatility over a longer period, potentially indicating an increase in bearish momentum.
