Binary Options Indicator
- Göstergeler
- Angelo Capoferri
- Sürüm: 1.1
- Etkinleştirmeler: 5
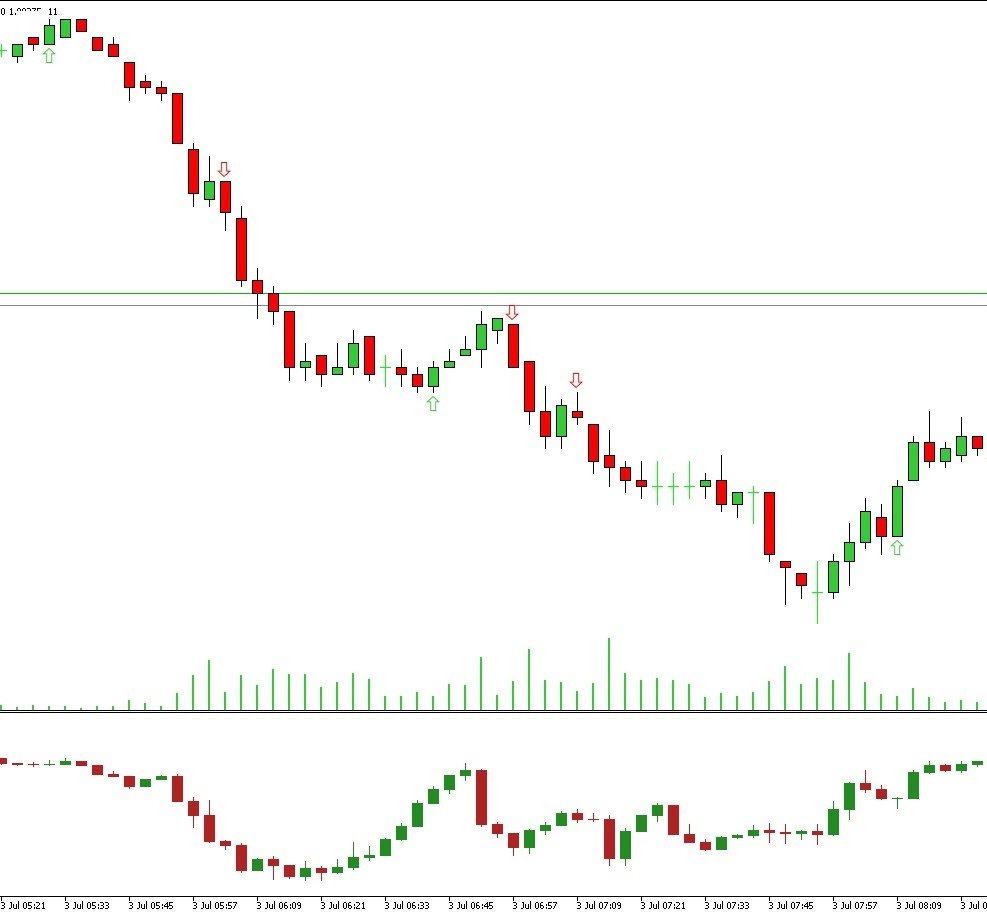
Gösterge, İKİLİ SEÇENEKLER için giriş sinyalleri üretir, grafikte bir ok çizer ve sesli bir uyarı verir.
ÇALIŞMA SAATLERİ: 6.OO GMT/ 17.00 GMT (17.00 GMT'den sonra ve gece çok düşük volatilite ve hacim eksikliği nedeniyle önerilmez)
ÇİFTLER: EUR/USD (@EU6), GBP/USD (BP6).
Zaman dilimleri: 1,2,3,5,10,15 dakika
En iyi zaman aralığı: 3 dakika
SON KULLANMA TARİHİ: 1 mum
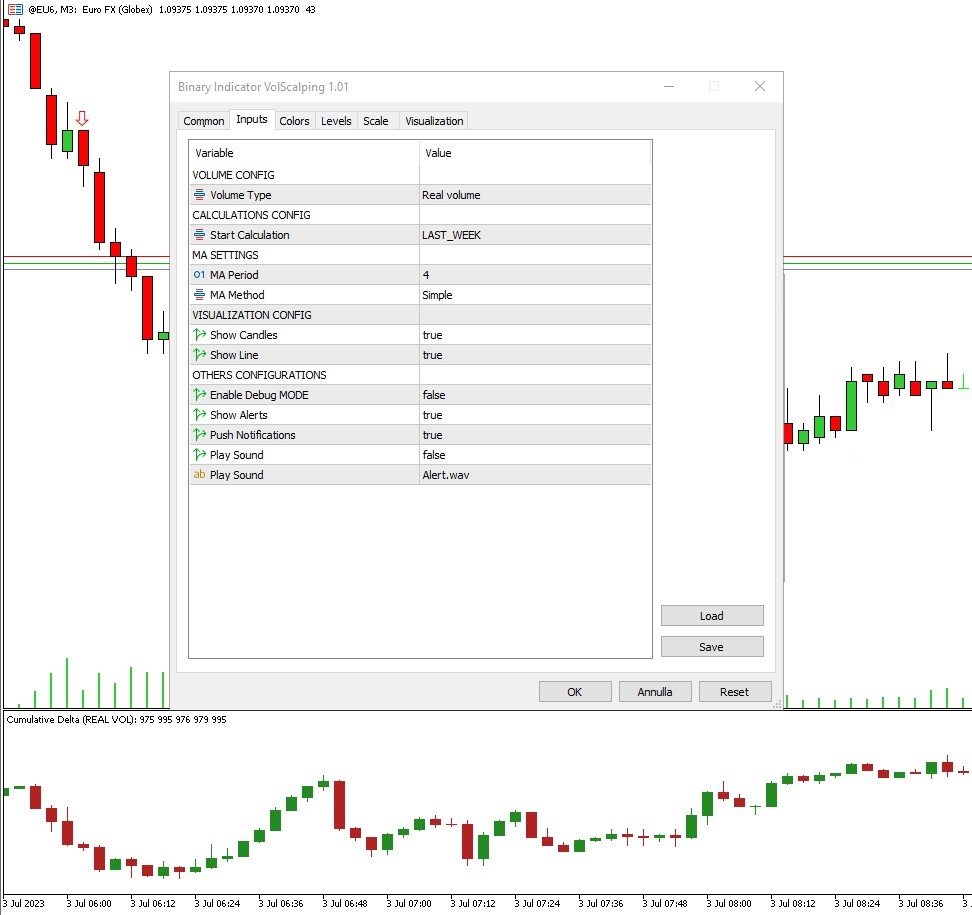
Göstergenin çalışması için gerçek hacimlere (onay hacmi yok) ihtiyacı vardır: EUR/USD, GBP/USD ECC spot çiftlerinde çalışmaz, ancak referans Gelecek sözleşmesinde (ticker) çalışır: bu nedenle metatrader 5'te bir komisyoncu kullanmak gerekir gerçek zamanlı olarak gerçek hacimli vadeli işlem sözleşmeleri sağlayan.
EUR/USD için referans gelecek: @EU6
GBP/USD için referans gelecek BP6'dır.
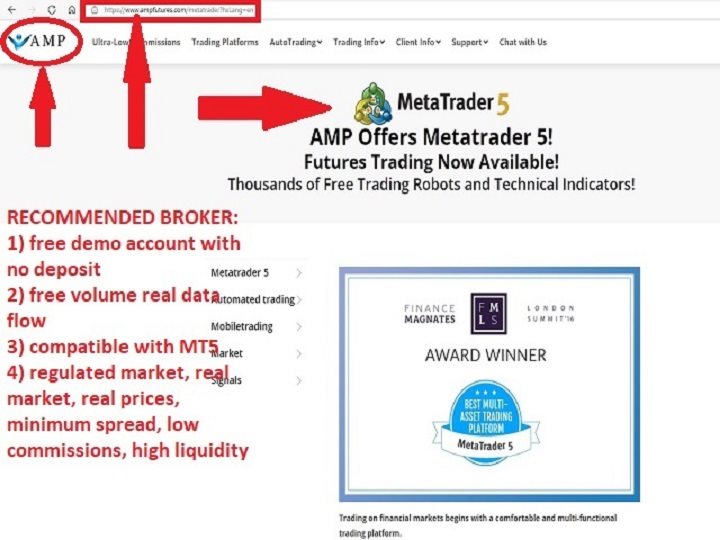
Gerçek hacimlere sahip vadeli işlemleri gerçek zamanlı olarak ücretsiz olarak sunan bir broker AMP GLOBAL'dir.
(mt5'te şunu seçin: DOSYA/ YENİ HESAP/ APM GLOBAL CLEARING brokerini arayın ve demo hesabını açın. DEMO HESABI 1 AY SÜRER. 30 gün sonra, prosedürü tekrarlamak ve HER ZAMAN ÜCRETSİZ olarak yeniden açmak gerekir.
GÖSTERGE, GRAFİK ÜZERİNDE OTOMATİK OLARAK KİMÜLATİF DELTA YÜKLER, çalışması için buna ihtiyaç duyar, çünkü daha önce de belirtildiği gibi gösterge, fiyatların kümülatif deltadan tahmin edilen trend ve gerçek hacimlerle yakınsamasına dayanır.
Göstergenin PERFORMANSI aylık bazda %70'in üzerinde ITM sinyalleri: ITM sinyallerinin günlük yüzdesi %90 ila %50 arasındadır. YETERLİ BİR PARA YÖNETİMİNİN KULLANILMASI TAVSİYE EDİLİR (Masaniello önerilir)