 MetaTrader 5
 Uzmanlar
 Göstergeler
 Komut dosyaları
 Kütüphaneler
 Depo
DepoFan sayfamıza katılın

Sessionvolatilityheatmap - MetaTrader 5 için gösterge

- Görüntülemeler:
- 12
- Derecelendirme:
- Yayınlandı:
-
 Alım-satım fırsatlarını kaçırıyorsunuz:
- Ücretsiz alım-satım uygulamaları
- İşlem kopyalama için 8.000'den fazla sinyal
- Finansal piyasaları keşfetmek için ekonomik haberler
Kayıt Giriş yapWeb sitesi politikasını ve kullanım şartlarını kabul edersiniz
Hesabınız yoksa, lütfen kaydolun -
 Bu koda dayalı bir robota veya göstergeye mi ihtiyacınız var? Freelance üzerinden sipariş edin
Freelance'e git
Bu koda dayalı bir robota veya göstergeye mi ihtiyacınız var? Freelance üzerinden sipariş edin
Freelance'e git
Oturum Oynaklığı Isı Haritası
Bunun arkasındaki fikir
Çoğu yatırımcı, seans saatlerinin ders kitaplarındaki versiyonunu bilir, ancak her sembolün kendine özgü bir ritmi vardır — sembolün gerçekten hareketlendiği saat, her zaman seans kılavuzunda belirtilen saatle aynı değildir. Bu gösterge, tahminlerin yerine bir ölçüm sunar: grafiğin kendi zaman diliminde InpLookbackDays kadar geçmiş veriyi alır, her bir çubuğun (yüksek − düşük) aralığını kapandığı saate göre gruplandırır ve 24 saatlik grupların her birinin ortalamasını hesaplar. Sonuç, küçük bir ısı haritası paneli olarak çizilir ve aynı üç ana seans, mum çubuklarının hemen arkasına gölgelendirilerek iki görünümün bir bakışta birbiriyle uyumlu hale getirilmesi sağlanır.
Nasıl yorumlanır?
- Isı haritası çubukları — 24 sütunun her biri, broker/sunucu gününün bir saatini temsil eder. Daha uzun ve sıcak renkli sütunlar, bu belirli sembolün tarihsel olarak daha fazla hareket ettiği saatleri; kısa ve soğuk renkli sütunlar ise sakin saatleri gösterir. Kendi geçmiş verilerinizden hesaplandığı için, genel bir seans grafiği değil, bu sembolü ve bu broker'ın sunucu saatini yansıtır.
- Seans şeritleri — fiyatın arkasındaki soluk gölgeli dikdörtgenler, son InpSessionDays günlerinin her biri için Asya, Londra ve New York seanslarını gösterir. İki şerit üst üste geldiği yer, günün en yüksek likiditeye sahip kısmıdır; bunu ısı haritası paneli ile görsel olarak karşılaştırdığınızda, genellikle en uzun çubukların da bu bölgede olduğu doğrulanır.
- İkisini birlikte incelediğinizde — ısı haritası size hangi saat olduğunu, seans bantları ise nedenini gösterir. Isı haritasındaki en yüksek çubuk, enstrümanınızdaki bir seans çakışmasıyla örtüşmüyorsa, bu genellikle tek başına dikkate değer bir bilgidir — bu durum genellikle o saati yönlendiren şeyin seans akışı değil, planlanmış bir veri açıklaması (açılış, sabitleme veya tekrarlanan bir veri yayını) olduğu anlamına gelir.
Bu bir ölçüm aracıdır, sinyal üreteci değildir. Giriş veya çıkış önermez — sadece tarihsel volatilite ve likiditenin gerçekte nerede olduğunu gösterir; böylece ne zaman işlem yapacağınız (veya ne zaman bekleyeceğiniz) konusundaki kararlar, varsayımlara değil ölçülen verilere dayalı olarak alınır.
Dış değişkenler (girişler)
| Giriş | Varsayılan | Amaç |
|---|---|---|
| InpLookbackDays | 30 | Saatlik ortalamaya kaç günlük geçmiş verisi dahil edilir. Daha uzun zaman aralıkları, tek seferlik haber kaynaklı ani yükselmeleri yumuşatır; daha kısa zaman aralıkları ise sembolün ritmindeki gerçek bir değişime daha hızlı tepki verir. |
| InpCorner / InpOffsetX / InpOffsetY | Sağ Üst / 12 / 18 | Isı haritası panelinin grafikte yer aldığı konum. |
| InpPanelWidth / InpPanelHeight | 340 / 150 | Piksel cinsinden panel boyutu. |
| InpRefreshSecs | 30 | Tiklerden bağımsız olarak panelin geçmiş verilerden ne sıklıkla yeniden hesaplama yapacağı. |
| InpShowSessions | true | Fiyat grafiğinde seans arka plan gölgelendirmesini açar veya kapatır. |
| InpSessionDays | 6 | Gölgelendirilecek son gün sayısı. Grafiğin nesnelerle dolmasını önlemek için varsayılan olarak makul bir değerde tutulur. |
| InpAsianStartHour / InpAsianEndHour | 0 / 9 | Asya seansı aralığı, broker/sunucu saati. |
| InpLondonStartHour / InpLondonEndHour | 7 / 16 | Londra seansı penceresi, broker/sunucu saati. |
| InpNewYorkStartHour / InpNewYorkEndHour | 12 / 21 | New York seans aralığı, broker/sunucu saati. |
| InpBackColor / InpBorderColor / InpTextColor | koduna bakınız | Isı haritası panelinin renk şeması. |
| InpLowColor / InpHighColor | koda bakın | Isı haritasının en sakin saatten en yoğun saate kadar arasında enterpolasyon yaptığı iki renk. |
| InpAsianBandColor / InpLondonBandColor / InpNewYorkBandColor | soluk mavi / kehribar / kırmızı | Oturum gölgelendirme renkleri. Grafik dikdörtgen nesneleri tamamen opak olarak görüntülenir; bu nedenle varsayılan olarak soluk tutulmuştur — geriye dönülecek gerçek bir şeffaflık yoktur, dolayısıyla rengin kendisi yumuşak kalmalıdır. |
Önerilen kullanım
Her brokerın sunucu saati UTC'ye göre farklı şekilde ayarlanmıştır; bu nedenle, varsayılan seans saatlerine güvenmeden önce brokerınızın sunucu saatinin gerçekte ne olduğunu kontrol edin — bunlar genel geçer sabitler değil, tipik başlangıç noktalarıdır. Brokerınız için üç aralık doğru şekilde ayarlandığında, panel ve gölgelendirme kendiliğinden doğru kalır; başka bir bakım işlemi gerekmez.
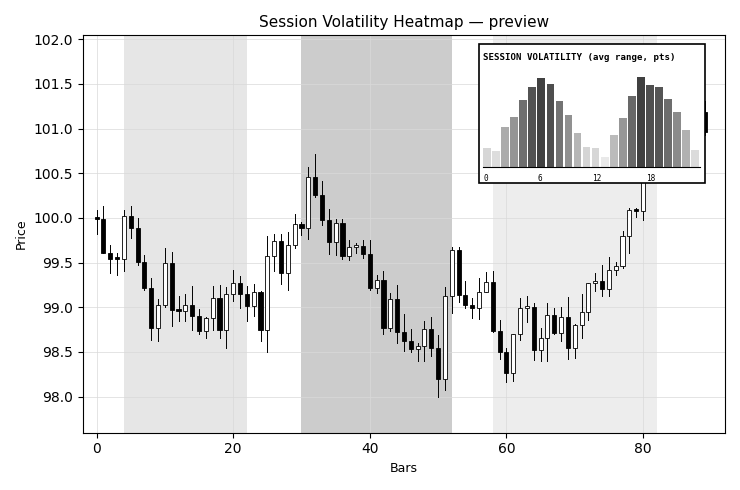
Şekil 1. Seans gölgelendirmeli mum çubuklarının yanında saatlik volatilite ısı haritası paneli. Code Base görsel kılavuzuna uygun olarak siyah beyaz olarak görüntülenmiştir.
MetaQuotes Ltd tarafından İngilizceden çevrilmiştir.
Orijinal kod: https://www.mql5.com/en/code/75556
 GoldLondonBreakout
XAUUSD'de Asya seansı boyunca aralık içinde işlem yapılır, ardından Londra seansının açılışına yönelik ATR tabanlı stop seviyeleri ve risk yüzdesine dayalı pozisyon büyüklüğü ile bir OCO kırılma çifti (Alış Stop/Satış Stop) açılır. Gösterge yok, keyfi karar yok — aralık tahmin edilmez, ölçülür.
Fair Value Gap Scanner MT5
An MT5 fair value gap scanner that marks bullish and bearish imbalances and tracks when each zone is filled.
IronHawk SMC Trade Zones M5
A closed-bar M5 indicator combining market structure, liquidity sweeps, BOS/CHoCH and momentum to display Entry, SL, TP1 and TP2, with retail-frequency signals and clickable setup history.
 Portfolio Correlation Analyzer
Birden fazla Uzman Danışman çalıştıran hesaplar için salt okunur analizler. Bu analiz, kapanmış işlemleri “magic number” (benzersiz kimlik numarası) bazında gruplandırır ve bu sistemlerin birlikte çalıştırılmasının size gerçekte ne kadar tasarruf sağladığını ölçer: tek başına ve birleştirilmiş durumdaki değer kaybı karşılaştırması, grafikte ısı haritası olarak gösterilen ikili korelasyon matrisi ve portföyün dönem getirilerinin Monte Carlo yöntemiyle yeniden düzenlenmesi.