Thiago Duarte / Профиль
- Информация
|
8+ лет
опыт работы
|
47
продуктов
|
314
демо-версий
|
|
8
работ
|
0
сигналов
|
0
подписчиков
|
Я работаю на рынке с 2016 года, я бразилец.
Я основатель и администратор Litoral Trading — сообщества энтузиастов финансового рынка.
Я программирую на MQL5 с марта 2019 года и специализируюсь на MT5, чтобы способствовать вашему росту.
Путешественник и любитель двухколёсного транспорта.
Хотите автоматизировать некоторые из ваших стратегий? Свяжитесь со мной для получения цены!
Наши страницы:
▪️ YouTube: www.youtube.com/c/LitoralTrading
▪️ Сайт: https://litoraltrading.com/?origem=MQL5
LT Support Resistance — Автоматическое определение уровней поддержки и сопротивления на 100% Вы устали тратить время на ручное построение линий поддержки и сопротивления? Или расстраиваетесь из-за того, что постоянно упускаете важный уровень? Индикатор LT Support Resistance разработан для того, чтобы избавить вас от этой рутины: он автоматически определяет и отмечает наиболее значимые зоны вашего актива одновременно на нескольких таймфреймах. == УМНАЯ АВТОМАТИЗАЦИЯ КРИТИЧЕСКИХ УРОВНЕЙ == Вместо
Using the Stochastic Oscillator with a Moving Average is a simple but very efficient strategy to predict a trend reversal or continuation. The indicator automatically merges both indicators into one. It also gives you visual and sound alerts. It is ready to be used with our programmable EA, Sandbox, which you can find below: Our programmable EA: https://www.mql5.com/en/market/product/76714 Enjoy the indicator! This is a free indicator, but it took hours to develop. If you want to pay me a
LT HiLo Activator переносит на ваш график признанную методологию следования за трендом, созданную известным трейдером Robert Krausz. Это важный технический инструмент для захвата крупных рыночных движений и предотвращения сделок против текущей рыночной тенденции. Практичный, объективный и легко читаемый, HiLo работает как направленная «лестница» поддержки и сопротивления, упрощая определение точек входа, выхода и защиты капитала. ⭐ Как применять на практике ■ Восходящий тренд (динамическая
Donchian Channel is an indicator created by Richard Donchian. It is formed by taking the highest high and the lowest low of the last specified period in candles. The area between high and low is the channel for the chosen period. Its configuration is simple. It is possible to have the average between the upper and lower lines, plus you have alerts when price hits one side. If you have any questions or find any bugs, please contact me. Enjoy
Daily Projection Levels , as the name implies, is an indicator that project the price changes in percentage above and below the opening of the day (or closing of the previous day. These are "psychological" support and resistance areas where price tries to retrace or break out. With this you have a powerful tool to predict what these zones will be! You can define which projection levels you want (up to 5 above and below), in addition to have alert messages and visual customization. If you want to
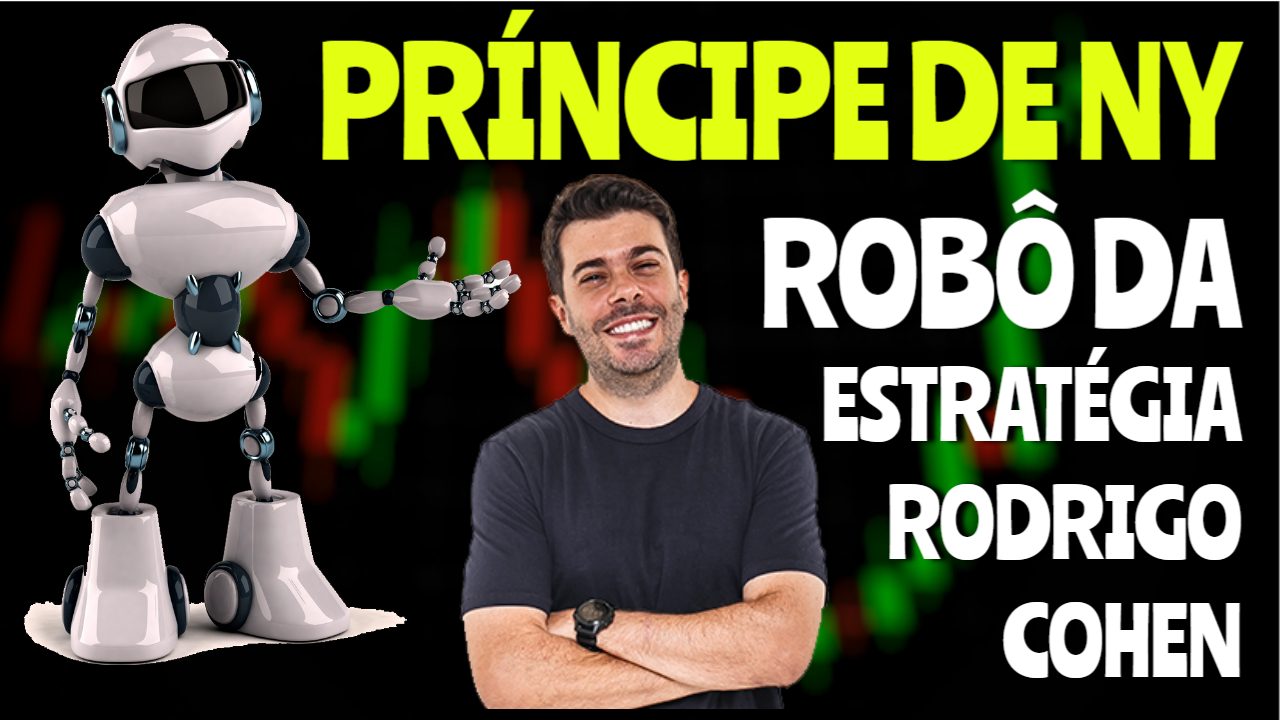
Nesse vídeo eu mostro como automatizar a estratégia Príncipe de NY do Rodrigo Cohen:
https://www.youtube.com/watch?v=K4Ax1WCcq70
== LT RAINBOW TREND — ТРЕНДОВЫЙ ИНДИКАТОР НА ОСНОВЕ 36 СКОЛЬЗЯЩИХ СРЕДНИХ == ■ ОБЗОР LT Rainbow Trend — это продвинутый технический индикатор для анализа тренда, который использует 36 одновременно работающих скользящих средних с умной цветовой системой («Радуга»). Разработанный для трейдеров, стремящихся торговать по направлению главного тренда с максимальной визуальной четкостью, этот индикатор превращает сложный мультитаймфреймовый анализ в простое, цветное и интуитивно понятное отображение
LT Colored Fibo is a simple indicator that paints the price zones between Fibonacci Retracement levels. Its configuration is extremely simple. It is possible to change the colors of each level of the retracement, choose between background or front of the chart and also work only with the current asset or all open. If you found a bug or have any suggestion for improvement, please contact me. Enjoy! This is a free indicator, but it took hours to develop. If you want to pay me a coffee, I
LT Easy Trend — Сила конфлюэнции в одном индикаторе Вы когда-нибудь чувствовали неуверенность, когда один индикатор сигнализирует о покупке, а другой — о продаже? LT Easy Trend был разработан, чтобы устранить эту неопределенность, предоставляя сигналы высокой вероятности, основанные на математическом консенсусе 9 самых уважаемых технических индикаторов в мире . Вместо того чтобы загромождать график десятками окон, Easy Trend обрабатывает всё в режиме реального времени и
I know, you have an idea for an EA and would like to develop your own without the need of a programmer? Then LT Sandbox EA will help you with that! As the name says (sandbox), you can configure it the way you want (within your limitations, of course). With it you can use up to 13 indicators, including an external indicator (from a third party), being able to make dozens of combinations! Available indicators: Moving Average (two of them) RSI Stochastic Oscillator MACD Bollinger Bands Parabolic
Candle Counter is a simple indicator that list the amout of candles in the day according to the current chart timeframe. It is specially useful for those teaching others how to trade, as it can draw attention to a specific candle of the day. Configuration: Reverse mode - if on, the actual candle is the first one. Position - Above or below the candles. Vertical distance - Vertical distance from the candles in pipets/points. Size - Font size. If you need help please don't hesitate to contact me
Protect My Trades is an EA (expert advisor bot) that automatically put stop loss and take profit on market trades and pending orders. You can specify if want it to do this only on actual symbol trades or in all others. Its configuration is very simple. Functions: Take profit: distance to TP (0 = disabled, no TP will be created). Stop loss: distance to SL (0 = disabled, no SL will be created). Price type: price type in pips or pipets/points (pips is common in Forex). Actual symbol only: manage
https://www.mql5.com/pt/code/25893
This is a utility indicator that creates mini charts on left side of the chart you are looking at. It is very useful to watch many timeframes simultaneously, without having to change between multiple charts. Its configuration is very simple. You can have up to 4 mini charts opened. They automatically load the template of the "parent" chart. If you have any doubt please contact me. Enjoy! This is a free indicator, but it took hours to develop. If you want to pay me a coffee, I appreciate a
Exaustion Oscillator: https://www.mql5.com/en/market/product/41924
zalo(0919289638) telegam
https://www.youtube.com/watch?v=ymxbY5aqzDg