Intraday relative volatility
- Индикаторы
- Jere Katainen
- Версия: 1.1
- Обновлено: 24 марта 2023
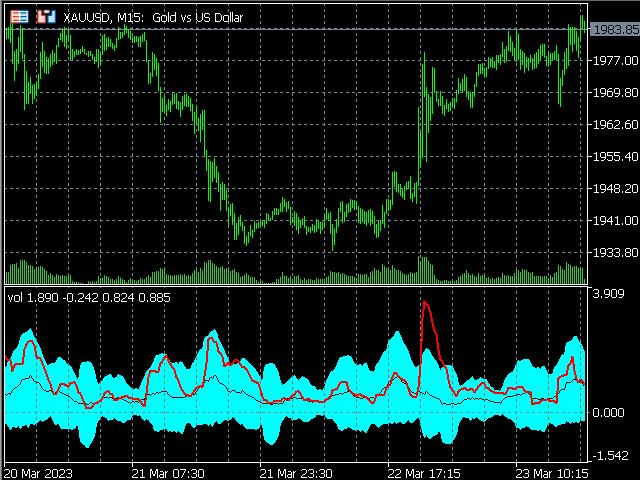
This indicator can be used to study the repeating daily volatility structure, and also find deviations from the historical means.
Black line tells the average volatility of current hour from last 30 days. Blue bands tell the confidence interval (2 times standard deviation). Red line tells the current volatility, ATR.
Inputs:
- days: the number of days where to calculate the average volatility
- atrp: the ATR period used to measure volatility


