• Обзор
  • Отзывы
  • Обсуждение

Dynamic Moving Averagez

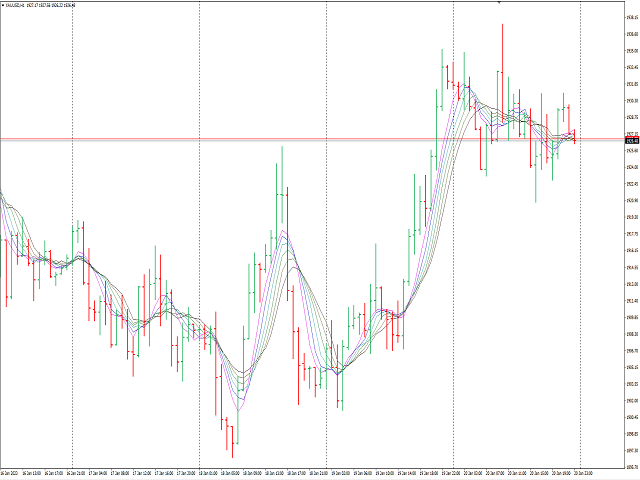
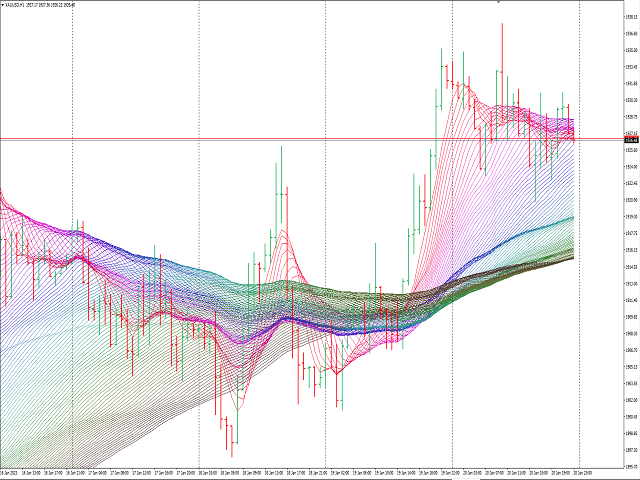
With dynamic Moving average, you can estimate the price movement, predict the next trend of price and have a better decision.

Parameters setup:

Period start <= Period Stop

Period start >= 1

Maximum lines is 100

You can customize Moving average method: Simple averaging, Exponential averaging, Smoothed averaging, Linear-weighted averaging

and price to apply:

PRICE_CLOSE: Close price
PRICE_OPEN: Open price
PRICE_HIGH: The maximum price for the period
PRICE_LOW: The minimum price for the period
PRICE_MEDIAN: Median price, (high + low)/2
PRICE_TYPICAL: Typical price, (high + low + close)/3
PRICE_WEIGHTED: Weighted close price, (high + low + close + close)/4


Рекомендуем также
"Hunttern harmonic pattern finder" base on the dynamic zigzag with the notification and prediction mode This version of the indicator identifies 11 harmonic patterns and predicts them in real-time before they are completely formed. It offers the ability to calculate the error rate of Zigzag patterns depending on a risk threshold. It moreover sends out a notification once the pattern is complete. The supported patterns: ABCD BAT ALT BAT BUTTERFLY GARTLEY CRAB DEEP CRAB CYPHER SHARK THREE
The   ICT Propulsion Block   indicator is meant to detect and highlight propulsion blocks, which are specific price structures introduced by the Inner Circle Trader (ICT). Note: THIS IS MTF version.  Single Timeframe version avaiable at   here  Propulsion Blocks are essentially blocks located where prices interact with preceding order blocks. Traders often utilize them when analyzing price movements to identify potential turning points and market behavior or areas of interest in the market.
Volume Trade Levels
Mahmoud Sabry Mohamed Youssef
The idea behind this indicator is very simple , First it contains 2 mechanisms to place your trades: 1- Enter the Pips you want to duplicate to price levels. 2- Automatically let the indicator specify the largest Buy / Sell Volume Candle and place duplicated levels based on the candle itself. How it works: 1- Enter the Pips you want to duplicate to price levels:    1- once the indicator is loaded you will need first to Specify the number of pips in the indicator Configuration window ,you can
Этот индикатор зон спроса и предложения рисует зоны на графике и отправляет оповещения, когда цена достигает или пробивает зону. Его также можно использовать для получения предупреждений о регулярных двойных вершинах/основаниях вместо зон. Можно использовать фильтры RSI, объема и дивергенции, чтобы отфильтровать только самые сильные сетапы. В сочетании с вашими собственными правилами и методами этот индикатор позволит вам создать (или усовершенствовать) собственную мощную систему. Этот индикатор
This Indicator draws Fibonacci Extension levels in two different ways. You can select whether to draw Fibonacci Extension levels based on your favourite ZigZag settings or you can let the indicator to draw Fibonacci Extension  level based on given number of Bars or Candles.  You can also set Mobile and Email notification for your favourite Extension  levels individually. With this indicator you will not have to feel lonely as the it can generate Voice alerts, which will keep you focused on your
Смысл этого индикатора состоит в том, чтобы  находить уровни Мюррея на всех таймфреймах  и объединять их в  комбо-уровни , включающие сигнальные уровни, основанные на сильных уровнях Мюррея   (+2,   +1, 8, 4, 0, -1, -2). Чем меньше таймфрейм, тем больше у вас шансов сразу увидеть уровень комбо. Он будет выделен цветом. При наведении курсора на любое число появится подсказка, к какому таймфрейму относится уровень. Но вы всегда будете видеть текущий таймфрейм крайним левым. Умное оповещение   помо
Indicator Statistics MultiPairs 1. Current Openning Ords - Symbols Openning + Buy Orders + Buy Volume + Sell Orders +Sell Volume - DrawDown by Symbols - Floating by Symbols 2. Closed Orders - Statistics by Today, Week, Month, YTD and Volume - Sum of Closed Orders by Symbol 3. Statistics by Day - Statistics by Say and Volume 4. DrawDown by Day - Each day DrawDown in Week - Percent of DrawDown Contact me at Telegram @MaiMew68
機能&特徴: ZigZagをもとに主要なレジスタンスとサポートラインを引きます。 各時間足で押し安値、戻り高値を簡単に把握できます。 現在何波目なのか簡単に把握できます。 ※ トレンド転換時はカウンターは1、継続時は2,3,4..となります。 ※ちなみにこちらはZigZagの谷山を数えています。エリオット波動数ではありません。 現在買い目線でいるべきなのか売り目線なのか簡把握できます。 過去2つのZigZagラインで静的にフィボナッチを引きます。 今の値動きで動的にフィボナッチを引きます。 逆フィボナッチ(静的なフィボナッチのみ)に変更することも可能になります。 ボタンにより以下の操作が可能になります。 1.ZigZagラインの表示、非表示 2.ノーマルフィボナッチ、逆フィボナッチの切り替え ※環境により表示に時間が掛かる場合があります。 3.1分足、5分足、15分足で1つ上のZigZagラインが引けるようになりました。 4.レジスタンスとサポートラインを再描写します。  トレンド継続や変換をアラートで通知します。 エリオ
This Indicator draws Fibonacci Arc levels in two different ways. You can select whether to draw Fibonacci Arc levels based on your favourite ZigZag settings or you can let the indicator to draw Arc levels based on given number of bars or candles.  You can also set Mobile and Email notification for your favourite Arc levels individually. With this indicator you will not have to feel lonely as the it can generate Voice alerts, which will keep you focused on your trading and remove boredom.  Produc
Boom 600 Precision Spike Detector The Boom 600 Precision Spike Detector is your ultimate tool for trading the Boom 600 market with precision and confidence. Equipped with advanced features, this indicator helps you identify potential buy opportunities and reversals, making it an essential tool for traders aiming to capture spikes with minimal effort. Key Features: Non-Repainting Signals: Accurate, non-repainting signals that you can trust for reliable trading decisions. Audible Alerts: Stay on t
The indicator displays the total number of ticks during the formation of a single bar. It can be used to analyze market activity in financial trading. Peaks and troughs of the indicator effectively highlight potential reversal points in price movements. This tool is particularly useful for traders seeking to identify periods of high volatility, allowing them to make informed decisions based on tick volume patterns. By observing changes in tick frequency, traders can gain insights into market se
MinMax Levels MinMax Levels  –  это индикатор уровней максимальной, минимальной и цены открытия за важные торговые периоды: дня, недели и месяца. Каждый участник рынка форекс испольует уровни в своей торговой системе. Они могут быть как основным сигналом к совершению сделок, так и дополнительным, выступая в качестве аналитического инструмента.  В данном индикаторе в качестве важных периодов были выбраны дни, недели и месяцы, поскольку они являются кючевыми периодами торговли крупных участников
ATR является важным показателем для любого финансового рынка. Аббревиатура ATR означает Средний Истинный Диапазон (Average True Range). Этот индикатор является инструментом, для определения волатильности рынка, это его прямое назначение. ATR показывает средний ход цены за выбранный нами период времени. Начальная цена индикатора 63$. Цена будет увеличиваться каждые 10 продаж   до 179$ Оригинальный индикатор ATR есть во многих программах для трейдинга. Индикатор ATR не очень информативен, поэтому
To get access to MT4 version click here . This is the exact conversion from "Nadaraya-Watson Envelope" by " LuxAlgo ". (with non-repaint input option) This is not a light-load processing indicator if repaint input is set to true . All input options are available.  Buffers are available for processing in EAs. I changed default input setup to non-repaint mode for better performance required for mql market validation procedure . Here is the source code of a simple Expert Advisor operating based on
KT Renko Patterns MT5
KEENBASE SOFTWARE SOLUTIONS
KT Renko Patterns scans the Renko chart brick by brick to find some famous chart patterns that are frequently used by traders across the various financial markets. Compared to the time-based charts, patterns based trading is easier and more evident on Renko charts due to their uncluttered appearance. KT Renko Patterns features multiple Renko patterns, and many of these patterns are extensively explained in the book titled Profitable Trading with Renko Charts by Prashant Shah. A 100% automate
Opening Range Indicator   Idea Toby Crabel introduced this way of trading in the ealy ninties in his book "Day Trading with Short Term Price Patterns and Opening Range Breakout". In simple terms this means to trade the brekouts from the limits of the first trading hour with the stop loss at the opposite side. I.e. if the first hourly candle meausres 40 points (Crabel calls this the "stretch") you set the stop loss at breakout level minus 40 points and the take profit at the breakout level plus
FREE
Средний дневной диапазон (ADR) - это индикатор, который показывает, как далеко валютная пара может продвинуться за день. Автоматически отображает верхний и нижний уровни ADR. Автоматически рассчитывает процент и расстояние ADR, достигнутый валютной парой за день. Оповещает при достижении ценой уровня ADR. Меняет цвет и толщину линии ADR, при достижении его ценой. Устанавливает уровни открытия дня.
This indicator simplifies your entry zones by displaying the areas where you can plan your entry that potentially could give you high risk/reward ratios. Other than picking the most optimal entry points, the Hot Zone indicator can act as your typical support/resistance indicator for pullbacks for all timeframes. You can use this indicator as the only trading indicator or use it with another indicator for reentry purposes.  Besides, when using Hot Zones, the risk/reward ratio should be well abov
I've combined two trading strategies, the Order Block Strategy and the FVG Trading Strategy, by utilizing a combination of the FVG indicators and Order Blocks. The results have been surprisingly effective. This is a two-in-one solution that makes it easy for traders to identify critical trading zones. I've optimized the settings so that all you need to do is install and trade; it's not overly complex to explain further. No need for any usage instructions regarding the trading method. You shou
Индикатор отображает уровни High и Low предыдущих дня, недели и месяца. Предназначен для определения пробоя экстремумов и определения направления входа в торговлю. Для более точного определения уровней разворота можно вывести уровни Фибоначчи. Так же есть возможность закрашивать пространство между High и Low для более наглядного отображения движения цены за предыдущий расчетный период. Есть индикация времени до закрытия текущей свечи (бара).  В версии 2.0 добавлены сигналы 3-х уровней разворота
Fibonacci and RSI. Demo versión only works with GBPUSD. For full version, please, visit visit https://www.mql5.com/en/market/product/52101 The indicator is a combination of the Fibonacci and RSI indicators. Every time the price touches one of the fibonacci levels and the rsi condition is met, an audible alert and a text alert are generated. Parameters number_of_candles : It is the number of candles that will be calculated. If you put 100, the indicator will give you the maximum and min
FREE
In the context of trading, Malaysia SNR (Support and Resistance) refers to the technical analysis of support and resistance levels in financial markets, particularly for stocks, indices, or other assets traded. This is single timeframe version. Multiple timeframe version is avaiable here . There are three type of Malaysia SNR level Classic , GAP and Flipped 1. Classic Support is the price level at which an asset tends to stop falling and may start to rebound. It acts as a "floor" where demand is
For MT4 version please click here . - This is the exact conversion from TradingView source: "Hurst Cycle Channel Clone Oscillator" By "LazyBear". - All input options are available. - This is a non-repaint and light processing load indicator. - Buffers are available for use in EAs and optimization purposes. - You can message in private chat for further changes you need.
Somewhere over the rainbow It is a system that tries to operate the market from the exhaustion of the trend with a correction algorithm that tries to cut losses at the cost of increasing the margin This system makes all the adjustments automatically, analyzing the pair and the market to decide which is the most efficient step to reach your destination. Somewhere over the rainbow is a multiple trade and multi lot system(The maximum batch can be up to 5 times the initial batch distributed in mul
«HiperCube USD INDEX (DXY /USDX) » — это финансовый бенчмарк, представляющий собой производительность определенной группы активов, таких как акции, облигации или сырьевые товары, стоимость которых выражена в долларах США. Эти индексы помогают инвесторам отслеживать и сравнивать производительность определенных секторов или рынков с течением времени. Выражаясь в долларах США, индекс обеспечивает последовательную меру оценки инвестиций независимо от национальной валюты активов или географического
Levels Mult OHLC
Cinthia Regina De Moraes
Considerando que os preços de OHLC de períodos anteriores são regiões importantes de negociação, criei um indicador que traça linhas de Open, High, Low e Close do dia, semana ou mês anterior no gráfico atual. Além de marcar essas regiões, linhas extras foram inseridas como opção que marcam os MEIOS (50%) dessas regiões e uma linha que marca a ABERTURA do dia. O usuário pode configurar a exibição das linhas que achar mais expressivas. Configurações: PERIOD RANGE Timeframe = Período de referência
Contact me for instruction, any questions! Introduction The breakout and retest strategy is traded support and resistance levels. it involves price breaking through a previous level.  The break and retest strategy is designed to help traders do two main things, the first is to avoid false breakouts. Many false breakouts start with a candlestick that breaks out of a level but ends with an immediate candlestick that brings the price back into the level. The second thing that the breakout and re
LineaMMSuavizado
Cesar Juan Flores Navarro
Se considera la secuencia de la serie Fibonacci (2,3,5,8,13) que sera multiplicado por un periodo (11 o 33 o 70 etc.), de las 5 lineas se sacara una sola que sera contendrá el máximo y mínimo de las 5, a esta linea se le aplicara un suavizador de 3....y a esta linea suavizada se le volverá a aplicar un suavizador de 3. obteniéndose 2 lineas suavizadas. A simple vista se ve las intersecciones que hacen las lineas que pueden ser usadas para comprar o vender. Cambien se puede usar con apoyo de otro
Directional Volatility and Volume Oscillator for MetaTrader 5 - Master Market Dynamics Discover the power of precision trading with the "Directional Volatility and Volume Oscillator" meticulously designed for MetaTrader 5. This advanced tool combines the insights of directional analysis, volatility measurement, and volume tracking to provide you with unparalleled market understanding. Basic Details : Indicator Type : Directional Volatility and Volume Oscillator for MetaTrader 5 Key Metrics : Rea
MarkerElliottWave — это панель для быстрой и удобной ручной разметки волн Эллиотта. Имеется возможность выбора цвета и шрифта меток. Так же присутствуют функции удаления последней разметки и всей разметки, созданной индикатором. Разметка происходит моментально в один клик. Пять раз нажал — пять волн разметил! MarkerElliottWave будет хорошим инструментом как для начинающих, так и для профессиональных аналитиков волн Эллиотта.
С этим продуктом покупают
INSTRUCTIONS     RUS   -  ENG                    Рекомендуем использовать с индикатором - TPSpro  TREND PRO -  Version MT4 Важным ключевым элементом в трейдинге являются зоны или уровни, от которых принимаются решения о покупке или продаже торгового инструмента. Несмотря на попытки крупных игроков скрыть свое присутствие на рынке, они неизбежно оставляют следы. Наша задача заключалась в том, чтобы научиться находить эти следы и правильно их интерпретировать. Основные функции: Отображения акти
TPSpro TREND PRO   —  трендовый индикатор, который автоматически анализирует рынок и предоставляет информацию о тренде и каждой его смене а также дающий сигналы для входа в сделки без перерисовки! Индикатор использует каждую свечу, анализируя их отдельно. относя к разным импульсам – импульс вверх или вниз. Точные точки входа в сделки  для  валют, крипты, металлов, акций, индексов! Version MT4                ПОЛНОЕ ОПИСАНИЕ ИНДИКАТОРА          Рекомендуем использовать с  индикатором -  RFI LEVE
Прежде всего стоит подчеркнуть, что этот торговый индикатор не перерисовывается, не перерисовывает и не отставает, что делает его идеальным как для ручной, так и для роботизированной торговли. Руководство пользователя: настройки, вводы и стратегия. Атомный аналитик - это индикатор ценового действия PA, который использует силу и импульс цены, чтобы найти лучший край на рынке. Оборудованный расширенными фильтрами, которые помогают убирать шумы и ложные сигналы, и повышают торговый потенциал. Испо
Прежде всего стоит подчеркнуть, что эта торговая система является индикатором без перерисовки, без повторной отрисовки и без задержки, что делает ее идеальной как для ручной, так и для роботизированной торговли. Онлайн курс, руководство и загрузка пресетов. «Smart Trend Trading System MT5» - это комплексное торговое решение, созданное для новичков и опытных трейдеров. Он объединяет более 10 премиальных индикаторов и предлагает более 7 надежных торговых стратегий, что делает его универсальным
Прежде всего стоит подчеркнуть, что этот Торговый Инструмент является Неперерисовывающимся Нерепейнтинговым Индикатором, что делает его идеальным для профессиональной торговли. Онлайн-курс, руководство пользователя и демонстрация. Индикатор Концепций Умного Действия Цены - очень мощный инструмент как для новичков, так и для опытных трейдеров. Он объединяет более 20 полезных индикаторов в одном, комбинируя передовые торговые идеи, такие как анализ Inner Circle Trader и стратегии торговли конц
Топовый индикатор МТ5, дающий сигналы для входа в сделки без перерисовки! Идеальные точки входа в сделки для  валют, крипты, металлов, акций, индексов !  Смотрите  видео  (6:22) с примером отработки всего одного сигнала, окупившего индикатор. Версия индикатора для MT4 Преимущества индикатора Сигналы на вход без перерисовки Если сигнал появился, он никуда НЕ исчезает! В отличие от индикаторов с перерисовкой, которые ведут к потере депозита, потому что могут показать сигнал, а потом убрать его.
Эта панель показывает последние доступные   гармонические паттерны   для выбранных символов, так что вы сэкономите время и будете более эффективны /   MT4 версия . Бесплатный индикатор:   Basic Harmonic Pattern Колонки индикатора Symbol:   отображаются выбранные символы Trend   :   бычий или медвежий Pattern   :   тип паттерна (Гартли, бабочка, летучая мышь, краб, акула, шифр или ABCD) Entry   :   цена входа SL:   цена стоп-лосса TP1:   цена первого тейк-профита TP2:   цена второго тейк-про
Получайте ежедневную информацию о рынке с подробностями и скриншотами через наш утренний брифинг здесь, на mql5 , и в Telegram ! FX Power MT5 NG - это новое поколение нашего популярного измерителя силы валют FX Power. Что же предлагает этот измеритель силы нового поколения? Все, что вы любили в оригинальном FX Power ПЛЮС Анализ силы GOLD/XAU Еще более точные результаты расчетов Индивидуально настраиваемые периоды анализа Настраиваемый предел расчета для еще более высокой производительности Спец
Quantum Trend Sniper
Bogdan Ion Puscasu
4.8 (49)
Представляем       Индикатор Quantum Trend Sniper   , инновационный индикатор MQL5, который меняет способ определения разворотов тренда и торговли ими! Разработан командой опытных трейдеров со стажем торговли более 13 лет,       Снайперский индикатор Quantum Trend       разработан, чтобы вывести ваше торговое путешествие на новые высоты благодаря инновационному способу определения разворотов тренда с чрезвычайно высокой точностью. ***Купите индикатор Quantum Trend Sniper и получите индикатор
Свинг-трейдинг - это первый индикатор, предназначенный для обнаружения колебаний в направлении тренда и возможных разворотов. Он использует базовый подход свинговой торговли, широко описанный в торговой литературе. Индикатор изучает несколько векторов цен и времени для отслеживания направления совокупного тренда и выявляет ситуации, когда рынок перепродан или перекуплен и готов к исправлению. [ Руководство по установке | Руководство по обновлению | Устранение неполадок | FAQ | Все продукты ]
Auto Order Block with break of structure based on ICT and Smart Money Concepts (SMC) Futures Break of Structure ( BoS )             Order block ( OB )            Higher time frame Order block / Point of Interest ( POI )    shown on current chart           Fair value Gap ( FVG ) / Imbalance   -  MTF      ( Multi Time Frame )    HH/LL/HL/LH  -  MTF      ( Multi Time Frame )  Choch  MTF      ( Multi Time Frame )  Volume Imbalance     ,  MTF          vIMB Gap’s Power of 3 Equal High
Matrix Arrow Indicator MT5
Juvenille Emperor Limited
5 (12)
Индикатор Matrix Arrow MT5   — это уникальный индикатор тренда 10 в 1, следующий за   100% неперерисовывающимся   индикатором с несколькими таймфреймами, который можно использовать на всех символах/инструментах:   форекс ,  товары ,   криптовалюты ,   индексы ,  акции . Индикатор Matrix Arrow MT5  будет определять текущую тенденцию на ранних этапах, собирая информацию и данные от до 10 стандартных индикаторов, а именно: Индекс среднего направленного движения (ADX) Индекс товарного канала (CCI)
WHY IS OUR FXACCCURATE LS MT5 THE PROFITABLE ? PROTECT YOUR CAPITAL WITH RISK MANAGEMENT Gives entry, stop and target levels from time to time. It finds Trading opportunities by analyzing what the price is doing during established trends. POWERFUL INDICATOR FOR A RELIABLE STRATEGIES We have made these indicators with a lot of years of hard work. It is made at a very advanced level. Established trends provide dozens of trading opportunities, but most trend indicators completely ignore them!
Индикатор Supply Demand использует предыдущее ценовое действие для выявления потенциального дисбаланса между покупателями и продавцами. Ключевым является определение зон с лучшими возможностями, а не просто вероятностей. Индикатор Blahtech Supply Demand обеспечивает функционал, не доступный ни в одной платформе. Этот индикатор 4 в 1 не только выделяет зоны с более высокой вероятностью на основе механизма оценки силы по множественным критериям, но также комбинирует его с мульти-таймфреймовым ана
FX Volume MT5
Daniel Stein
4.93 (14)
Получайте ежедневную информацию о рынке с подробностями и скриншотами в нашем утреннем брифинге здесь, на mql5 , и в Telegram ! FX Volume - это ПЕРВЫЙ и ЕДИНСТВЕННЫЙ индикатор объема, который дает РЕАЛЬНОЕ представление о настроении рынка с точки зрения брокера. Он дает потрясающее представление о том, как институциональные участники рынка, такие как брокеры, позиционируют себя на рынке Forex, гораздо быстрее, чем отчеты COT. Видеть эту информацию прямо на своем графике - это настоящий геймчей
TPA True Price Action indicator reveals the true price action of the market makers through 100% non-repainting signals strictly at the close of a candle! TPA shows entries and re-entries, every time the bulls are definitely stronger than the bears and vice versa. Not to confuse with red/green candles. The shift of power gets confirmed at the earliest stage and is ONE exit strategy of several. There are available now two free parts of the TPA User Guide for our customers. The first "The Basics"
Этот индикатор является уникальным, качественным и доступным инструментом для торговли, включающим в себя наши собственные разработки и новую формулу. В обновленной версии появилась возможность отображать зоны двух таймфреймов. Это означает, что вам будут доступны зоны не только на старшем ТФ, а сразу с двух таймфреймов - таймфрейма графика и старшего: отображение вложенных зон. Обновление обязательно понравится всем трейдерам, торгующим по зонам спроса и предложения. Важная информация Для мак
Устали от построения линий поддержки и сопротивления? Сопротивление поддержки - это мульти-таймфреймовый индикатор, который автоматически обнаруживает и отображает линии поддержки и сопротивления на графике с очень интересным поворотом: поскольку ценовые уровни тестируются с течением времени и его важность возрастает, линии становятся более толстыми и темными. [ Руководство по установке | Руководство по обновлению | Устранение неполадок | FAQ | Все продукты ] Повысьте технический анализ в одноч
Это, пожалуй, самый полный индикатор автоматического распознавания гармонического ценообразования, который вы можете найти для платформы MetaTrader. Он обнаруживает 19 различных паттернов, воспринимает проекции Фибоначчи так же серьезно, как и вы, отображает зону потенциального разворота (PRZ) и находит подходящие уровни стоп-лосс и тейк-профит. [ Руководство по установке | Руководство по обновлению | Устранение неполадок | FAQ | Все продукты ] Он обнаруживает 19 различных гармонических цен
note: this indicator is for METATRADER4, if you want the version for METATRADER5 this is the link:  https://www.mql5.com/it/market/product/108106 TRENDMAESTRO ver 2.4 TRENDMAESTRO recognizes a new TREND in the bud, he never makes mistakes. The certainty of identifying a new TREND is priceless. DESCRIPTION TRENDMAESTRO identifies a new TREND in the bud, this indicator examines the volatility, volumes and momentum to identify the moment in which there is an explosion of one or more of these data a
Noize Absorption Index - is the manual trading system that measures the difference of pressure between bears forces and bulls forces. Green line - is a noize free index that showing curent situation. Zero value of index shows totally choppy/flat market.Values above zero level shows how powerfull bullish wave is and values below zero measures bearish forces.Up arrow appears on bearish market when it's ready to reverse, dn arrow appears on weak bullish market, as a result of reverse expectation.
MetaForecast M5
Vahidreza Heidar Gholami
5 (2)
MetaForecast предсказывает и визуализирует будущее любого рынка на основе гармонии в данных о ценах. Хотя рынок не всегда предсказуем, если существует узнаваемый паттерн в ценах, то MetaForecast способен предсказать будущее с наибольшей точностью. По сравнению с другими аналогичными продуктами, MetaForecast способен генерировать более точные результаты, анализируя тренды на рынке. Входные параметры Past size (Размер прошлых данных) Указывает количество баров, которые MetaForecast использует дл
Gold Trend – хороший биржевой технический индикатор. Алгоритм индикатора анализирует движение цены актива и отражает волатильность и потенциальные зоны для входа. Самые лучшие сигналы индикатора: Для SELL = красная гистограмма + красный указатель SHORT + желтая сигнальная стрелка в этом же направлении. Для BUY = синяя гистограмма + синий указатель LONG + аква сигнальная стрелка в этом же направлении.   Преимущества индикатора: И ндикатора выдает сигналы с высокой точностью. Подтвержденный сигн
Gold ATR   MTF – это прекрасный биржевой технический индикатор.  Алгоритм индикатора ATR (Average True Range) анализирует движение цены актива и отражает волатильность отрисовкой соответствующих уровней в заданных процентах (%) от цены открытия заданного таймфрейма (D1). Указатели (красный и/или синий D1 H4) направления движения цены символа и сигналы стрелок являются дополнительным и существенным помощником для комфортной и профитной внутридневной торговли и/или скальпинга. Ежедневная прибыль м
Golden Spikes Detector Acknowledgement and Dedications:  The name of this indicator was Inspired by an Original; Mr Grant Koopman; a Knowledgeable and experienced Synthetics trader. I dedicate this indicator to Mr Grant.  Overview: The Golden Spikes Premium is a groundbreaking trading indicator meticulously crafted for the Boom and Crash indices on the Deriv market. Tailored to meet the needs of discerning traders, this powerful tool operates exclusively on the one-minute timeframe, providin
IVISTscalp5
Vadym Zhukovskyi
5 (5)
Что нового в индикаторе прогнозов iVISTscalp5 (Версия 10)? iVISTscalp5 – это авторская система прогнозов для любого финансового инструмента на неделю вперед (для быстрого скальпинга по уровням времени). iVISTscalp5 – инструмент для простого изучения и понимания финансового рынка. 1)     Индикатор прогнозов iVISTscalp5 полностью переписан на другой язык программирования ( C ++), что ускорило загрузку и обработку данных. Разное графическое отображение прогнозов на графике будет еще проще для п
Линии тренда являются наиболее важным инструментом технического анализа в торговле на рынке Форекс. К сожалению, большинство трейдеров рисуют их неправильно. Индикатор Automated Trendlines — это профессиональный инструмент для серьезных трейдеров, который поможет вам визуализировать трендовое движение рынков. Есть два типа линий тренда: бычьи линии тренда и медвежьи линии тренда. В восходящем тренде линия тренда Форекс проводится через самые низкие точки колебания ценового движения. Сое
Профиль Рынка (Market Profile) определяет ряд типов дней, которые помогают трейдеру распознать поведение рынка. Ключевая особенность - это область значений (Value Area), представляющая диапазон ценового действия, в котором произошло 70% торговли. Понимание области значений может помочь трейдерам вникнуть в направление рынка и установить торговлю с более высокими шансами на успех. Это отличное дополнение к любой системе, которую вы возможно используете. Blahtech Limited представляет сообществу Me
Order Block Hunter MT5
Noha Mohamed Fathy Younes Badr
5 (1)
Order block hunter indicator is the best indicator for  hunt the order blocks that area where there has been a large concentration of limit orders waiting to be executed Order blocks are identified on a chart by observing previous price action and looking for areas where the price experienced significant movement or sudden changes in direction .This indicator does that for you by using very complicated codes and helps you to take the best areas To buy and sell because it make marks at the best a
CONGESTION BREAKOUT PRO This indicator scans the breakout of congestion zones . This indicator unlike any other congestion indicator you will find in the market right now,  it uses an advanced algorithm not peculiar to most traditional congestion indicators available today . The advanced algorithm used to define the congestions  is greatly responsible for the high rate real congestion zones and low rate fake congestion zones spotted by this product. UNDERSTANDING CONGESTION Congestion are
Другие продукты этого автора
The Scalping Project EA follows a scalping breakout strategy. It trades the breakouts from relative highs and lows. For the entry stop orders are used for the fastest possible execution. Profits can be secured by the adjustable trailing stop. Since the strategy works with small average profits it is highly suggested to trade with a low spread and commission broker. Trading costs are crucial here! The backtests shown in the screenshots were done with the default settings. There might be better or
ONLY 3 COPIES OUT OF 10 LEFT AT $299! After that, the price will be raised to $349. IMPORTANT! Contact me immediately after the purchase to get instructions and a bonus! Advanced Fibo levels is a trading robot for the trading on forex. This is a Fibonacci system that designed to trade for most popular Fibonacci strategy that's completely automated. Warning: I only sell EA's through MQL5.com. If someone contacts you saying it is me trying to sell you something, they are a Scammer. Block and rep
Fit line supports to extrapolation next movement of market, support for buy/sell decision. Indicator using spline algorithm to extrapolation.  You can change number of spline with parameter "PointsNumber" and number of extrapolation point with "ExtrapolateBars". Eextrapolation points will be save into csv format, with prefix in parameter "PointsPrefix", and store in folder File of Data Folder.
Фильтр:
Нет отзывов
Ответ на отзыв