• Обзор
  • Отзывы
  • Обсуждение

KT Double Top Bottom MT5

The double top bottom pattern is arguably one of the technical analysis's most popular chart patterns. These patterns are used to capitalize on recurring patterns and identify trend reversal patterns, thereby creating well-placed entry and exit levels.

The KT Double Top Bottom is based on these patterns and fine-tunes the trade signal development process for traders.

Features

  • It's based on one of the most reliable trading patterns and brings some fine-tuning and automation to the process.
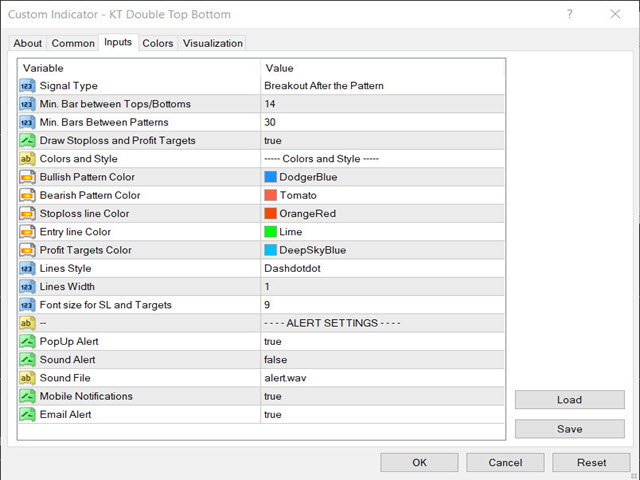
  • Also features input line customizations to allow traders to extract the desired results.
  • It can be used across all time frames and all financial markets.
  • It can be combined with other indicators and trading strategies to yield better results.

The Double Top Pattern

The double top pattern is a bearish pattern and highlights a sell signal. It shows that the price of an asset has rebounded twice but remains unable to sustain a bullish trend.

The double-top pattern almost always confirms a rapid price reversal drop in the making and is easy to identify.

This pattern has an “M” shape with two peaks and a “neckline” indicating a breakout. However, the M shape is not always perfect; a sighting of the double peaks is what matters.

To trade using the double-top pattern, launch a sell trade the instant the price move breaks below the pattern's neckline or begins on a pullback.

Only do this after the double peak has been confirmed and a protective stop-loss has been established.

The Double Bottom Pattern

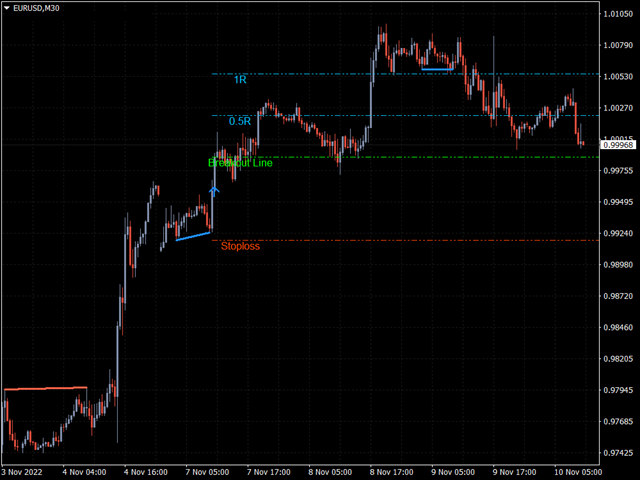
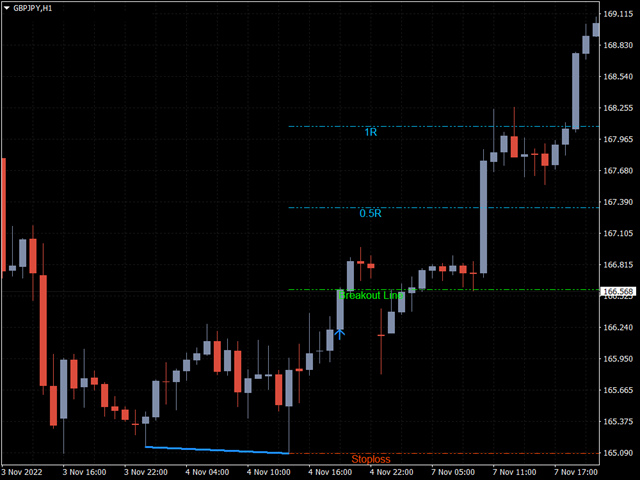
The double bottom is the opposite of the double top, indicating a bullish trading opportunity. It shows that the price has fallen to a particular mark on two occasions but has refused to break below it.

This pattern can be seen to take the “W” shape, with two bottoms and a neckline.

Once a double bottom is identified, it is almost certain that the underlying instrument's price will record a notable surge. Traders can execute a long position on confirmation of the pattern (breaking the neckline) and plot a stop-loss.

Рекомендуем также
KT Renko Patterns MT5
KEENBASE SOFTWARE SOLUTIONS
KT Renko Patterns scans the Renko chart brick by brick to find some famous chart patterns that are frequently used by traders across the various financial markets. Compared to the time-based charts, patterns based trading is easier and more evident on Renko charts due to their uncluttered appearance. KT Renko Patterns features multiple Renko patterns, and many of these patterns are extensively explained in the book titled Profitable Trading with Renko Charts by Prashant Shah. A 100% automate
Introducing the Consecutive Green/Red Candle Alert Indicator for MT5 - Your Trend Spotting Companion! Are you ready to take your trading to the next level? We present the Consecutive Green/Red Candle Alert Indicator, a powerful tool designed to help you spot trends and potential reversals with ease. Whether you're a new trader looking for clarity in the market or an experienced pro seeking additional confirmation, this indicator is your trusted companion. Key Features of the Consecutive Gre
The best time to trade Using this Indicator is when the time reach exactly hour,half,45 minutes,15 minutes and sometimes 5 minutes.. This indicators is helpful to those who trade boom and crash indecies.How to read this indicator first you'll see Blue allow and Red allow all these allows used to indicate or to detect the spike which will happen so the allow happens soon before the spike happen.This indicator works properly only in boom and crash trading thing which you have to consider when
Noize Absorption Index - is the manual trading system that measures the difference of pressure between bears forces and bulls forces. Green line - is a noize free index that showing curent situation. Zero value of index shows totally choppy/flat market.Values above zero level shows how powerfull bullish wave is and values below zero measures bearish forces.Up arrow appears on bearish market when it's ready to reverse, dn arrow appears on weak bullish market, as a result of reverse expectation.
Ловец трендов: Стратегия Ловец трендов с индикатором оповещения - это универсальный инструмент технического анализа, который помогает трейдерам определять рыночные тренды и потенциальные точки входа и выхода. Он представляет собой динамичную стратегию Ловец трендов, адаптирующуюся к рыночным условиям для четкого визуального представления направления тренда. Трейдеры могут настраивать параметры в соответствии со своими предпочтениями и уровнем риска. Индикатор помогает в идентификации тренда,
FREE
The Penta-O is a 6-point retracement harmonacci pattern which usually precedes big market movements. Penta-O patterns can expand and repaint quite a bit. To make things easier this indicator implements a twist: it waits for a donchian breakout in the right direction before signaling the trade. The end result is an otherwise repainting indicator with a very reliable trading signal. The donchian breakout period is entered as an input. [ Installation Guide | Update Guide | Troubleshooting | FAQ | A
FREE
Профиль Рынка (Market Profile) определяет ряд типов дней, которые помогают трейдеру распознать поведение рынка. Ключевая особенность - это область значений (Value Area), представляющая диапазон ценового действия, в котором произошло 70% торговли. Понимание области значений может помочь трейдерам вникнуть в направление рынка и установить торговлю с более высокими шансами на успех. Это отличное дополнение к любой системе, которую вы возможно используете. Blahtech Limited представляет сообществу Me
There are no limits! Golden Limit is the ultimate indicator to get clear and easy readings of price movements on charts. It projects support and resistance ranges, calculated by statistical models involving Price Action and the Fibonacci sequence, revealing in advance the behavior of prices and the best places to trade and not to trade. It also has two moving averages to help choose the best entries. The Golden Limit method was created from a proven model. In summary: We use the names of preci
The new update makes this indicator a complete tool for studying, analyzing and operating probabilistic patterns. It includes: On-chart Multi-asset percentage monitor. Configurable martingales. Twenty-one pre-configured patterns, including Mhi patterns and C3. An advanced pattern editor to store up to 5 custom patterns. Backtest mode to test results with loss reports. Trend filter. Hit operational filter. Martingale Cycles option. Various types of strategies and alerts. Confluence between patter
Premium level - это уникальный индикатор с точностью правильных прогнозов  более 80%!  Данный индикатор тестировался более двух месяцев лучшими Специалистами в области Трейдинга!  Индикатор авторский такого вы больше не где не найдете!  По скриншотах можете сами увидеть точностью данного инструмента!  1 отлично подходит для торговли бинарными опционами со временем экспирации на 1 свечу. 2 работает на всех валютных парах, акциях, сырье, криптовалютах Инструкция: Как только появляется красная стре
Free automatic Fibonacci is an indicator that automatically plots a Fibonacci retracement based on the number of bars you select on the BarsToScan setting in the indicator. The Fibonacci is automatically updated in real time as new highest and lowest values appears amongst the selected bars. You can select which level values to be displayed in the indicator settings. You can also select the color of the levels thus enabling the trader to be able to attach the indicator several times with differe
FREE
Awesome Oscillator Билла Уильямса с возможностью тонкой настройки и замены алгоритмов усреднения индикатора, что значительно расширяет возможности применения этого осциллятора в алгоритмическом трейдинге и приближает его по своим свойствам к такому индикатору, как MACD. Для уменьшения ценовых шумов итоговый индикатор обработан дополнительным усреднением Smooth.  Индикатор имеет возможность подавать алерты, отправлять почтовые сообщения и push-сигналы при смене направления движения осциллятора и
Добро пожаловать в индикатор распознавания Ultimate Harmonic Patterns Этот индикатор обнаруживает паттерн Гартли, паттерн Летучая мышь и паттерн Сайфер на основе HH и LL ценовой структуры и уровней Фибоначчи, и когда определенные уровни Фибоначчи встречаются, индикатор показывает паттерн на графике, Этот индикатор представляет собой комбинацию трех других моих индикаторов, которые обнаруживают сложные паттерны. Функции : Усовершенствованный алгоритм обнаружения паттерна с высокой точностью. Обна
Индикатор автоматически рассчитывает и строит уровни поддержки и сопротивления Фибоначчи - один из самых эффективных инструментов для анализа рынка. Для расчёта используются усреднённые ценовые данные по выбранному периоду и таймфрейму. В качестве начала и окончания движения взят минимум и максимум за этот период. Уровни Фибоначчи позволяют увидеть потенциальные ориентиры, около которых движение цены может замедлиться или развернуться, то есть используются для прогнозирования дальнейшего движени
To download MT4 version please click here . This is the exact conversion from TradingView: "WaveTrend [LazyBear]" By "zeusuk3". One of the coolest indicators out there to detect overbought and oversold zones. It can be used as a part of more complicated strategy and for confirming a potential trade setup. There are buffers to use in EAs also. The indicator is loaded light and non-repaint. - You can message in private chat for further changes you need. Thanks for downloading 
Best SAR MT5
Ashkan Hazegh Nikrou
5 (1)
Описание :  мы рады представить наш новый бесплатный индикатор, основанный на одном из профессиональных и популярных индикаторов на рынке форекс (PSAR), этот индикатор является новой модификацией оригинального индикатора Parabolic SAR, в индикаторе pro SAR вы можете видеть пересечение между точками и графиком цены, это пересечение не является сигналом, а говорит о возможности окончания движения, вы можете начать покупать с новой синей точки, и разместить стоп-лосс за один атр до первой синей
FREE
This indicator uses the metaquotes ZigZag indicator as base to plot fibonacci extension and fibonacci retracement based in the Elliot waves. A fibonacci retracement will be plotted on every wave draw by the ZigZag. A fibonacci extension will be plotted only after the 2nd wave. Both fibonacci will be updated over the same wave tendency. Supporting until 9 consecutive elliot waves. Parameters: Depth: How much the algorithm will iterate to find the lowest and highest candles Deviation: Amoun
The trend is your friend! Look at the color of the indicator and trade on that direction. It does not  repaint. After each candle is closed, that's the color of the trend. You can focus on shorter faster trends or major trends, just test what's most suitable for the symbol and timeframe you trade. Simply change the "Length" parameter and the indicator will automatically adapt. You can also change the color, thickness and style of the lines. Download and give it a try! There are big movements
In MetaTrader, plotting multiple   horizontal lines   and then tracking their respective price levels can be a hassle. This indicator automatically plots multiple horizontal lines at equal intervals for setting price alerts, plotting support and resistance levels, and other manual purposes. This indicator is suitable for Forex traders who are new and looking for chances to make quick profits from buying and selling. Horizontal lines can help traders find possible areas to start trading when the
No Demand No Supply MT5
Trade The Volume Waves Single Member P.C.
No Demand No Supply   This indicator identifies   No Demand –No Supply candles  to your chart and plots volume bars colored according to the signal. It can be applied to all timeframes or to a specific one only. It can also be used as regular volume indicator  with exceptional future of WEIGHTED VOLUME. Furthermore is has an alert notification, sound and email when a signals occurs. The indicator does not repaint but the alert will come on two candles back due to the definition of No Demand No S
Система для визуализации популярных шаблонов ценовых формаций. После подключения индикатор автоматически отобразит на графике следующие формации: Пиноккио бар (“пинбар”)   - свеча с небольшим телом и длинным “носом”, очень известный разворотный шаблон; Внутренний бар   - свеча, диапазон которой лежит внутри диапазона предыдущей свечи. Такая формация представляет неопределённость рынка; Внешний бар   - свеча, диапазон которой превышает диапазон предыдущей свечи. Такая формация представляет неопре
МТФ-индикатор уровней поддержки и сопротивления, построенных на экстремумах индикаторов Advanced ZigZag Dynamic и/или Extended Fractals с отключаемым ценовым значением в виде меток. Для режима МТФ можно выбрать все более старшие ТФ. По умолчанию уровни строятся на основе точек индикатора "Зигзаг", можно также использовать для построения точки индикатора Фракталов совместно с Зигзагом или вместо него. Для упрощения работы и экономии процессорного времени расчёт происходит один раз на каждом баре
For a trader, trend is our friend. This is a trend indicator for MT5, can be used on any symbol. just load it to the terminal and you will see the current trend. green color means bullish trend and red means bearlish trend. you can also change the color by yourself when the indicator is loaded to the MT5 terminal the symbol and period is get from the terminal automaticly. How to use: I use this trend indicator on 2 terminals with different period  for the same symbol at same time. for example M5
Индикатор кумулятивной дельты Как считает большинство трейдеров, цена движется под давление рыночных покупок или продаж. Когда кто-то выкупает стоящий в стакане оффер, то сделка проходит как "покупка". Если же кто-то наливает в стоящий в стакане бид - сделка идет с направлением "продажа". Дельта - это разница между покупками и продажами. А кумулятивная дельта - разница между покупками и продажами накопленным итогом за определенный период времени. Она позволяет видеть, кто в настоящий момент конт
KT Pin Bar MT5
KEENBASE SOFTWARE SOLUTIONS
KT Pin Bar identifies the pin bar formation which is a type of price action pattern which depicts a sign of reversal or rejection of the trend. When combined with support and resistance, BRN and other significant levels, Pin Bar pattern proved to be a very strong sign of reversal. Basically, a pin bar is characterized by a small body relative to the bar length which is closed either in upper or lower 50% part of its length. They have very large wicks and small candle body. A pin bar candlest
Усовершенствованная Мультитаймфреймовая версия скользящей средней Хала (Hull Moving Average - HMA). Особенности Две линии индикатора Халла разных таймфреймов на одном графике. Линия HMA старшего таймфрейма определяет тренд, а линия HMA текущего таймфрейма - краткосрочные ценовые движения. Графическая панель с данными индикатора HMA на всех таймфреймах одновременно. Если на каком-либо таймфрейме HMA переключил свое направление, на панели отображается вопросительный или восклицательный знак с тек
Value Chart Candlesticks
Flavio Javier Jarabeck
4.67 (9)
The idea of a Value Chart indicator was presented in the very good book I read back in 2020 , " Dynamic Trading Indicators: Winning with Value Charts and Price Action Profile ", from the authors Mark Helweg and David Stendahl. The idea is simple and the result is pure genius: Present candlestick Price analysis in a detrended way! HOW TO READ THIS INDICATOR Look for Overbought and Oversold levels. Of course, you will need to test the settings a lot to find the "correct" one for your approach.
FREE
SuperTrend MT5
KEENBASE SOFTWARE SOLUTIONS
KT SuperTrend is a modified version of the classic SuperTrend indicator with new useful features. Whether its Equities, Futures, and Forex, the beginners' traders widely use the Supertrend indicator.  Buy Signal: When price close above the supertrend line. Sell Signal: When price close below the supertrend line. Features A multi-featured SuperTrend coded from scratch. Equipped with a multi-timeframe scanner. The last signal direction and entry price showed on the chart. All kinds of MetaTra
Market Profile MetaTrader System  — is a classic Market Profile implementation that can show the price density over time, outlining the most important price levels, value area, and control value of a given trading session. This indicator can be attached to timeframes between M1 and D1 and will show the Market Profile for daily, weekly, monthly, or even intraday sessions. Lower timeframes offer higher precision. Higher timeframes are recommended for better visibility. It is also possible to use a
Please backtest with the exact balance of your live account before applying to real money. ==> If account balance is too low it may not trade at all! For MT4 version please contact via private message. martingale version is available here . Strategy description - Detect trend based on EMA18-EMA50-SMA200 alignment in three time frames: M15, H1, H4 - Trade in trend direction and exit when above alignment is broken. - The bot is tuned to trade XAUUSD(Gold). - The bot output is break even in rangi
FREE
С этим продуктом покупают
Прежде всего стоит подчеркнуть, что эта торговая система является индикатором без перерисовки, без повторной отрисовки и без задержки, что делает ее идеальной как для ручной, так и для роботизированной торговли. «Smart Trend Trading System MT5» - это комплексное торговое решение, созданное для новичков и опытных трейдеров. Он объединяет более 10 премиальных индикаторов и предлагает более 7 надежных торговых стратегий, что делает его универсальным выбором для разнообразных рыночных условий. Стр
Прежде всего стоит подчеркнуть, что этот торговый индикатор не перерисовывается, не перерисовывает и не отставает, что делает его идеальным как для ручной, так и для роботизированной торговли. Атомный аналитик - это индикатор ценового действия PA, который использует силу и импульс цены, чтобы найти лучший край на рынке. Оборудованный расширенными фильтрами, которые помогают убирать шумы и ложные сигналы, и повышают торговый потенциал. Используя несколько слоев сложных индикаторов, Атомный анали
Представляем       Индикатор Quantum Trend Sniper   , инновационный индикатор MQL5, который меняет способ определения разворотов тренда и торговли ими! Разработан командой опытных трейдеров со стажем торговли более 13 лет,       Снайперский индикатор Quantum Trend       разработан, чтобы вывести ваше торговое путешествие на новые высоты благодаря инновационному способу определения разворотов тренда с чрезвычайно высокой точностью. ***Купите индикатор Quantum Trend Sniper и получите индикатор
FX Volume MT5
Daniel Stein
4.94 (17)
Получайте ежедневную информацию о рынке с подробностями и скриншотами в нашем утреннем брифинге здесь, на mql5 , и в Telegram ! FX Volume - это ПЕРВЫЙ и ЕДИНСТВЕННЫЙ индикатор объема, который дает РЕАЛЬНОЕ представление о настроении рынка с точки зрения брокера. Он дает потрясающее представление о том, как институциональные участники рынка, такие как брокеры, позиционируют себя на рынке Forex, гораздо быстрее, чем отчеты COT. Видеть эту информацию прямо на своем графике - это настоящий геймчей
Раскройте силу торговли трендами с помощью индикатора Trend Screener: вашего идеального решения для торговли трендами, основанного на нечеткой логике и мультивалютной системе! Повысьте уровень своей торговли по тренду с помощью Trend Screener, революционного индикатора тренда, основанного на нечеткой логике. Это мощный индикатор отслеживания тренда, который сочетает в себе более 13 инструментов и функций премиум-класса и 3 торговые стратегии, что делает его универсальным выбором для превращения
Прежде всего стоит подчеркнуть, что этот Торговый Инструмент является Неперерисовывающимся Нерепейнтинговым Индикатором, что делает его идеальным для профессиональной торговли. Индикатор Концепций Умного Действия Цены - очень мощный инструмент как для новичков, так и для опытных трейдеров. Он объединяет более 20 полезных индикаторов в одном, комбинируя передовые торговые идеи, такие как анализ Inner Circle Trader и стратегии торговли концепциями умных денег. Этот индикатор сосредотачивается н
Получайте ежедневную информацию о рынке с подробностями и скриншотами через наш утренний брифинг здесь, на mql5 , и в Telegram ! FX Power MT5 NG - это новое поколение нашего популярного измерителя силы валют FX Power. Что же предлагает этот измеритель силы нового поколения? Все, что вы любили в оригинальном FX Power ПЛЮС Анализ силы GOLD/XAU Еще более точные результаты расчетов Индивидуально настраиваемые периоды анализа Настраиваемый предел расчета для еще более высокой производительности Спец
Этот индикатор является уникальным, качественным и доступным инструментом для торговли, включающим в себя наши собственные разработки и новую формулу. В обновленной версии появилась возможность отображать зоны двух таймфреймов. Это означает, что вам будут доступны зоны не только на старшем ТФ, а сразу с двух таймфреймов - таймфрейма графика и старшего: отображение вложенных зон. Обновление обязательно понравится всем трейдерам, торгующим по зонам спроса и предложения. Важная информация Для мак
Сейчас 147 долл. США (увеличиваясь до 499 долл. США после нескольких обновлений) - неограниченные учетные записи (ПК или Mac) Руководство пользователя + Обучающие видео + Доступ к приватному Discord-каналу + VIP-статус и мобильная версия + Лицензия на 5 ПК с неограниченным количеством аккаунтов и терминалов MT4. Сколько раз вы покупали индикатор торговли с замечательными обратными тестами, доказательствами производительности на живых счетах и зашикарными цифрами и статистикой, но после испо
Step into the realm of Forex trading with confidence and precision using XQ, a cutting-edge Forex indicator designed to elevate your trading game to unprecedented heights. Whether you're a seasoned trader or just stepping into the world of currency exchange, XQ Forex Indicator empowers you with the insights and signals needed to make informed trading decisions. The signal conditions are a combination of three indicators, and XQ Forex Indicator only display  medium and long-term trends . The ind
The Volume by Price Indicator for MetaTrader 5 features Volume Profile and Market Profile TPO (Time Price Opportunity). Get valuable insights out of currencies, equities and commodities data. Gain an edge trading financial markets. Volume and TPO histogram bar and line charts. Volume Footprint charts. TPO letter and block marker charts including split structures. Versatile segmentation and compositing methods. Static, dynamic and flexible ranges with relative and/or absolute visualizations. Lay
Auto Order Block with break of structure based on ICT and Smart Money Concepts Futures Break of Structure ( BoS )             Order block ( OB )            Higher time frame Order block / Point of Interest ( POI )    shown on current chart           Fair value Gap ( FVG ) / Imbalance   ,  MTF      ( Multi Time Frame )    Volume Imbalance     ,  MTF          vIMB Gap’s Equal High / Low’s     ,  MTF             EQH / EQL Liquidity               Current Day High / Low           HOD /
Топовый индикатор МТ5, дающий сигналы для входа в сделки без перерисовки! Идеальные точки входа в сделки для  валют, крипты, металлов, акций, индексов !  Смотрите  видео  (6:22) с примером отработки всего одного сигнала, окупившего индикатор. Версия индикатора для MT4 Преимущества индикатора Сигналы на вход без перерисовки Если сигнал появился, он никуда НЕ исчезает! В отличие от индикаторов с перерисовкой, которые ведут к потере депозита, потому что могут показать сигнал, а потом убрать его.
ICT, SMC, SMART MONEY CONCEPTS, SMART MONEY, Smart Money Concept, Support and Resistance, Trend Analysis, Price Action, Market Structure, Order Blocks, BOS/CHoCH,   Breaker Blocks ,  Momentum Shift,   Supply&Demand Zone/Order Blocks , Strong Imbalance,   HH/LL/HL/LH,    Fair Value Gap, FVG,  Premium  &   Discount   Zones, Fibonacci Retracement, OTE, Buy Side Liquidity, Sell Side Liquidity, BSL/SSL Taken, Equal Highs & Lows, MTF Dashboard, Multiple Time Frame, BigBar, HTF OB, HTF Market Structure
Станьте Breaker Trader и получайте прибыль от изменений структуры рынка по мере изменения цены. Индикатор выключателя блока ордеров определяет, когда тренд или движение цены приближаются к истощению и готовы развернуться. Он предупреждает вас об изменениях в структуре рынка, которые обычно происходят, когда произойдет разворот или серьезный откат. Индикатор использует собственный расчет, который определяет прорывы и ценовой импульс. Каждый раз, когда новый максимум формируется около возможн
Индикатор Supply Demand использует предыдущее ценовое действие для выявления потенциального дисбаланса между покупателями и продавцами. Ключевым является определение зон с лучшими возможностями, а не просто вероятностей. Индикатор Blahtech Supply Demand обеспечивает функционал, не доступный ни в одной платформе. Этот индикатор 4 в 1 не только выделяет зоны с более высокой вероятностью на основе механизма оценки силы по множественным критериям, но также комбинирует его с мульти-таймфреймовым ана
Индикатор Gann Squares представляет собой мощный инструмент для анализа рынка, основанный на математических концепциях, представленных W.D. Gann в его статье "Математическая формула для прогнозирования рынка." Этот индикатор включает в себя техники Ганна, связанные с квадратными числами, такими как 144, 90 и 52, а также Квадрат 9. Кроме того, он включает метод по использованию Квадрата 9 в сочетании с каналами и паттерном звезды. Руководство пользователя и использование: Перед использованием это
Индикатор Trend Line Map является дополнением к индикатору Trend Screener Indicator. Он работает как сканер всех сигналов, генерируемых скринером тренда (сигналы линии тренда). Это сканер линий тренда на основе индикатора Trend Screener. Если у вас нет индикатора Trend Screener Pro, программа Trend Line Map Pro работать не будет. It's a Trend Line Scanner based on Trend Screener Indicator. If you don't have Trend Screener Pro Indicator,     the Trend Line Map Pro will not work . Зайдя в н
TrendLine PRO MT5
Evgenii Aksenov
4.78 (49)
Индикатор   Trend Line PRO   является самостоятельной торговой стратегией. Он показывает смену тренда, точку входа в сделку, а так же автоматически рассчитывает три уровня Take Profit и защиту от потери Stop Loss Trend Line PRO   идеально подходит для всех символов Meta Trader:  валют, металлов, криптовалют, акций и индексов   Преимущества Trend Line PRO: Никогда не перерисовывает свои сигналы Возможность использования  как самостоятельную стратегию Имеет три автоматических уровня Take Profi
Представляем       Quantum Breakout PRO   , новаторский индикатор MQL5, который меняет ваш способ торговли в зонах прорыва! Разработан командой опытных трейдеров со стажем торговли более 13 лет,       Квантовый прорыв PRO       разработан, чтобы поднять ваше торговое путешествие к новым высотам с его инновационной и динамичной стратегией зоны прорыва. Quantum Breakout Indicator покажет вам сигнальные стрелки на зонах прорыва с 5 целевыми зонами прибыли и предложением стоп-лосса на основе по
Версия MT4   |   FAQ Индикатор Owl Smart Levels – это полноценная торговая система внутри одного индикатора, которая включает в себя такие популярные инструменты анализа рынка как усовершенствованные фракталы Билла Вильямса , Valable ZigZag, который строит правильную волновую структуру рынка, а также  уровни Фибоначчи, которые   отмечают точные уровни входа в рынок и места взятия прибыли. Подробное описание стратегии Инструкция по работе с индикатором Советник-помошник в торговле Owl Helper При
AW Trend Predictor MT5
AW Trading Software Limited
4.76 (54)
Сочетание тренда и пробоя уровней в одной системе. Продвинутый алгоритм индикатора фильтрует рыночный шум, определяет тренд, точки входа, а также возможные уровни выхода из позиции. Сигналы индикатора записываются в статистический модуль, который позволяет выбирать наиболее подходящие инструменты, показывая эффективность истории сигналов. Индикатор рассчитывает отметки ТейкПрофитов и стоплосса. Руководство пользователя ->  ЗДЕСЬ  / MT4 версия ->  ЗДЕСЬ Как торговать с индикатором: Торговля с Tr
Gartley Hunter Multi - Индикатор для поиска гармонических моделей одовременно на десятках торговых инструментов и на всех классических ценовых диапазонах: (m1, m5, m15, m30, H1, H4, D1, Wk, Mn). Инструкция/Мануал ( Обязательно читайте перед приобретением ) | Версия для МТ4 Преимущества 1. Паттерны: Гартли, Бабочка, Акула, Краб. Летучая мышь, Альтернативная летучая мышь, Глубокий краб, Cypher 2. Одновременный поиск паттернов на десятках торговых инструментов и на всех классических таймфреймах
TPSpro TRENDPRO   —  трендовый индикатор, который автоматически анализирует рынок и предоставляет информацию о тренде и каждой его смене а также дающий сигналы для входа в сделки без перерисовки! Индикатор использует каждую свечу, анализируя их отдельно. относя к разным импульсам – импульс вверх или вниз. Точные точки входа в сделки  для  валют, крипты, металлов, акций, индексов! -  Version MT4                ПОЛНОЕ ОПИСАНИЕ          /        СЕТАПЫ ДЛЯ ТОРГОВЛИ                        Рекоменд
Golden Spikes Detector This indicator is based on an advanced strategy primarily for trading spikes on Boom and Crash Indices. Complex algorithms were implemented to detect high probability entries only. It alerts on potential Buy and Sell entries. To trade spikes on the Deriv or Binary broker, only take Buy Boom and Sell Cash alerts. It was optimised to be loaded on 5-minute timeframe although multiple timeframe analysis is done in the background. Features ·             Desktop pop up and sound
Matrix Arrow Indicator MT5
Juvenille Emperor Limited
5 (14)
Индикатор Matrix Arrow MT5   — это уникальный индикатор тренда 10 в 1, следующий за   100% неперерисовывающимся   индикатором с несколькими таймфреймами, который можно использовать на всех символах/инструментах:   форекс ,  товары ,   криптовалюты ,   индексы ,  акции . Индикатор Matrix Arrow MT5  будет определять текущую тенденцию на ранних этапах, собирая информацию и данные от до 10 стандартных индикаторов, а именно: Индекс среднего направленного движения (ADX) Индекс товарного канала (CCI)
IX Power , наконец, предлагает непревзойденную точность FX Power для нефорексных символов. Он точно определяет интенсивность краткосрочных, среднесрочных и долгосрочных трендов в ваших любимых индексах, акциях, товарах, ETF и даже криптовалютах. Вы можете   анализировать все, что   может предложить ваш терминал. Попробуйте и почувствуйте, как   значительно улучшается ваш тайминг   при торговле. Ключевые особенности IX Power 100% точные результаты расчетов без перерисовки - для всех торгов
Account Graph MT5
Kyra Nickaline Watson-gordon
5 (1)
An indicator to draw a graph of account current and historical state such as Balance, Equity, Margin, Free Margin, Margin Level, Drawdown, Account Profit, Deposit and Withdrawals. Indicator Inputs : Draw Balance Graph Draw Equity Graph Draw Margin Graph Draw Free Margin Graph Draw Margin Level Graph Draw Drawdown Graph Draw Account Profit Graph Hide Data on Chart and Buffers Connect Gaps by Lines Sign of DDs on Profit Sign of DDs on Loss Tips : The Indicator will draw historical balance gra
** All Symbols x All Timeframes scan just by pressing scanner button ** ***Contact me after purchase to send you instructions and add you in "123 scanner group" for sharing or seeing experiences with other users. After 15 years of experience in the markets and 3 years of programming, Winner indicator is ready. I would like to share with you! Introduction The 123 Pattern Scanner indicator with a special enhanced algorithm is a very repetitive common pattern finder with a high success rate . Inte
Это четкий индикатор для оценки максимумов и минимумов, и он хорошо работает для колеблющегося рынка. Акционная цена 49$ → 59$ функции хорошо оценивает верх и низ Без перерисовки, без дрейфа Быстрый расчет, без задержек Богатый режим напоминания Можно настроить несколько параметров и цветов параметр "======== Главная ========" HighLowPeriod1 = 9 HighLowPeriod2 = 60 HighLowPeriod3 = 34 HighLowEMAPeriod = 4 MASignalPeriod = 5 "======== Уведомить ========" UseAlertNotify = истина; UseMetaQuo
Другие продукты этого автора
If you trade Forex, having detailed information about the currency strength and currency pairs correlation can take your trading to new heights. The correlation will help to cut your risk in half, and strength analysis will help to maximize the profits. This indicator provides a hybrid approach for selecting the most appropriate currency pairs using the strength analysis and currency pairs correlation. How to use the Currency Strength Analysis Suppose your trading strategy provides a buying o
KT Trend Magic MT5
KEENBASE SOFTWARE SOLUTIONS
KT Trend Magic shows the trend depiction on chart using the combination of market momentum and volatility. A smoothing coefficient is used to smooth out the noise from the signal.It can be used to find out the new entries or confirm the trades produced by other EA or indicator. Features Drag n drop MTF scanner which scans for the new signals across multiple time-frames. Find new entries in the trend direction. Improve the accuracy of other indicators when used in conjunction. Can be used as a
ACB Breakout Arrows
KEENBASE SOFTWARE SOLUTIONS
4.17 (35)
The ACB Breakout Arrows indicator provides a crucial entry signal in the market by detecting a special breakout pattern. The indicator constantly scans the chart for a settling momentum in one direction and provide the accurate entry signal right before the major move.  Get multi-symbol and multi-timeframe scanner from here - Scanner for ACB Breakout Arrows MT4 Key features Stoploss and Take Profit levels are provided by the indicator. Comes with a MTF Scanner dashboard which tracks the brea
If you trade Forex, having detailed information about the currency strength and currency pairs correlation can take your trading to new heights. The correlation will help to cut your risk in half, and strength analysis will help to maximize the profits. This indicator provides a hybrid approach for selecting the most appropriate currency pairs using the strength analysis and currency pairs correlation. How to use the Currency Strength Analysis Suppose your trading strategy provides a buying o
ACB Breakout Arrows MT5
KEENBASE SOFTWARE SOLUTIONS
5 (1)
Индикатор ACB Breakout Arrows формирует важные сигналы на вход в рынок, определяя специальные паттерны пробоя. Индикатор постоянно сканирует график, ожидая появления импульса в одном направлении, и генерирует точный сигнал входа прямо перед большим движением. Основные возможности: Не перерисовывается! Показывает уровни стоп-лосс и тейк-профит. Подходит для внутридневых трейдеров, свинг-трейдеров и скальперов. Оптимизированный алгоритм для повышения точности сигналов. Предварительно рассчитыва
KT Asian Breakout MT5
KEENBASE SOFTWARE SOLUTIONS
KT Asian Breakout carefully analyzes the range-bound market during the Asian session and then fires a long or short trade after doing some preassessment based on its inbuilt technical analysis module. The executed orders are closed within a day before the completion of the next day session. The inbuilt technical analysis module checks for the session range and compares it with the last 20 days price movement. If it finds any erratic price movement within the session, the orders are not execute
KT RSI Divergence robot is a 100% automated expert advisor that trades regular and hidden divergence built between the price and Relative Strength Index (RSI) oscillator. The divergence signals are fetched from our freely available RSI divergence indicator. Not every divergence ends up in a successful price reversal, that's why this ea combines the raw divergences signals with its inbuilt technical analysis module to exploit the price inefficiency that occurs after some selected divergence si
KT Ichimoku Trader MT5
KEENBASE SOFTWARE SOLUTIONS
1 (1)
KT Ichimoku Trader is a fully automated expert advisor that offers five popular trading strategies based on the Ichimoku indicator. Each strategy has it's own entry and exit method without any interference to other strategies. The Ichimoku system can be applied to all major currency pairs and metals. However, we found that it performs reasonably well mainly on two pairs.   MT4 Version is available here  https://www.mql5.com/en/market/product/35041 Features Trade up to 5 famous trading strate
KT Auto Fibo MT5
KEENBASE SOFTWARE SOLUTIONS
5 (1)
KT Auto Fibo draws Fibonacci retracement levels based on the ongoing trend direction. The Highs and Lows are automatically selected using the Maximum and Minimum points available on the chart. You can zoom in/out and scroll to adjust the Fibonacci levels accordingly. Modes Auto:  It draws the Fibonacci levels automatically based on the chart area. Manual:  It draws the Fibonacci levels only one time. After that, you can change the anchor points manually. Usage: Helps to predict the future p
KT Heiken Ashi Smoothed is a smoothed version of the standard Heiken Ashi. Moreover, it also plots buy/sell arrows on a trend change. A buy arrow is plotted when it change to a bullish state from bearish state. A sell arrow is plotted when it change to a bearish state from bullish state. Mobile notifications, Email, Sound and Pop-up alerts included. What exactly is Heiken Ashi Smoothed? It filters out the false signals and noise in the standard Heiken Ashi. It applies the set of two moving a
KT Trend Magic
KEENBASE SOFTWARE SOLUTIONS
KT Trend Magic shows the trend depiction on chart using the combination of market momentum and volatility. A smoothing coefficient is used to smooth out the noise from the signal.It can be used to find out the new entries or confirm the trades produced by other EA/Indicators. Usage Drag n drop MTF scanner which scans for the new signals across multiple time-frames. Find new entries in the trend direction. Improve the accuracy of other indicators when used in conjunction. Can be used as a dyna
Divergence is one of the vital signals that depicts the upcoming price reversal in the market. KT Stoch Divergence shows the regular and hidden divergences build between the price and stochastic oscillator. Limitations of KT Stoch Divergence Using the Stochastic divergence as a standalone entry signal can be risky. Every divergence can't be interpreted as a strong reversal signal. For better results, try to combine it with price action and trend direction. Features Marks regular and hidde
KT CCI Divergence MT5
KEENBASE SOFTWARE SOLUTIONS
KT CCI Divergence shows the regular and hidden divergence created between the price and CCI oscillator. Divergence is one of the vital signals that depicts the upcoming price reversal in the market. Manually spotting the divergence between price and CCI can be a hectic and ambiguous task. Limitations of KT CCI Divergence   Using the CCI divergence as a standalone entry signal can be risky. Every divergence can't be interpreted as a strong reversal signal. For better results, try to combine it
ACB Trade Filter MT4
KEENBASE SOFTWARE SOLUTIONS
5 (2)
Индикатор ACB Trade Filter отфильтровывает маловероятные торговые сигналы в торговой стратегии. Продукт использует сложный алгоритм фильтрации на основе рыночных настроений и трендов. Заявки Хорошо сочетается с другим нашим индикатором ACB Breakout Arrows . Отфильтровывает маловероятные сигналы любого индикатора. Избегает слишком частых сделок и минимизирует убытки. Торгует в направлении рыночных настроений. Хорошо справляется с волатильностью. Инструкция по применению Покупайте, если гистог
KT Momentum Arrows
KEENBASE SOFTWARE SOLUTIONS
KT Momentum Arrows Indicator is based on a momentary breakout which is calculated using the bands deviation and emerging volatility in a certain direction. A buy signal is generated when the price close above the upper band and a sell signal is generated when the price close below the lower band. A magnitude coefficient is used as the input which affects the band deviation and volatility at the same time. The coefficient value should be carefully selected and analyzed based on the instrument and
KT COG Advanced MT4
KEENBASE SOFTWARE SOLUTIONS
1 (1)
KT COG is an advanced implementation of the center of gravity indicator presented by John F. Ehlers in the May 2002 edition of Technical Analysis of Stocks & Commodities magazine. It's a leading indicator which can be used to identify the potential reversal points with the minimum lag. The COG oscillator catches the price swings quite effectively. MT5 version of the same indicator is available here KT COG Advanced MT5 Calculation of COG The COG indicator is consist of the two lines. The mai
KT Pin Bar
KEENBASE SOFTWARE SOLUTIONS
KT Pin Bar identifies the pin bar formation which is a type of price action pattern which depicts a sign of reversal or rejection of the trend. When combined with support and resistance, BRN and other significant levels, Pin Bar pattern proved to be a very strong sign of reversal. Basically, a pin bar is characterized by a small body relative to the bar length which is closed either in upper or lower 50% part of its length. They have very large wicks and small candle body. A pin bar candlest
KT Auto Fibo
KEENBASE SOFTWARE SOLUTIONS
KT Auto Fibo draws Fibonacci retracement levels based on the ongoing trend direction. The Highs and Lows are automatically selected using the Maximum and Minimum points available on the chart. You can zoom in/out and scroll to adjust the Fibonacci levels accordingly. Modes Auto:  It draws the Fibonacci levels automatically based on the chart area. Manual: It draws the Fibonacci levels only one time. After that, you can change the anchor points manually. Usage: Helps to predict the future pr
KT Psar Arrows
KEENBASE SOFTWARE SOLUTIONS
KT Psar Arrows plots the arrows on chart using the standard Parabolic SAR indicator. A bullish arrow is plotted when the candle's high touch the SAR. A bearish arrow is plotted when the candle's low touch the SAR. The signals are generated in the real-time without waiting for the bar close.  Features A beneficial tool for traders who want to experiment with the trading strategies that include the use of Parabolic Sar indicator.  Can be used to find turning points in the market. Use custom PSA
KT Ichimoku Trader
KEENBASE SOFTWARE SOLUTIONS
1 (1)
KT Ichimoku Trader is a fully automated expert advisor that offers five popular trading strategies based on the Ichimoku indicator. Each strategy has it's own entry and exit method without any interference to other strategies. The Ichimoku system can be applied to all major currency pairs and metals. However, we found that it performs reasonably well mainly on two pairs.   MT5 Version is available here  https://www.mql5.com/en/market/product/35043 Features Trade up to 5 famous trading strate
KT Volatility oscillator analyze the past and current market data with a mathematical formula to display the result in a form of an oscillator. The growing and deteriorating waves are equivalent to high and low volatility in the asset.  In a nutshell, volatility is simply a measurement of the price fluctuation of an asset over a certain period of time. Without volatility, there would not much movement in the market and traders would not be able to profit from the price movements. Use of Volati
KT COG Robot
KEENBASE SOFTWARE SOLUTIONS
KT COG Robot is a fully automated Expert Advisor based on the KT COG Indicator . The COG indicator was originally presented by John F. Ehlers in the May 2002 edition of Technical Analysis of Stocks & Commodities magazine. The EA fires a long trade when COG line cross above the signal line and a short trade is fired when the COG line cross below the signal line.  Adaptive Filtration Our adaptive filtration algorithm combines the original COG formula with the major trend direction and market ac
ACB Breakout Arrows EA
KEENBASE SOFTWARE SOLUTIONS
This is a 100% automated expert advisor based on our custom indicator named "ACB Breakout Arrows" . The entries are based on a breakout pattern that constantly occurs in a bi-directional manner. The intensity of entry signals can be manipulated using the external input called "Signal Sensitivity". MT5 Version is available here  https://www.mql5.com/en/market/product/35785 Trades Confirmation ACB Breakout Arrows EA provides an ability to filter the entries using our another custom indicator n
KT Asian Breakout
KEENBASE SOFTWARE SOLUTIONS
4 (1)
KT Asian Breakout carefully analyzes the range-bound market during the Asian session and then fires a long or short trade after doing some preassessment based on its inbuilt technical analysis module. The executed orders are closed within a day before the completion of the next day session. The inbuilt technical analysis module checks for the session range and compares it with the last 20 days price movement. If it finds any erratic price movement within the session, the orders are not execute
KT London Breakout
KEENBASE SOFTWARE SOLUTIONS
First thirty minutes are essential for a trading session. The early reaction of traders and market players sets a path for the rest of the day. KT London Breakout EA takes advantage of this phenomenon, and after analyzing the first thirty minutes of London session, it places two bidirectional pending orders. One of pending order is eventually canceled after realizing the market direction with certainty. It has been strictly tested and developed for EUR/JPY using 30-Min Time Frame. You can ex
Use of support and resistance in systematic trading is very subjective. Every trader has their own idea and way to plotting the support and resistance levels on the chart. KT Support and Resistance indicator take out this ambiguity out of the situation and automatically draws support and resistance levels following an algorithmic approach using a unique multi-timeframe analysis. When launched on the chart, It immediately scan the most significant extreme points across all the available timefr
MACD Divergence Seeker
KEENBASE SOFTWARE SOLUTIONS
KT MACD Divergence Seeker trades the regular and hidden divergence signals generated by our free indicator named KT MACD Divergence indicator. Trading the standalone divergences can be a risky affair that's why the KT MACD Divergence Seeker combines the standard divergence signals with an advanced analysis module to exploit the price inefficiencies on some FX pairs. What is the Divergence exactly? As a general conception if the price is making higher highs, then macd should also be making
KT Asian Breakout indicator scans and analyzes a critical part of the Asian session to generate bi-directional buy and sell signals with the direction of a price breakout. A buy signal occurs when the price breaks above the session high, and a sell signal occurs when the price breaks below the session low. MT5 Version is available here https://www.mql5.com/en/market/product/41704 Things to remember If the session box is vertically too wide, a new trade should be avoided as most of the price
MACD Divergence MT4
KEENBASE SOFTWARE SOLUTIONS
KT MACD Divergence shows the regular and hidden divergences build between the price and oscillator. If your trading strategy anticipates the trend reversal, you can include the MACD regular divergence to speculate the potential turning points. And if your trading strategy based on the trend continuation, MACD hidden divergence would be a good fit. Limitations of KT MACD Divergence Using the macd divergence as a standalone entry signal can be a risky affair. Every divergence can't be interpr
KT Bollinger Bands Trader is a 100% automated expert advisor that's incorporated a mean reversion trading strategy using the Bollinger bands during the period of low volatility. Price often reacts at the upper or lower line of Bollinger bands, but a reversal not always occurs. However, there is more chance of price reversal during the time of low volatility. Entries A buy trade is activated when price correctly aligns below the bottom line of Bollinger bands. A sell trade is activated when pri
Фильтр:
Нет отзывов
Ответ на отзыв