My Trendline
- Индикаторы
- Ashok Kumar Singha
- Версия: 1.0
- Активации: 5
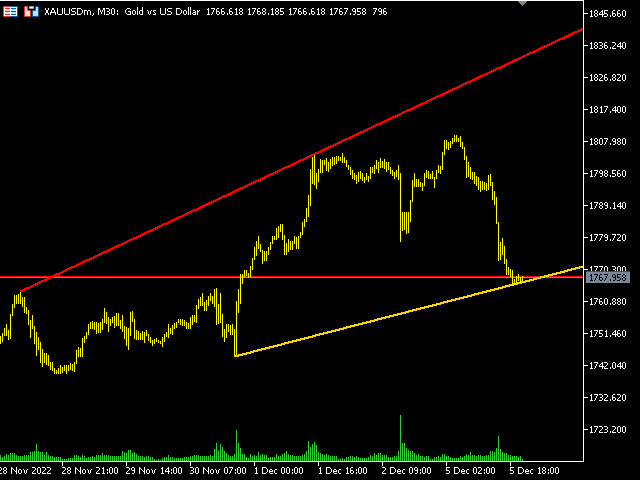
My Trendline
is an Indicator based on Upper and Lower Trendline which will Plot Automatically into the Chart. This Indicator will perfectly indicate you the Trend of the Market.
It can be use in any Time Frame. The Indicator will automatically adjust according to the Current Time Frame.
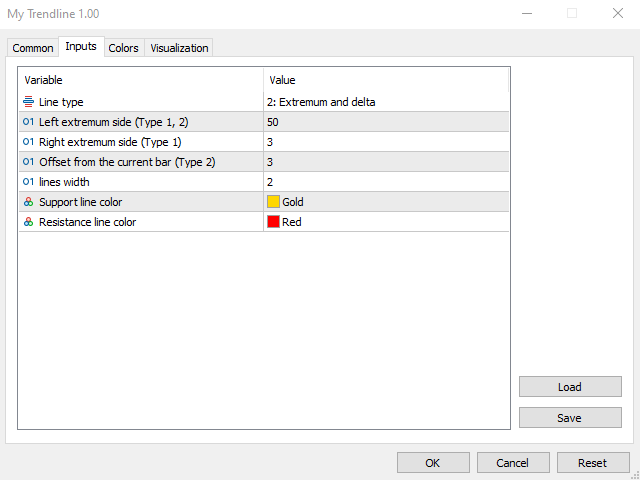
Steps to Setup the Indicator:
✪ Install the Custom Indicator;
✪ Set all the Inputs, Line Color, Width and Styles etc. (Can use the Default Setting also);
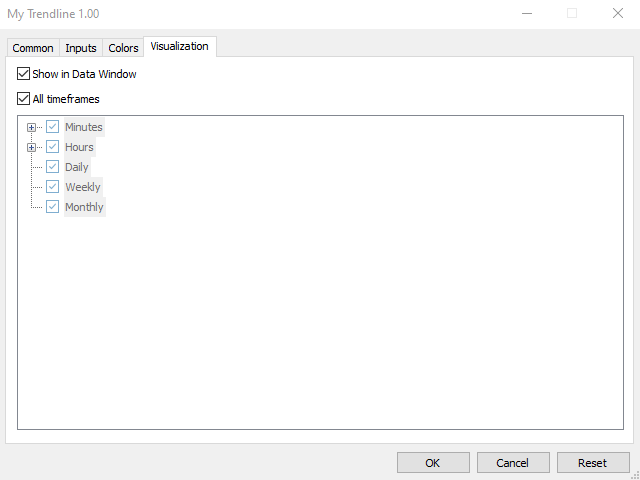
✪ Set visualization to All Timeframe; and
DONE👍
It can be used for:
- All Pairs: Forex, Cryptocurrencies, Metals, Stocks, Indices.
- All Timeframe
- All Brokers
- All type of Trading Style like Scalping, Swing, Intraday, Short-Term, Long-Term etc.
- Multiple Chart
--->>!! MT4 version will Launch very shortly !!<<---
-->> For any Type of Support, Guidance, Setup Issue, EA Optimization, Input Setup etc. etc. can Contact me..
Support Group--->> https://www.mql5.com/en/messages/030709F84DE2D801