• Обзор
  • Отзывы (2)
  • Обсуждение
  • Что нового

MP Inside Bar

5
An “inside bar” pattern is a two-bar price action trading strategy in which the inside bar is smaller and within the high to low range of the prior bar, i.e. the high is lower than the previous bar’s high, and the low is higher than the previous bar’s low. Its relative position can be at the top, the middle or the bottom of the prior bar.

The prior bar, the bar before the inside bar, is often referred to as the “mother bar”. You will sometimes see an inside bar referred to as an “ib” and its mother bar referred to as an “mb”.

Some traders use a more lenient definition of an inside bar that allows for the highs of the inside bar and the mother bar to be equal, or for the lows of both bars to be equal. However, if you have two bars with the same high and low, it’s generally not considered an inside bar by most traders.

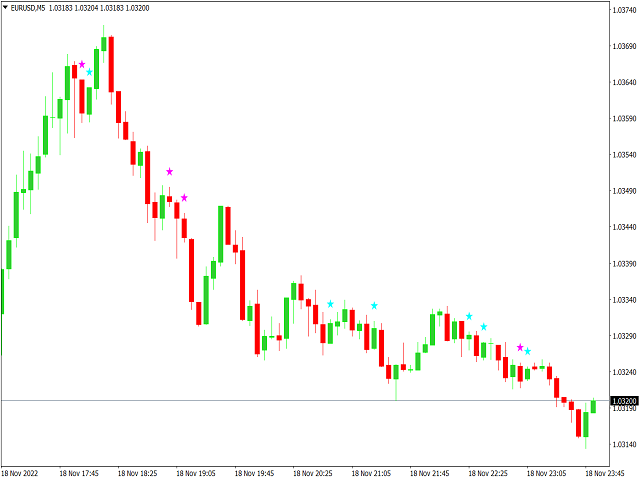
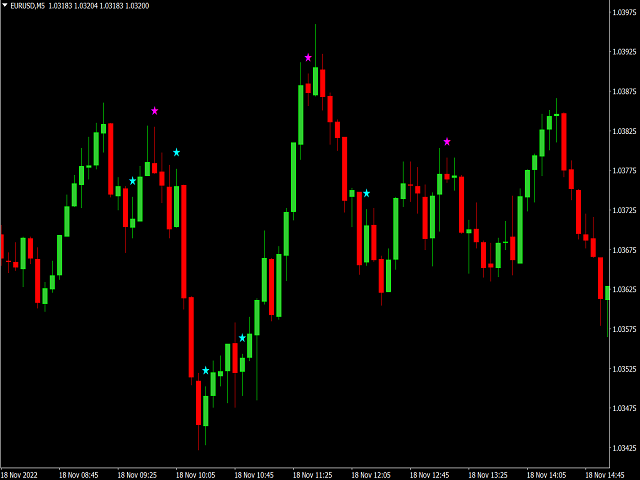
Inside bars show a period of consolidation in a market. A daily chart inside bar will look like a ‘triangle’ on a 1 hour or 30 minute chart time frame. They often form following a strong move in a market, as it ‘pauses’ to consolidate before making its next move. However, they can also form at market turning points and act as reversal signals from key support or resistance levels.

#Tags: Inside Bar, InsideBar, Inside-Bar, Inside Bar Pattern, InsideBar Pattern, Inside-Bar Pattern, Price Action, PriceAction

___________________________________________________________________________________

Disclaimer:
Do NOT trade or invest based upon the analysis presented on this channel. Always do your own research and due diligence before investing or trading. I’ll never tell you what to do with your capital, trades or investments. I’ll also never recommend for you to buy, sell, long or short any asset, commodity, security, derivative or cryptocurrency related instrument as it's extremely HIGH RISK! You should always consult with a professional/licensed financial adviser before trading or investing in any type of assets.

Отзывы 2
zainshah94
100
zainshah94 2023.09.10 18:33 
 

Very nice and good indicator with out any lack and repaint.

DTE81183
64
DTE81183 2023.06.20 10:06 
 

Great indicator, thank you for allowing the use of it. When combined with exhaustion & order block indicators, it is very accurate in finding turning points.

Рекомендуем также
Harami Indi
Che Jeib Che Said
5 (1)
Harami is a two candle pattern with recent candle formed inside the previous candle's high and low . It represents indecision in the market and is used for breakout price action trading strategy.  This indi fires all signals to a dashboard on the chart including pop_up alert, push to phone notification and email. Harami has two types, bullish and bearish pattern. Enter long for bullish Harami and enter short for bearish Harami. Inputs : Currency Symbols: EURUSD,GBPJPY,USDJPY,USDCAD (default) , u
FREE
Market Structure Zig Zag
Lesedi Oliver Seilane
4.77 (22)
Free Market structure zig zag to assist in price action trading the screenshots describe how to use and how to spot patterns new version comes with alerts, email alert and  push notification alert can be used on all pairs  can be used on all timeframes  you can add additional confirmation indicators the indicator shows you your higher high and low highs as well as your lower lows and lower highs  the indication makes price action analysis easier to spot.
FREE
Данный индикатор создан для поиска предполагаемых разворотных точек цены символа. В его работе используется небольшой разворотный свечной паттерн в совокупности с фильтром экстремумов. Индикатор не перерисовывается! В случае отключения фильтра экстремумов, индикатор показывает все точки, в которых есть паттерн. В случае включения фильтра экстремумов, работает условие – если в истории на Previous bars 1 свечей назад, были более высокие свечки и они дальше чем свеча Previous bars 2 – то тогда тако
FREE
The indicator allows you to trade binary options. The recommended time frame is М1 and the expiration time is 1 minutes. The indicator suitable for auto and manual trading. A possible signal is specified as a arrows above/under a candle. You should wait until the candle closes! Arrows are not re-painted Trade sessions: London and New York section Currency pairs: AUD/CAD Working time frame: M1 Expiration time: 1 minute The indicator also shows good results when using the martingale strategy - "Ma
FREE
Индикатор сканирует до 30 торговых инструментов и до 8 таймфреймов на наличие высоковероятностных моделей паттерна Двойная вершина/дно с ложными прорывами . Концепция индикатора Ultimate Double Top/Bottom и профессиональный способ его применения подробно описаны в блоге (на английском языке): Professional Trading With Double Tops/Bottoms And Divergences! Эта бесплатная версия работает только на EURUSD и GBPUSD. Полная версия индикатора доступна по ссылке: Ultimate Double Top Bottom Reversal Scan
FREE
Candle size oscillator is an easy to use tool to figure out candle size from highest to lowest price of each candle. It's a powerful tool for price action analysts specifically for those who works intraday charts and also a perfect tool for short term swing traders. Kindly note that you can also edit the Bullish and Bearish candles with different colors. #Tags: Candle size, oscillator, price action, price range, high to low, candle ticks _________________________________________________________
FREE
In FX, signals from doji patterns can be effective in capturing potential trend developments. Therefore, setting pending orders simultaneously after the appearance of a doji can make it easier to capture the onset of a trend. Setting stop-loss (SL) and take-profit (TP) levels more widely can enhance the probability of success, but it also increases the associated risk. In the event of a loss, it is possible to recover by increasing the next position size through multi-lot trading, but this
FREE
Основное назначение: "Pin Bars" предназначен для автоматического обнаружения пин-баров на графиках финансовых рынках. Пин-бар – это свеча с характерным телом и длинным хвостом, которая может сигнализировать о развороте тренда или коррекции. Принцип работы: Индикатор анализирует каждую свечу на графике, определяя размер тела, хвоста и носа свечи. При обнаружении пин-бара, соответствующего заранее определенным параметрам, индикатор отмечает его на графике стрелкой вверх или вниз, в зависимости от
FREE
Данный индикатор определяет паттерны Sandwich Bars по нескольким диапазонам, весьма надежные паттерны пробоя. Просто и эффективен в использовании Настраиваемые диапазоны баров Настраиваемый выбор цвета В индикаторе предусмотрены визуальные/почтовые/push/звуковые уведомления. Индикатор не перерисовывается и не рисует на истории Паттерн Sandwich состоит из одного бара, поглощающего несколько прошедших баров, пробивая и отклоняя весь ценовой диапазон. Синяя рамка - бычий пробой Красная рамка - медв
FREE
Индикатор для скальпинга. Учитывает волатильность, движение цены на локальном промежутке, направление текущего тренда. Рекомендуется таймфрейм - М5. Преимущества: Низкая волатильность при появлении сигнала обеспечивает минимальное движение против открытой позиции. Индикатор не перерисовывает свои сигналы. Есть оповещения сигналов. Это отличный инструмент для внутридневной торговли. Подпишись на мой telegram канал,   ссылка в контактах   моего профиля . Настройки: Наименование Описание Period П
FREE
Индикатор ищет зоны покупки и продажи, где можно открыть сделку с минимальным стоп-лоссом и лучшим соотношением риск/прибыль (Risk Reward Ratio). В основе индикатора - качественный поиск паттерна Двойная вершина/Двойное дно. Эта версия работает только на паре USDCAD! Полностью рабочую версию индикатора можно купить здесь - https://www.mql5.com/ru/market/product/29820 Принцип работы индикатора Ищет локальные вершинки/низинки, которые потенциально смогут стать Разворотной зоной Ожидает импульсно
FREE
Ska ZigZag Line
NKATEKO VUKOSI LEROY MASANGO
Ska ZigZag Line indicator determines the overbought and oversold regions within a trend. The indicator determines the overbought region by the candlestick high and the oversold region by the candlestick low in a form of a line. To utilize the full strategy i recommend using "Ska ZigZag Line" together with "Ska ZigZag BuySell". NOTE: This indicator is a line based indicator. HOW TO USE: Sell Signal; Place a sell trade when the Ska ZigZag BuySell indicator arrow appear on top of the Ska ZigZag Lin
FREE
The indicator allows you to trade binary options. The recommended time frame is М1 and the expiration time is 1 minute. The indicator suitable for auto and manual trading. A possible signal is specified as a arrows above/under a candle. You should wait until the candle closes! Arrows are not re-painted Trade sessions: LONDON and NEWYORK section Currency pairs: GRB/USD Working time frame: M1 Expiration time: 1 minute. The indicator also shows good results when using the martingale strategy - "Mar
FREE
Канал фрактальной дивергенции базируется на паттернах фрактальной дивергенции , представляя их в виде канала, границы которого изменяются в момент появления очередного паттерна. Верхняя граница канала соответствует верхней части последнего найденного медвежьего паттерна фрактальной дивергенции. Нижняя граница канала - это нижняя часть последнего найденного бычьего паттерна (см. скриншот 1). По отношению к индикатору FractalDivergence_Patterns , канальная версия обладает теми же параметрами, к ко
FREE
Этот советник не совершает никаких сделок, но он сканирует все символы в ваших обзорах рынка и сканирует каждую акцию одну за другой в разных таймфреймах, и в конце он показывает вам, какой символ в каком таймфрейме имеет мощную поглощающую свечу. Кроме того, вы можете определить период MA и верхний и нижний пределы RSI, и он показывает вам, какие символы, на каком таймфрейме, будут пересекать скорректированную скользящую среднюю, и какой символ, на каком таймфрейме, будет пересекать верхний или
FREE
Модифицированный индикатор фракталов. Работает как оригинальный индикатор Билла Вильямса, но с возможностью изменять радиус вершины, а не работать только со стандартным радиусом в 2 бара. Если рассказывать простыми словами, то индикатор проверяет вершину и если она минимальна/максимальна в указанном радиусе, то он помечает ее соответствующей стрелкой. Преимущества Возможность изменять радиус. Использовать для построения линий поддержки и сопротивления. Использовать для построения трендовых канал
FREE
Ska ZigZag BuySell
NKATEKO VUKOSI LEROY MASANGO
Ska ZigZag BuySell indicator determines the overbought and oversold regions within a trend. The indicator determines the overbought region by the candlestick high and the oversold region by the candlestick low. This indicator only gives signals with arrow and audible alerts each and every time when a new candlestick appear. To utilize the full strategy i recommend using "Ska ZigZag BuySell" together with "Ska ZigZag Line". The Ska ZigZag Line indicator is available for free. NOTE: Indicator is h
The  RSI Basket Currency Strenght  brings the RSI indicator to a new level.  Expanding the boundaries of TimeFrames and mono-currency analysis, the RSI Multi Time Frame Currency Strenght take the movements of each currency that composes the cross and confront them in the whole basket of 7 crosses.  The indicator works with any combination of  AUD, CAD, CHF, EUR, GBP, JPY, NZD, USD  pairs and with full automation takes in account every RSI value for the selected Time Frame.  After that, the indic
FREE
Индикатор для визуализации временных диапазонов ключевых торговых сессий: Азиатской, Европейской и Американской. Индикатор обладает функционалом настройки времени начала и окончания каждой торговой сессии, а также устанавливаемой временной зоны торгового сервера. Основные преимущества индикатора включают возможность работы с минимальной загрузкой процессора и экономии оперативной памяти. Кроме того, предоставляется опция указания количества отображаемых исторических дней,   обеспечивая пользоват
FREE
Engulfing candlestick patterns are   comprised of two bars on a price chart. They are used to indicate a market reversal. The second candlestick will be much larger than the first, so that it completely covers or 'engulfs' the length of the previous bar. By combining this with the ability to look at trend direction this indicator eliminates a lot of false signals that are normally generated if no overall trend is taken into consideration
FREE
Introduction and Description The indicator displays an arrow whenever a " Bearish Engulfing " is detected. The latter usually indicates the beginning of a downward trend. A bearish engulfing pattern is a technical chart pattern that signals lower prices to come. The pattern consists of an up candlestick followed by a large down candlestick that eclipses or "engulfs" the smaller up candle. The pattern can be important because it shows sellers have overtaken the buyers and are pushing the price m
FREE
White Crow Indicator by VArmadA A simple yet powerful  candle analysis based indicator using the White Soldiers & Crow patterns. Works with timeframes 1H and higher and tested on all major pairs. Pay attention to the signal: An arrow indicating a long or short entry. How It Works: Arrows indicate a ongoing trend. After multiple bullish or bearish candles in a row the chances for another candle towards that trend is higher. Instructions: - Crow Count: Set the number of candles that n
FREE
Engulf Detector
Amirhossein Ghasemi Moroodi
После 7 лет я решил бесплатно поделиться некоторыми своими индикаторами и экспертами. Если они вам понравятся, пожалуйста,   Поддержите 5-звездочным рейтингом! Ваш отзыв поможет продолжать выпускать бесплатные инструменты! Смотрите другие мои бесплатные инструменты и мои живые сигналы здесь   здесь _________________________________ Детектор Поглощения - Упрощенный Индикатор Трейдинга Откройте для себя Детектор Поглощения, простой инструмент, созданный на MQL4 для идентификации мо
FREE
MegaTrends
Sivakumar Subbaiya
1 (1)
Megatrends  Indicator   Time Frame: Suitable for any time frame.  Purpose: Trend Prediction. Blue and red color indicate the buy and sell call respectively. Buy: When the blue line is originating it is opened buy call. Sell: When the Red line is origination it is opened sell call Happy trade!! this indicator is suitable for all time frame, but our recommended time frame to use 1hour and 4 hours, suitable for any chart.
FREE
Fibo Alert
Che Jeib Che Said
4.5 (4)
FIBO ALERT https://www.mql5.com/en/market/product/34921 This indicator draws a fibonacci retracement (high and low) of a candle. It alerts  and notifies  the user whenever price touches or crosses the fibonacci levels. INPUTS ON Alert: set to true will alert pop up  whenever price crosses levels at chart time frame. ON Push: set to true will send push notification to phone whenever price crosses levels at chart time frame. ===== FIBO (High & Low) ===== Time Frame: indicator draws fibonacci lev
FREE
This indicator accurately identifies and informs market reversals and continuation patterns by analyzing and signaling the Three White Soldiers / Three Black Crows pattern. User-friendly interface and multi-asset compatibility Fully customizable parameters and colors Does not repaint Can be easily convert its signals into an Expert Advisor. Full support granted. FOR MT4 FULL VERSION:  CLICK HERE   What is the Three White Soldiers / Three Black Crows price action pattern The Three White Soldi
FREE
Вы торгуете по гармоническим паттернам? Паттерн "Три движения" (Three Drives) представляет собой шеститочечный паттерн разворота, состоящий из серии повышающихся максимумов или понижающихся минимумов, завершающейся на уровнях Фибоначчи 127% или 161.8%. Он сигнализирует о том, что движение слабеет и высока вероятность разворота. Паттерн легко обнаруживается Позволяет изучить основы гармонических паттернов Полезен при поиске дешевых и дорогих зон Бычьи откаты отображаются синим цветом Медвежьи отк
FREE
The indicator allows you to trade binary options. The recommended time frame is М1 and the expiration time is 1 minute. The indicator suitable for auto and manual trading. A possible signal is specified as a arrows above/under a candle. You should wait until the candle closes! Arrows are not re-painted Trade sessions: TOKYO section (Half end) and LONDON section (First half) Currency pairs: EUR/USD Working time frame: M1 Expiration time: 1 minute. The indicator also shows good results when using
FREE
Artem
Artem Konkov
4 (1)
Представляю эффективный инструмент определения разворота на таймфрейме H4. Сам индикатор устанавливается на график М30. Все параметры уже установлены.                                                                                            Правильное использование индикатора: К сожалению проверка в тестере не даст правильное представление об индикаторе, поэтому аренда на один месяц максимально доступна. Не нужно устанавливать файл на удалённый сервер. Установите его в терминал на локальном ком
FREE
С этим продуктом покупают
Gann Made Easy - это профессиональная, но при этом очень простая в применении Форекс система, основанная на лучших принципах торговли по методам господина У.Д. Ганна. Индикатор дает точные BUY/SELL сигналы, включающие в себя уровни Stop Loss и Take Profit. Пожалуйста, напишите мне после покупки! Я поделюсь своими рекомендациями по использованию индикатора. Также вас ждет отличный бонусный индикатор в подарок! Вероятно вы уже не раз слышали о торговли по методам Ганна. Как правило теория Ганна от
Прежде всего стоит подчеркнуть, что этот торговый индикатор не перерисовывается, не перерисовывает и не отставает, что делает его идеальным как для ручной, так и для роботизированной торговли. Атомный аналитик - это индикатор ценового действия PA, который использует силу и импульс цены, чтобы найти лучший край на рынке. Оборудованный расширенными фильтрами, которые помогают убирать шумы и ложные сигналы, и повышают торговый потенциал. Используя несколько слоев сложных индикаторов, Атомный анали
TPSpro TRENDPRO   —  трендовый индикатор, который автоматически анализирует рынок и предоставляет информацию о тренде и каждой его смене а также дающий сигналы для входа в сделки без перерисовки! Индикатор использует каждую свечу, анализируя их отдельно. относя к разным импульсам – импульс вверх или вниз. Точные точки входа в сделки  для  валют, крипты, металлов, акций, индексов! -  Version MT5                   ПОЛНОЕ ОПИСАНИЕ          /        СЕТАПЫ ДЛЯ ТОРГОВЛИ                        Реком
Gold Stuff
Vasiliy Strukov
4.89 (250)
Gold Stuff - трендовый индикатор, разработанный специально для золота, также может использоваться на любых финансовых инструментах. Индикатор не перерисовывается и не запаздывает. Рекомендуемый тайм-фрейм H1.  По данному индикатору написан советник EA Gold Stuff, Вы можете найти его в моем профиле. Свяжитесь со мной сразу после покупки для получения   персонального бонуса! Настройки и мануал  здесь ПАРАМЕТРЫ Draw Arrow - вкл.выкл. отрисовку стрелок на графике. Alerts - вкл.выкл.звуковые оповещен
В НАСТОЯЩЕЕ ВРЕМЯ СКИДКА 26% Лучшее решение для новичка или трейдера-эксперта! Этот индикатор является уникальным, высококачественным и доступным торговым инструментом, поскольку мы включили в него ряд собственных функций и новую формулу. С помощью всего лишь ОДНОГО графика вы можете определить силу валюты для 28 пар Форекс! Представьте, как улучшится ваша торговля, потому что вы сможете точно определить точку запуска нового тренда или возможность скальпирования? Руководство пользователя:
Scalper Vault — это профессиональная торговая система, которая дает вам все необходимое для успешного скальпинга. Этот индикатор представляет собой полную торговую систему, которую могут использовать трейдеры форекс и бинарных опционов. Рекомендуемый тайм фрейм М5. Система дает точные стрелочные сигналы в направлении тренда. Она также предоставляет вам сигналы выхода и рассчитывает рыночные уровни Ганна. Индикатор дает все типы оповещений, включая PUSH-уведомления. Пожалуйста, напишите мне после
Прежде всего стоит подчеркнуть, что этот Торговый Инструмент является Неперерисовывающимся Нерепейнтинговым Индикатором, что делает его идеальным для профессиональной торговли. Индикатор Концепций Умного Действия Цены - очень мощный инструмент как для новичков, так и для опытных трейдеров. Он объединяет более 20 полезных индикаторов в одном, комбинируя передовые торговые идеи, такие как анализ Inner Circle Trader и стратегии торговли концепциями умных денег. Этот индикатор сосредотачивается н
В настоящее время скидка 20%! Лучшее решение для новичка или трейдера-эксперта! Эта приборная панель работает на 28 валютных парах. Он основан на 2 наших основных индикаторах (Advanced Currency Strength 28 и Advanced Currency Impulse). Он дает отличный обзор всего рынка Forex. Он показывает значения Advanced Currency Strength, скорость движения валюты и сигналы для 28 пар Forex на всех (9) таймфреймах. Представьте, как улучшится ваша торговля, когда вы сможете наблюдать за всем рынком с пом
Инновационный индикатор, использующий эксклюзивный алгоритм для быстрого и точного определения тренда. Индикатор автоматически рассчитывает время открытия и закрытия позиций, а также подробную статистику работы индикатора на заданном отрезке истории, что позволяет выбрать наилучший торговый инструмент для торговли. Вы также можете подключить свои пользовательские стрелочные индикаторы к Scalper Inside Pro для проверки и расчета их статистики и прибыльности. Scalper Inside PRO инструкция и настро
Важным ключевым элементом в трейдинге является зоны или уровни, от которых принимаются решения о покупке или продаже торгового инструмента. Несмотря на попытки крупных игроков скрыть свое присутствие на рынке, они неизбежно оставляют следы. Наша задача заключалась в том, чтобы научиться находить эти следы и правильно их интерпретировать. Первые Импульсные Уровни (ПИУ)     -      Reversal First Impulse levels (RFI)   -  Version MT5                INSTRUCTIONS                 RUS                 E
Представляем       Индикатор Quantum Trend Sniper   , инновационный индикатор MQL5, который меняет способ определения разворотов тренда и торговли ими! Разработан командой опытных трейдеров со стажем торговли более 13 лет,       Снайперский индикатор Quantum Trend       разработан, чтобы вывести ваше торговое путешествие на новые высоты благодаря инновационному способу определения разворотов тренда с чрезвычайно высокой точностью. ***Купите индикатор Quantum Trend Sniper и получите индикатор
Станьте Breaker Trader и получайте прибыль от изменений структуры рынка по мере изменения цены. Индикатор выключателя блока ордеров определяет, когда тренд или движение цены приближаются к истощению и готовы развернуться. Он предупреждает вас об изменениях в структуре рынка, которые обычно происходят, когда произойдет разворот или серьезный откат. Индикатор использует собственный расчет, который определяет прорывы и ценовой импульс. Каждый раз, когда новый максимум формируется около возможн
Trend Screener
STE S.S.COMPANY
4.83 (86)
Индикатор тренда, революционное уникальное решение для торговли и фильтрации тренда со всеми важными функциями тренда, встроенными в один инструмент! Это 100% неперерисовывающийся мультитаймфреймный и мультивалютный индикатор, который можно использовать на всех инструментах/инструментах: форекс, товары, криптовалюты, индексы, акции. Trend Screener - это эффективный индикатор, следующий за трендом, который выдает сигналы тренда в виде стрелок с точками на графике. Функции, доступные в индикаторе
Представляем       Quantum Breakout PRO   , новаторский индикатор MQL5, который меняет ваш способ торговли в зонах прорыва! Разработанная командой опытных трейдеров с опытом торговли более 13 лет,   Quantum Breakout PRO   предназначена для того, чтобы вывести ваше торговое путешествие на новые высоты благодаря своей инновационной и динамичной стратегии зон прорыва. Quantum Breakout Indicator покажет вам сигнальные стрелки на зонах прорыва с 5 целевыми зонами прибыли и предложением стоп-лос
Advanced Supply Demand
Bernhard Schweigert
4.92 (310)
Этот индикатор является уникальным, качественным и доступным инструментом для торговли, включающим в себя наши собственные разработки и новую формулу. В обновленной версии появилась возможность отображать зоны двух таймфреймов. Это означает, что вам будут доступны зоны не только на старшем ТФ, а сразу с двух таймфреймов - таймфрейма графика и старшего: отображение вложенных зон. Обновление обязательно понравится всем трейдерам, торгующим по зонам спроса и предложения. Важная информация Для мак
Currency Strength Wizard — очень мощный индикатор, предоставляющий вам комплексное решение для успешной торговли. Индикатор рассчитывает силу той или иной форекс-пары, используя данные всех валют на нескольких тайм фреймах. Эти данные представлены в виде простых в использовании индексов валют и линий силы валют, которые вы можете использовать, чтобы увидеть силу той или иной валюты. Все, что вам нужно, это прикрепить индикатор к графику, на котором вы хотите торговать, и индикатор покажет вам ре
Откройте для себя секрет успешной торговли форекс с нашим пользовательским индикатором MT4! Задумывались ли вы, как добиться успеха на рынке Forex, постоянно зарабатывая прибыль при минимизации риска? Вот ответ, который вы искали! Позвольте нам представить наш собственный индикатор MT4, который будет революционизировать ваш подход к торговле. Уникальная универсальность Наш индикатор специально разработан для пользователей, которые предпочитают формирования свечей Renko и Rangebar. Мы пони
Break & Retest неудержим, когда объединен с нашим другим индикатором расхождений. После покупки отправьте нам сообщение, и вы сможете получить этот второй индикатор БЕСПЛАТНО в качестве бонуса. После многих месяцев тяжелой работы и преданности мы с гордостью представляем вам наш индикатор действий цены Break and Retest, созданный с нуля. Один из самых сложных индикаторов, который мы создали, содержит более 1400 строк кода! Основная идея нашей стратегии Break and Retest заключается в том, ч
Представляем удивительный форекс-индикатор "Miraculous": раскройте силу точного трейдинга Вы устали от бесконечного поиска лучшего форекс-индикатора, который действительно доставляет исключительные результаты на всех таймфреймах? Не ищите дальше! Представляем вам форекс-индикатор "Miraculous", который пришел, чтобы изменить ваш опыт трейдинга и поднять ваши прибыли на новый уровень. Основанный на передовых технологиях и годам тщательной разработки, форекс-индикатор "Miraculous" является вершиной
Топовый индикатор МТ4, дающий сигналы для входа в сделки без перерисовки! Идеальные точки входа в сделки   для  валют, крипты, металлов, акций, индексов !  Смотрите  видео  (6:22) с примером отработки всего одного сигнала, окупившего индикатор. Версия индикатора для MT5 Преимущества индикатора Сигналы на вход без перерисовки Если сигнал появился, он никуда НЕ исчезает! В отличие от индикаторов с перерисовкой, которые ведут к потере депозита, потому что могут показать сигнал, а потом убрать его.
TrendDecoder Premium
Christophe, Pa Trouillas
5 (3)
Определите диапазоны и следующие вероятные движения   |  Получите самые ранние сигналы и силу трендов   |  Получите четкие выходы перед разворотом   |  Определите уровни Фибо, которые будет тестировать цена Индикатор без перерисовки и задержек - идеально подходит для ручной и автоматической торговли - подходит для всех активов и всех временных единиц Ограниченное предложение >>   50% OFF После покупки пожалуйста, свяжитесь с моим каналом  для получения рекомендуемых настроек Версия   МТ5 :   кли
МУЛЬТИВАЛЮТНАЯ И МНОГОТАЙМФОРМНАЯ ПОКУПКА И ПРОДАЖА. АВТОМАТИЧЕСКИЙ ТРЕЙЛИНГ-СТОП И ВОЗНАГРАЖДЕНИЕ ЗА РИСК ТЕЙКПРОФИТ! ИНДИКАТОР СКАНИЗИРУЕТ И АНАЛИЗИРУЕТ РЫНОК, ТАК ЧТО ВАМ НЕЧЕГО ДЕЛАТЬ! ТОРГУЙТЕ ВСЕМИ ВАЛЮТАМИ НА ОДНОМ ГРАФИКЕ!   После покупки оставьте комментарий, свяжитесь со мной и я пришлю вам советника по торговле. Индикатор использует несколько осцилляторов и прикрепленных к ним фильтров для поиска лучших ПОДТВЕРЖДЕННЫХ точек входа, поэтому вам не нужно об этом беспокоиться! Он п
TrendMaestro
Stefano Frisetti
5 (2)
note: this indicator is for METATRADER4, if you want the version for METATRADER5 this is the link: TRENDMAESTRO recognizes a new TREND in the bud, he never makes mistakes. The certainty of identifying a new TREND is priceless. DESCRIPTION TRENDMAESTRO identifies a new TREND in the bud, this indicator examines the volatility, volumes and momentum to identify the moment in which there is an explosion of one or more of these data and therefore the moment in which prices have strong probability of f
FX Volume
Daniel Stein
4.6 (35)
Получайте ежедневную информацию о рынке с подробностями и скриншотами в нашем утреннем брифинге здесь, на mql5 , и в Telegram ! FX Volume - это ПЕРВЫЙ и ЕДИНСТВЕННЫЙ индикатор объема, который дает РЕАЛЬНОЕ представление о настроении рынка с точки зрения брокера. Он дает потрясающее представление о том, как институциональные участники рынка, такие как брокеры, позиционируют себя на рынке Forex, гораздо быстрее, чем отчеты COT. Видеть эту информацию прямо на своем графике - это настоящий геймчей
Price Action Entry Alerts
Stephen Sanjeeve Sahayam
5 (3)
Этот индикатор проверяет каждый бар на наличие давления покупателей или продавцов и определяет 4 типа свечных паттернов с наибольшим объемом. Затем эти свечи фильтруются с помощью нескольких линейных фильтров, чтобы показать сигналы покупки или продажи. Сигналы работают лучше всего в сочетании с более высоким направлением таймфрейма и при торговле в часы больших объемов. Все фильтры настраиваются и работают независимо. Может просматривать сигналы одного направления одним нажатием кнопки. Этот и
СЕЙЧАС СКИДКА 31% !!! Лучшее решение для новичка или трейдера-эксперта! Этот индикатор является уникальным, высококачественным и доступным торговым инструментом, поскольку мы включили в него ряд собственных функций и секретную формулу. Всего на ОДНОМ графике он выдает алерты по всем 28 валютным парам. Представьте, как улучшится ваша торговля, ведь вы сможете точно определить точку запуска нового тренда или возможность скальпирования! Построенный на новых базовых алгоритмах, он позволяет е
Этот индикатор невозможно остановить в сочетании с другим нашим индикатором под названием Katana. После покупки напишите нам сообщение и вы сможете получить Katana БЕСПЛАТНО в качестве БОНУСА! Цена скоро увеличится до $149! Не пропустите это выгодное предложение за 65 долларов! Индикатор «Прогнозирование тренда» — это уникальный и простой инструмент, который позволяет прогнозировать будущее движение цен на основе сигналов, генерируемых MACD. Это поможет вам оценить области, в которых цена мож
Автоматическое построение уровней поддержки и сопротивления ПЛЮС разрывы между свечами на вашем графике, чтобы вы могли видеть, куда цена, скорее всего, направится дальше и/или потенциально может развернуться. Этот индикатор разработан для использования в рамках методики позиционной торговли, которая преподается на моем сайте (The Market Structure Trader), и отображает ключевую информацию для таргетинга и потенциальных входов. В индикаторе есть 2 основные функции и 4 дополнительные: ОСНОВНА
up-down indicator is no repaint and works all pairs and lower than weekly time frames charts. it is suitable also 1 m charts for all pairs. and hold long way to signal. dont gives too many signals. when red histogram cross trigger line that is up signal.and price probably will down when blue histogram cross trigger line that is down signal.and price probably will go up. when the signals not seen press + button on terminal . too see weekly chart because of low data on chart ,it needs to lower p
Способ применения Pair Trading Station Рекомендуется использовать Pair Trading Station на таймфрейме H1 с любой валютной парой. Чтобы получить сигналы на покупку и продажу, следуйте указанным ниже инструкциям по применению Pair Trading Station в терминале MetaTrader. При загрузке Pair Trading Station на график индикатор оценит доступные исторические данные на вашей платформе MetaTrader для каждой валютной пары. В самой начале на графике отобразятся исторические данные, доступные для каждой валют
Другие продукты этого автора
MACD (short for Moving Average Convergence/Divergence) is one of the most famous and oldest indicators ever created and is widely used among   beginners . However, there is a newer version of the MACD that is named   Impulse MACD   which have less false signals than the standard MACD. Classic MACD helps us to identify potential   trends   by displaying   crossovers   between two lines. If MACD line crosses above the Signal line it shows us that the market is potentially   up   trending and that
MACD (short for Moving Average Convergence/Divergence) is one of the most famous and oldest indicators ever created and is widely used among beginners . However, there is a newer version of the MACD that is named Impulse MACD  which have less false signals than the standard MACD. Classic MACD helps us to identify potential trends by displaying crossovers between two lines. If MACD line crosses above the Signal line it shows us that the market is potentially up trending and that it would be a go
MACD (short for   M oving   A verage   C onvergence/ D ivergence) is a popular trading indicator used in technical analysis of securities prices. It is designed to identify changes in the strength, direction, momentum, and duration of a trend in a security's price. History Gerald Appel created the MACD line in the late 1970s. Thomas Aspray added the histogram feature to Appel's  MACD in 1986. The three major components and their formula 1. The MACD line: First, "PM Colored MACD" employs two
MP Squeeze Momentum is a volatility and momentum indicator derivated of "TTM Squeeze" volatility indicator introduced by John Carter. It capitalizes on the tendency for price to break out strongly after consolidating in a tight range. Introduction: The volatility component of MP Squeeze Momentum measures price compression using Bollinger Bands and Keltner Channels. If the Bollinger Bands are completely enclosed within the Keltner Channels, that indicates a period of very low volatility. This st
FREE
This indicator is stand alone version from  MP Pivot Levels  (All in one) containing Woodie Pivots. Woodie’s pivot points are made up of multiple key levels, calculated from past price points, in order to frame trades in a simplistic manner. The key levels include the ‘pivot’ itself, and multiple support and resistance levels (usually up to three each). Traders use these levels as a guide for future price movements when setting up trades. The pivot : (Previous high + previous low + 2 x previou
FREE
MP Candle Countdown indicator with a progress bar is a tool used in technical analysis that displays the time remaining until the current candlestick on a chart closes, along with a progress bar that shows visually the amount of time that has elapsed since the candlestick opened. This indicator can be helpful for traders who use candlestick charting to make trading decisions, as it provides both a visual representation of the time left until a candlestick closes and an indication of how much ti
FREE
The purpose of using Smart money index (SMI) or smart money flow index is to find out investors sentiment. The index was constructed by Don Hays and measures the market action. The indicator is based on intra-day price patterns. The beginning of the trading day is supposed to represent the trading by retail traders. The majority of retail traders overreact at the beginning of the trading day because of the overnight news and economic data. There is also a lot of buying on market orders and shor
FREE
A pin bar pattern consists of one price bar, typically a candlestick price bar, which represents a sharp reversal and rejection of price. The pin bar reversal as it is sometimes called, is defined by a long tail, the tail is also referred to as a “shadow” or “wick”. The area between the open and close of the pin bar is called its “real body”, and pin bars generally have small real bodies in comparison to their long tails. The tail of the pin bar shows the area of price that was rejected, and
FREE
An “inside bar” pattern is a two-bar price action trading strategy in which the inside bar is smaller and within the high to low range of the prior bar, i.e. the high is lower than the previous bar’s high, and the low is higher than the previous bar’s low. Its relative position can be at the top, the middle or the bottom of the prior bar. The prior bar, the bar before the inside bar, is often referred to as the “mother bar”. You will sometimes see an inside bar referred to as an “ib” and its
FREE
A heatmap is a graphical representation of data in two dimensions, using colors to display different factors. Heatmaps are a helpful visual aid for viewers, enabling the quick dissemination of statistical or data-driven information. The MP Heatmap indicator provides a graphical representation of the relative strengths of major currencies compared to others, organizing data from pairs into color-coded results and producing a clear overview of the entire Forex market. The MP Heatmap indicator dis
FREE
This trend scanner indicator is using two main indicators to identify trends. Frist the EMAs to provide a view on Bullish / Bearish momentum. When the shorter EMA (calculated off more recent price action) crosses, or is above, the slower moving EMA (calculated off a longer period of price action), it suggests that the market is in an uptrend. Second the Stochastic RSI, When RSI is < 20 it is considered oversold, and when > 80 it is overbought. These conditions suggests that momentum is very str
FREE
Candle size oscillator is an easy to use tool to figure out candle size from highest to lowest price of each candle. It's a powerful tool for price action analysts specifically for those who works intraday charts and also a perfect tool for short term swing traders. Kindly note that you can also edit the Bullish and Bearish candles with different colors. #Tags: Candle size, oscillator, price action, price range, high to low, candle ticks _________________________________________________________
FREE
This indicator is stand alone version from  MP Pivot Levels  (All in one) containing Demark's Pivots. Calculations:     PP = X / 4     R1 = X / 2 - LOWprev     S1 = X / 2 - HIGHprev Uses: When the pair currency price may change the direction of movement. Possible constraints of support and resistance that creates plateaus for the currency pair prices. Tendency identification by comparing the present prices according to current day's pivot point and also the prior day's pivot points. ___________
FREE
This utility identifies certain candle open times on chart, this can help you to see your favorite candle open and use it as it fits in your strategy. This tool is very useful for intraday charting and indicating your sessions. ___________________________________________________________________________________ Disclaimer: Do NOT trade or invest based upon the analysis presented on this channel. Always do your own research and due diligence before investing or trading. I’ll never tell you what
FREE
The MP Andean Oscillator is used to estimate the direction and also the degree of variations of trends. It contains 3 components: Bull component, Bear component and Signal component. A rising Bull component indicates that the market is up-trending while a rising Bear component indicates the presence of down-trending market. Settings: Oscillator period: Specifies the importance of the trends degree of variations measured by the indicator. Signal line per: Moving average period of the Signal line
FREE
This indicator is stand alone version from  MP Pivot Levels  (All in one) containing Demark's Pivots. Calculations:     PP = X / 4     R1 = X / 2 - LOWprev     S1 = X / 2 - HIGHprev Uses: When the pair currency price may change the direction of movement. Possible constraints of support and resistance that creates plateaus for the currency pair prices. Tendency identification by comparing the present prices according to current day's pivot point and also the prior day's pivot points. ___________
FREE
MP Price Change Indicator is a tool to calculate the price movement by percentage. The Value of this indicator can be adjusted to look back of the percent of price change within certain timeframes. This is a powerful tool when used by other indicators as well, such as ATR and ADR, for understanding price fluctuations and tolerance in different strategies. ___________________________________________________________________________________ Disclaimer: Do NOT trade or invest based upon the analys
FREE
This indicator contains Pivot Levels of: Traditional Fibonacci Woodie Classic Demark Camarilla  Calculation periods can be set to auto / Daily / Weekly / Monthly / Yearly.  Number of Levels are editable.  Options to hide level labels and price labels.  Pivots Points are price levels chartists can use to determine intraday support and resistance levels. Pivot Points use the previous days Open, High, and Low to calculate a Pivot Point for the current day. Using this Pivot Point as the base, three
This creative simple indicator will provide a precise framework for market sentiment within technical analysis of different timeframes. For instance, for traders like me that uses   "Mark Fisher"   strategy regularly, this is a perfect indicator for having an insight to markets from short term to long term point of view, using Break points of candles' lows and highs and perfect to combine with   "Price Action" . For more options and modifications you can also edit the low timeframe candles withi
FREE
The MP Andean Oscillator is used to estimate the direction and also the degree of variations of trends. It contains 3 components: Bull component, Bear component and Signal component. A rising Bull component indicates that the market is up-trending while a rising Bear component indicates the presence of down-trending market. Settings: Oscillator period: Specifies the importance of the trends degree of variations measured by the indicator. Signal line per: Moving average period of the Signal line
FREE
This indicator is stand alone version from  MP Pivot Levels  (All in one) containing Woodie Pivots. Woodie’s pivot points are made up of multiple key levels, calculated from past price points, in order to frame trades in a simplistic manner. The key levels include the ‘pivot’ itself, and multiple support and resistance levels (usually up to three each). Traders use these levels as a guide for future price movements when setting up trades. The pivot : (Previous high + previous low + 2 x previou
FREE
Candle size oscillator is an easy to use tool to figure out candle size from highest to lowest price of each candle. It's a powerful tool for price action analysts specifically for those who works intraday charts and also a perfect tool for short term swing traders. Kindly note that you can also edit the Bullish and Bearish candles with different colors. #Tags: Candle size, oscillator, price action, price range, high to low, candle ticks _________________________________________________________
FREE
MP Relative Bandwidth Filter (RBF) is created to be used to identify your trading zones based on volatility. This easy to use technical indicator attempts to compare between Bandwidth of higher length and ATR of lower length to identify the areas of low and high volatility: Relative Bandwidth = Bandwidth / ATR The Bandwidth is based on Bollinger Band which its length ideally needs to be higher and ATR length needs to be ideally lower. After calculating Relative Bandwidth, the Bollinger Band is
FREE
A pin bar pattern consists of one price bar, typically a candlestick price bar, which represents a sharp reversal and rejection of price. The pin bar reversal as it is sometimes called, is defined by a long tail, the tail is also referred to as a “shadow” or “wick”. The area between the open and close of the pin bar is called its “real body”, and pin bars generally have small real bodies in comparison to their long tails. The tail of the pin bar shows the area of price that was rejected, and
FREE
This utility identifies certain candle open times on chart, this can help you to see your favorite candle open and use it as it fits in your strategy. This tool is very useful for intraday charting and indicating your sessions. ___________________________________________________________________________________ Disclaimer: Do NOT trade or invest based upon the analysis presented on this channel. Always do your own research and due diligence before investing or trading. I’ll never tell you what
FREE
MP Price Change Indicator is a tool to calculate the price movement by percentage. The Value of this indicator can be adjusted to look back of the percent of price change within certain timeframes. This is a powerful tool when used by other indicators as well, such as ATR and ADR, for understanding price fluctuations and tolerance in different strategies. ___________________________________________________________________________________ Disclaimer: Do NOT trade or invest based upon the analys
FREE
This creative simple indicator will provide a precise framework for market sentiment within technical analysis of different timeframes. For instance, for traders like me that uses   "Mark Fisher"   strategy regularly, this is a perfect indicator for having an insight to markets from short term to long term point of view, using Break points of candles' lows and highs and perfect to combine with   "Price Action" . For more options and modifications you can also edit the low timeframe candles withi
FREE
MP Gradient Adaptive RSI oscillator uses AMA with the basic RSI to cover the retracements with minimum lag. Trigger line crossing the oscillator will provide an entry point for trader. Settings: RSI period: period of the oscillator Sensitivity of the oscillator: controls the sensitivity of the oscillator to retracements, with higher values minimizing the sensitivity to retracements. RSI applied price: source input of the indicator Number of bars to draw: is used when the Fill Type option is n
FREE
This indicator helps to identify market sessions, It's High/Low, Open Range (OR), range of the sessions in pips and percentage of previous day (change%) under OHLC. It is also editable for any brokerage market watch time. For traders who use session trading strategies such as Mark B. Fisher ACD it can be super effective, where they can edit OR from the settings to either line or box.  We tried to make the settings easier to edit, for traders' use on different markets, charts and brokerage time.
This indicator contains Pivot Levels of: Traditional Fibonacci Woodie Classic Demark Camarilla Calculation periods can be set to auto / Daily / Weekly / Monthly / Yearly. Number of Levels are editable. Options to hide level labels and price labels. Pivots Points are price levels chartists can use to determine intraday support and resistance levels. Pivot Points use the previous days Open, High, and Low to calculate a Pivot Point for the current day. Using this Pivot Point as the base, three resi
Фильтр:
zainshah94
100
zainshah94 2023.09.10 18:33 
 

Very nice and good indicator with out any lack and repaint.

Pierre Ksachikian
16111
Ответ разработчика Pierre Ksachikian 2023.09.10 21:12
Glad to know, Thank you for your feedback.
DTE81183
64
DTE81183 2023.06.20 10:06 
 

Great indicator, thank you for allowing the use of it. When combined with exhaustion & order block indicators, it is very accurate in finding turning points.

Pierre Ksachikian
16111
Ответ разработчика Pierre Ksachikian 2023.06.20 14:38
That's great to know, thank you for your feedback.
Ответ на отзыв
Версия 1.2 2023.01.15
Some improvements and bug fixes
New settings are added:
- Options to change position, distance and size of markers
- Option to count Inside Bars having equal level(s) with their Mother Bars
Версия 1.1 2022.11.19
- Type of marking Inside Bars has been changed
- More input variables are available now