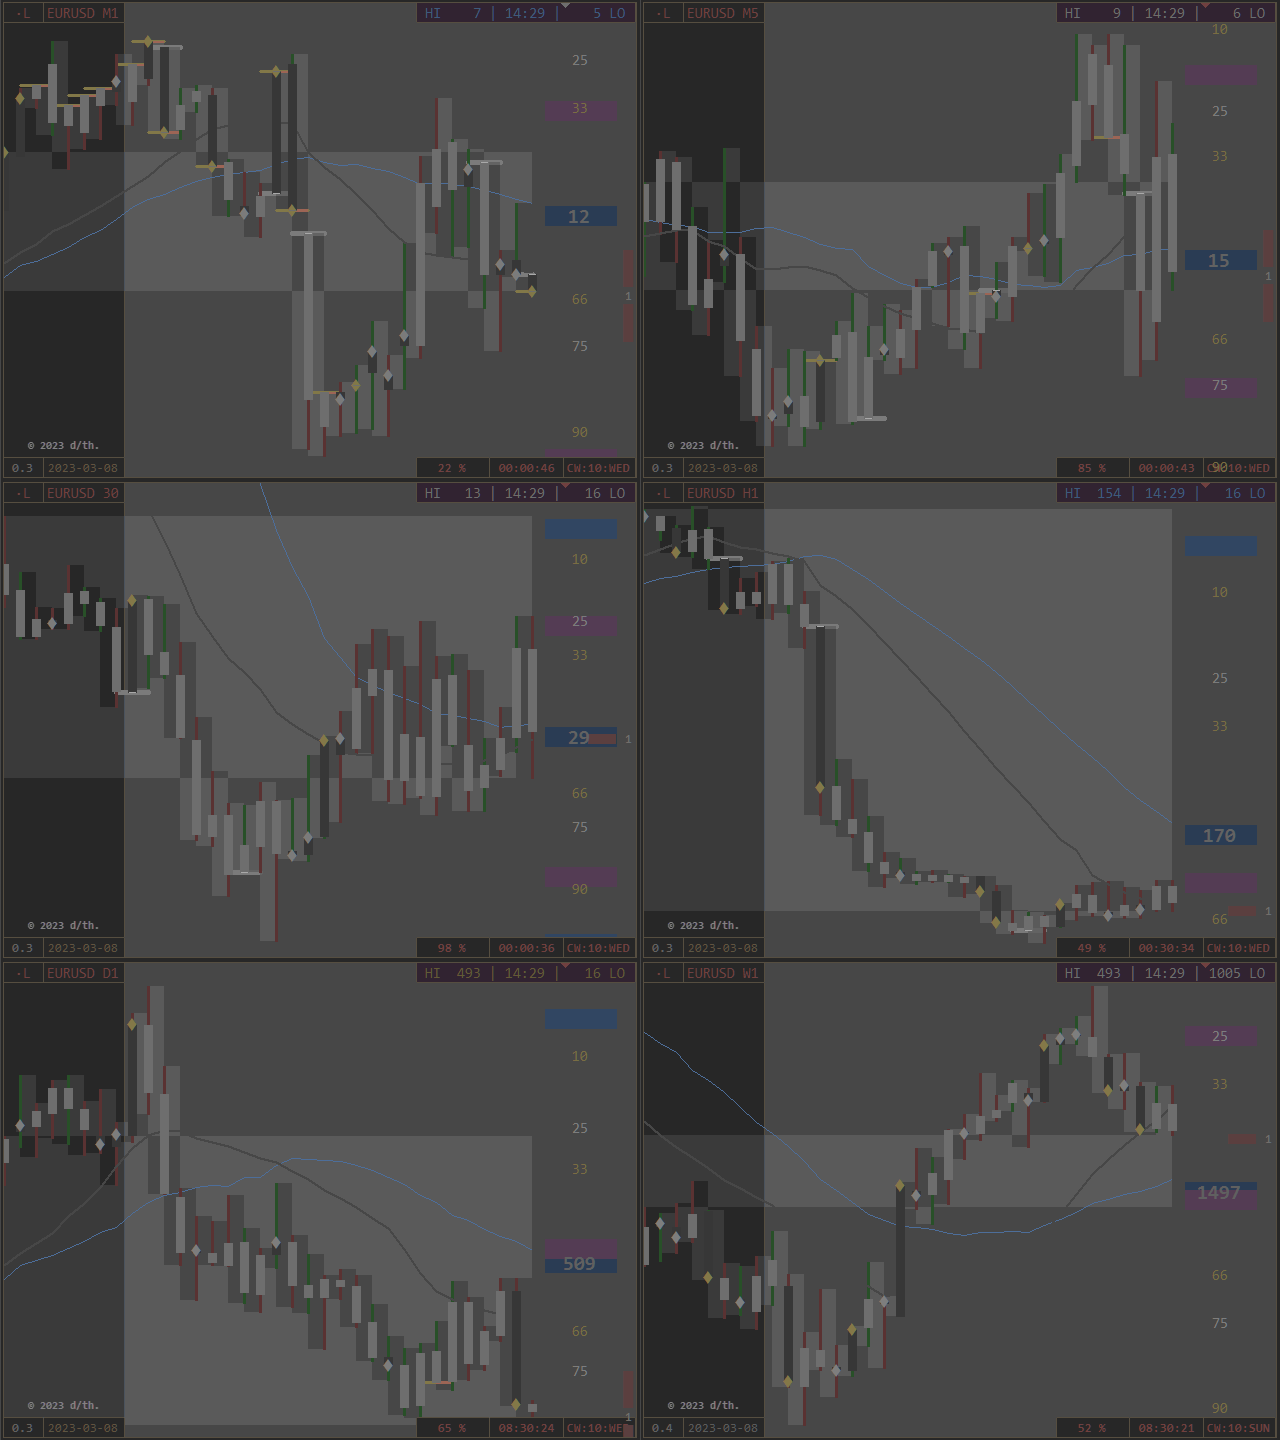
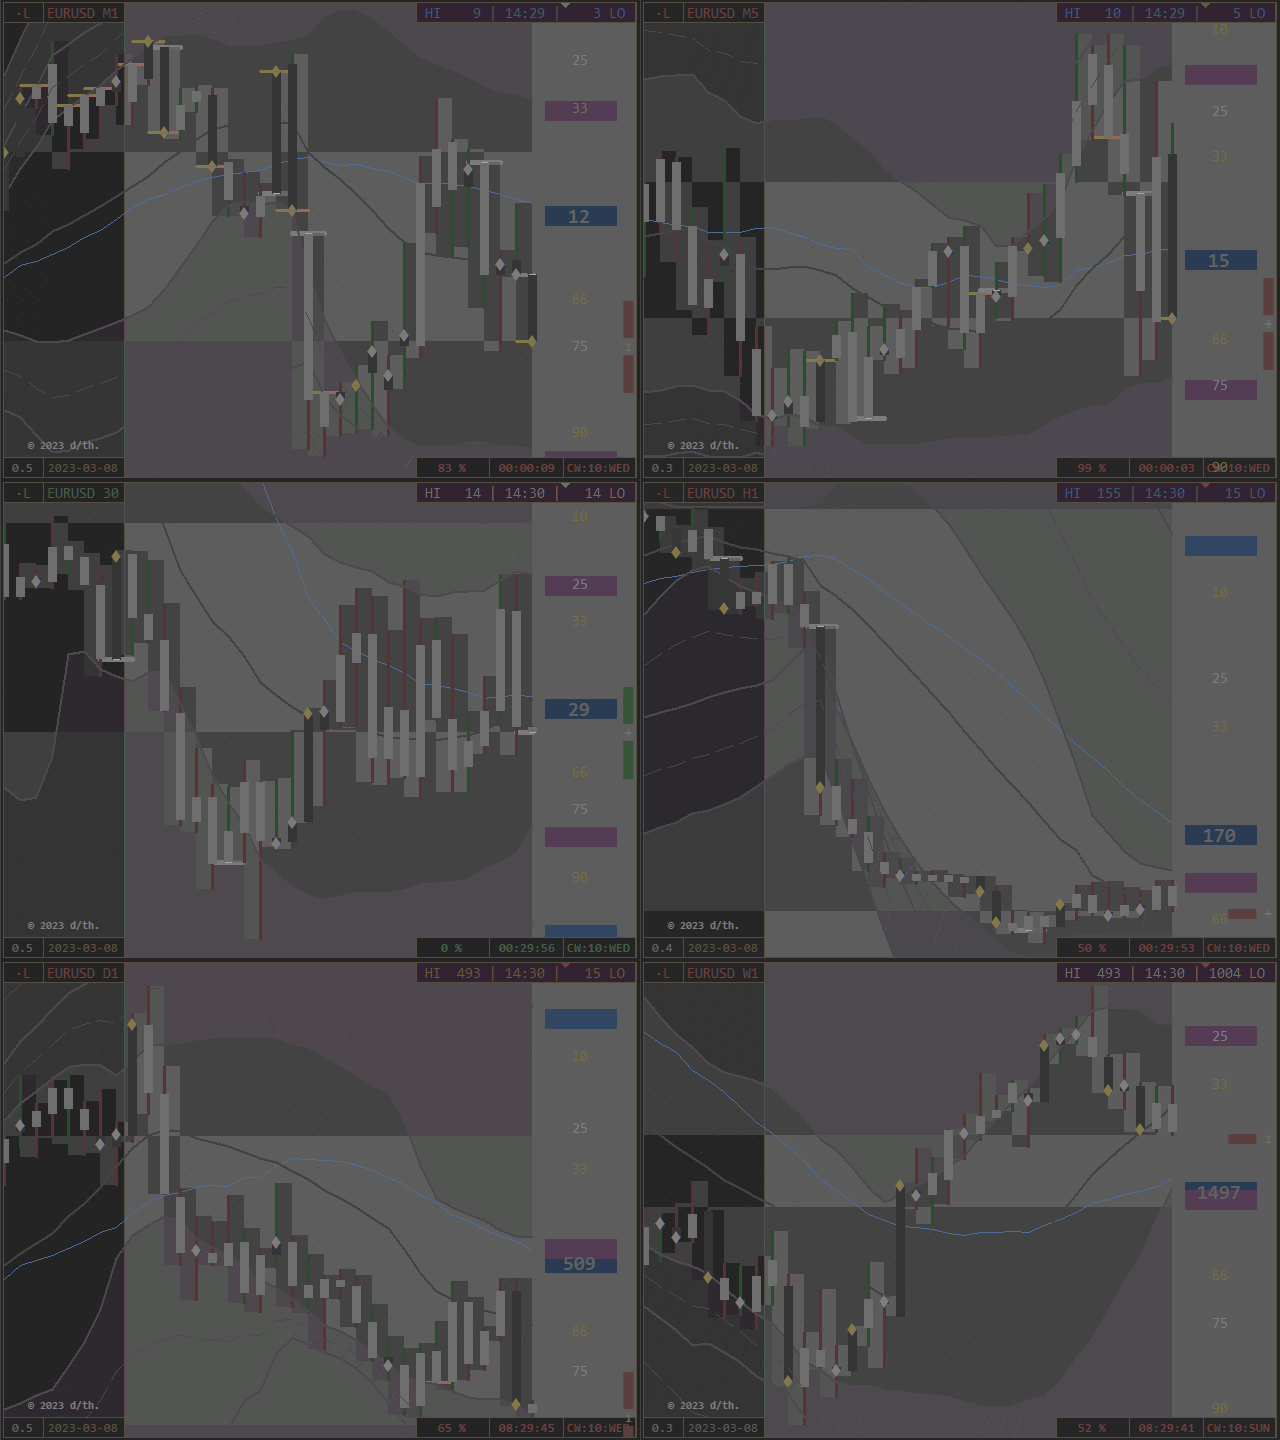
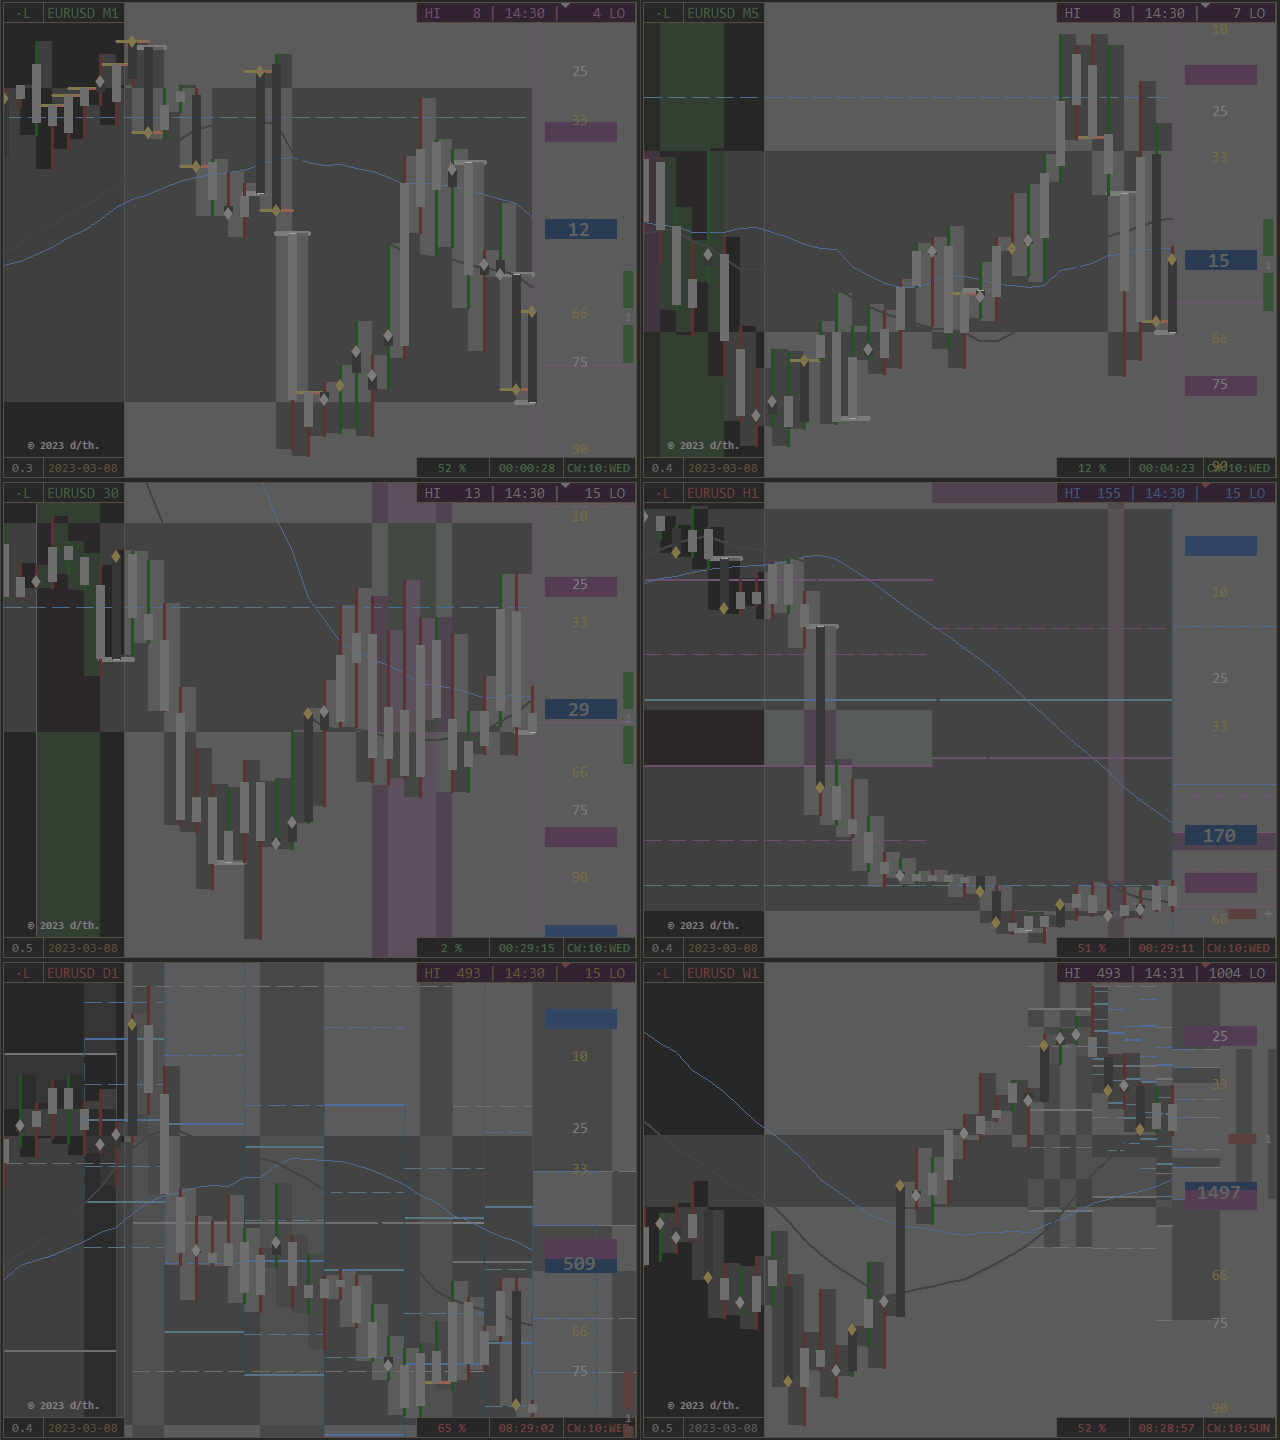
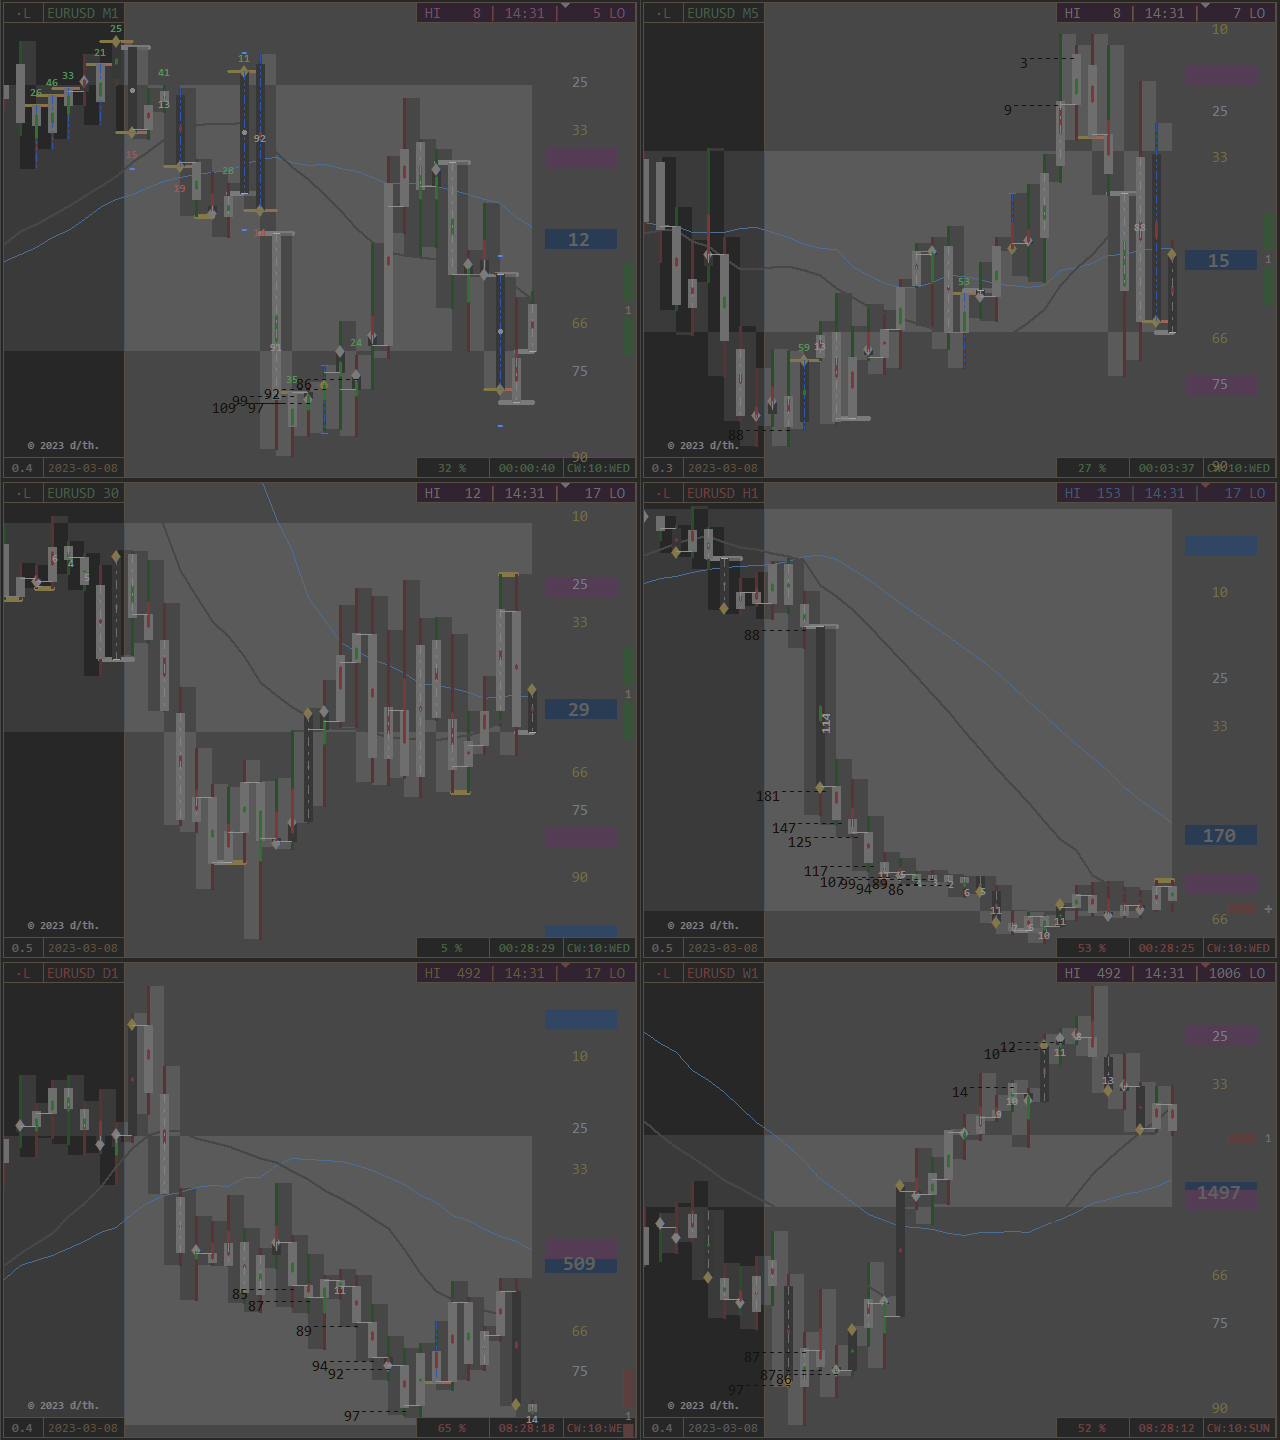
• Обзор
  • Отзывы (2)
  • Обсуждение
  • Что нового

PointZero

5

Concept

Market arranges in Time upcoming Phases according to the present Results of its Interest.

Directing Modulations are an Interaction of immanent Periods, which show in Reference

  • to Time cyclic Activity and
  • to Price leveling Activity.

PointZero is a projecting Price Mask of this Concept of Time and Price and

  • categorizing developed Price Movements related to their own Range: how far moved ?
  • indicating their Status by marking special Events: when which Action ?
  • setting the Situation in a functional Relation to the presented Support/ Resistance - Motive: miss/ hit/ pass ?


synthesize and project

Arrange with its underlying, grounding Components

  • Time Price Channel
  • Triple Pivot

and its conditional indicating Period Event Notation a situational Coordinate System.


Content

Time Price Channel

The D1/ W1/ MN - Channel consists of Shells around the ranging Center, which reflect the

periodic Alterations by its Separation in High-/Low-Bands and central Moving Averages.


Period Event Notation

Positions, Expansions and Distances are measured against the own Range,

as also against the Channelrange, of which a Period the Body and (Part of) the Move is.

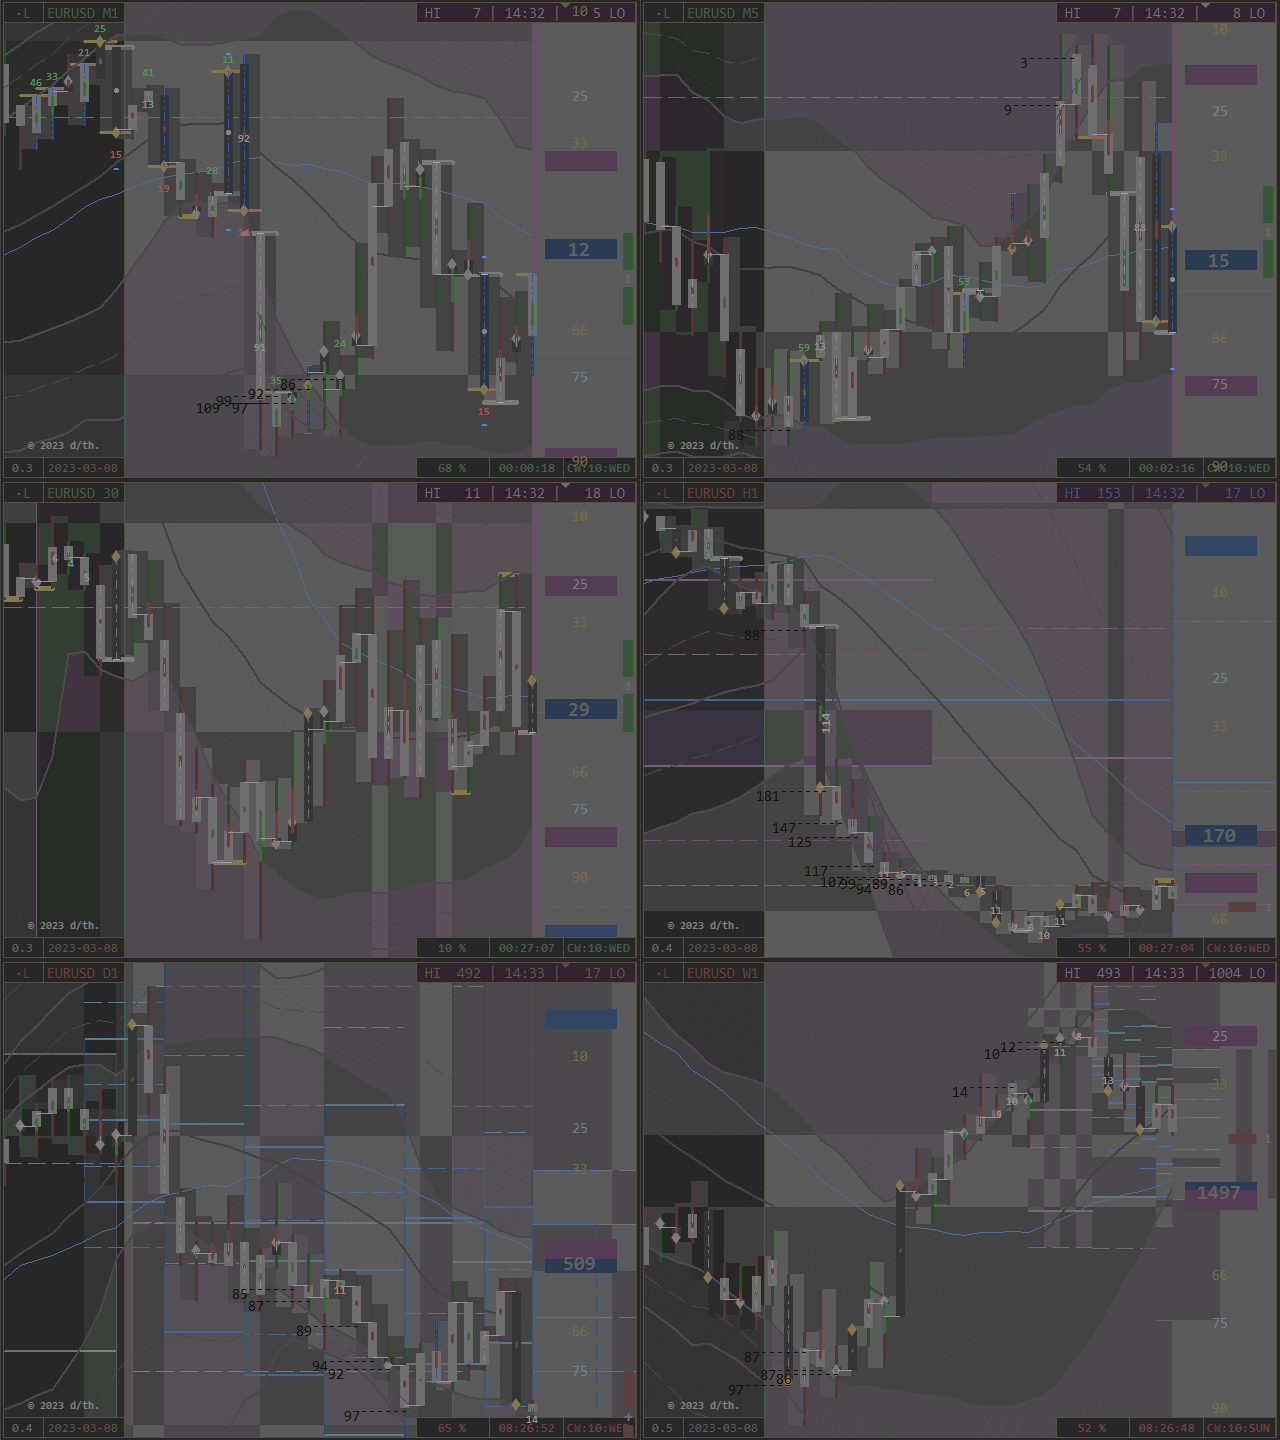
Special Events are displayed:

  • Close/ Open at High/ Low/ Center (colored Notes)
  • Break of weekly Channelbands (as Range Percentage)
  • Move 0 - 100 % of Range: Open to Close = High to Low (blue dotted Trend)
  • Move Proportions (white Values)
  • Offset of Move - Center against Range - Center (central Colortrend)
  • Parity of actual OHLC and previous OHLC (white Trend on Period and Offset Arrows on Scale)
  • Parity of up and down - Wick (blue Stars)
  • limiting Tick Values (Fraction Hits, green/ red)


Pivot Period Ports

D1/ W1/ MN - Pivots create besides their Portlevels a colored Background, indicating cyclic and leveling Phases.


Layers:

  • Projectors, Ranges and Scales (set PointZeros in Relation to their own and to the actual Channelrange)
  • Mirroring of Movements as Bars and Trendlines
  • Coloring of Bands/ Periods
  • Periods on/ off
  • geometrical Chartstructure with Universal Mask


Additional Benefits:

  • a positioning Autofocus
  • a Logbook as directional Protocol
  • a systemic Clock informs about periodic Phases (Pivot and Realtime)
  • a Screenshot Function (Button on Chart and as automatic Interval)
  • a detailed Definition of Objects and Functions by the Descriptive Mode (as Tool Tips)
  • an adjustable Price Column and automatic Chartfitting


Contemplate its Concentrate

The Signal Density is related to Markets actual Phase, chosen Timeframe/ Security and Components.

PointZero generates as resulting Composition a defined Setting of Support and Resistance:

No Matter which Hemisphere: [ Open = Support | Resistance = Close ]


Both look like the Other.

The MindMask resolves the active Status.


A Picture is worth a thousand Words.

Indicative : Colorized : Universal


Please find all necessary Informations to this Product in its Compendium.

Below as Orientation the Extract of the individual Indicator-Adjustments.


Indicator PointZero

Think global - Act local


[VALUE] =

  • Boolean: Button Position on Chart
  • Cn: Corner n0 to 3 (left upper to right lower)
  • Variabledefault Value


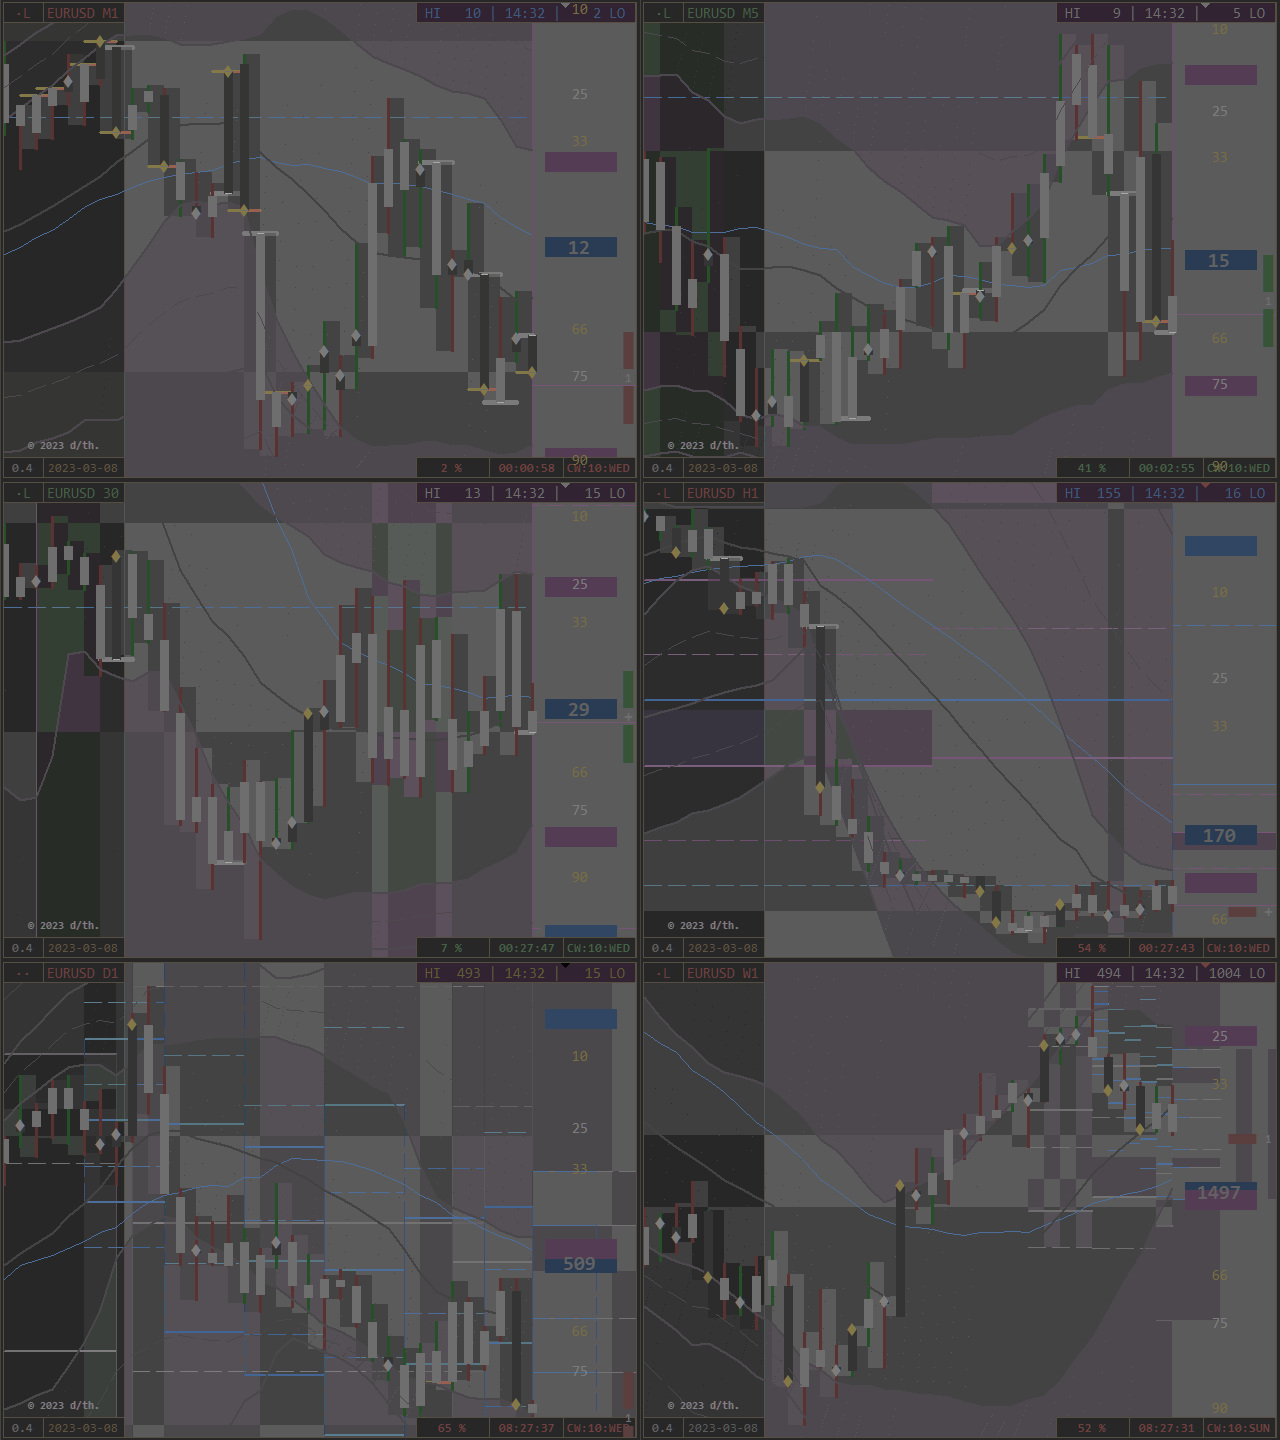
The default View of the Chart consists of following Components and is read like follows:

Move: Trace dark-gray/ Trend bright-gray

works as moving Range and ranging Move.

central MA: daily gray, weekly blue

Range Color by Open: Offset to prior Close/ Open/ Center (conditional)*

Note*: no separate Center-Color, the Open is passed by/of both Directions.

Close Color by Move: Offset to prior Open (= actual)

  • directional on: Null = white/ Full = orange
  • navigational off: up = green/ down = red
  • PointZeros off: noted by a white Haircross,

Toggle Close Signal via Countdown-Button.

Every Period works by its own Range-Shadow with the variable Chart-Coloring.

Identify their Phase by Coloring the Ranges with Button in Corner 3 most right (CW:WD)

Visual of centered Range-Creation and -Filling:
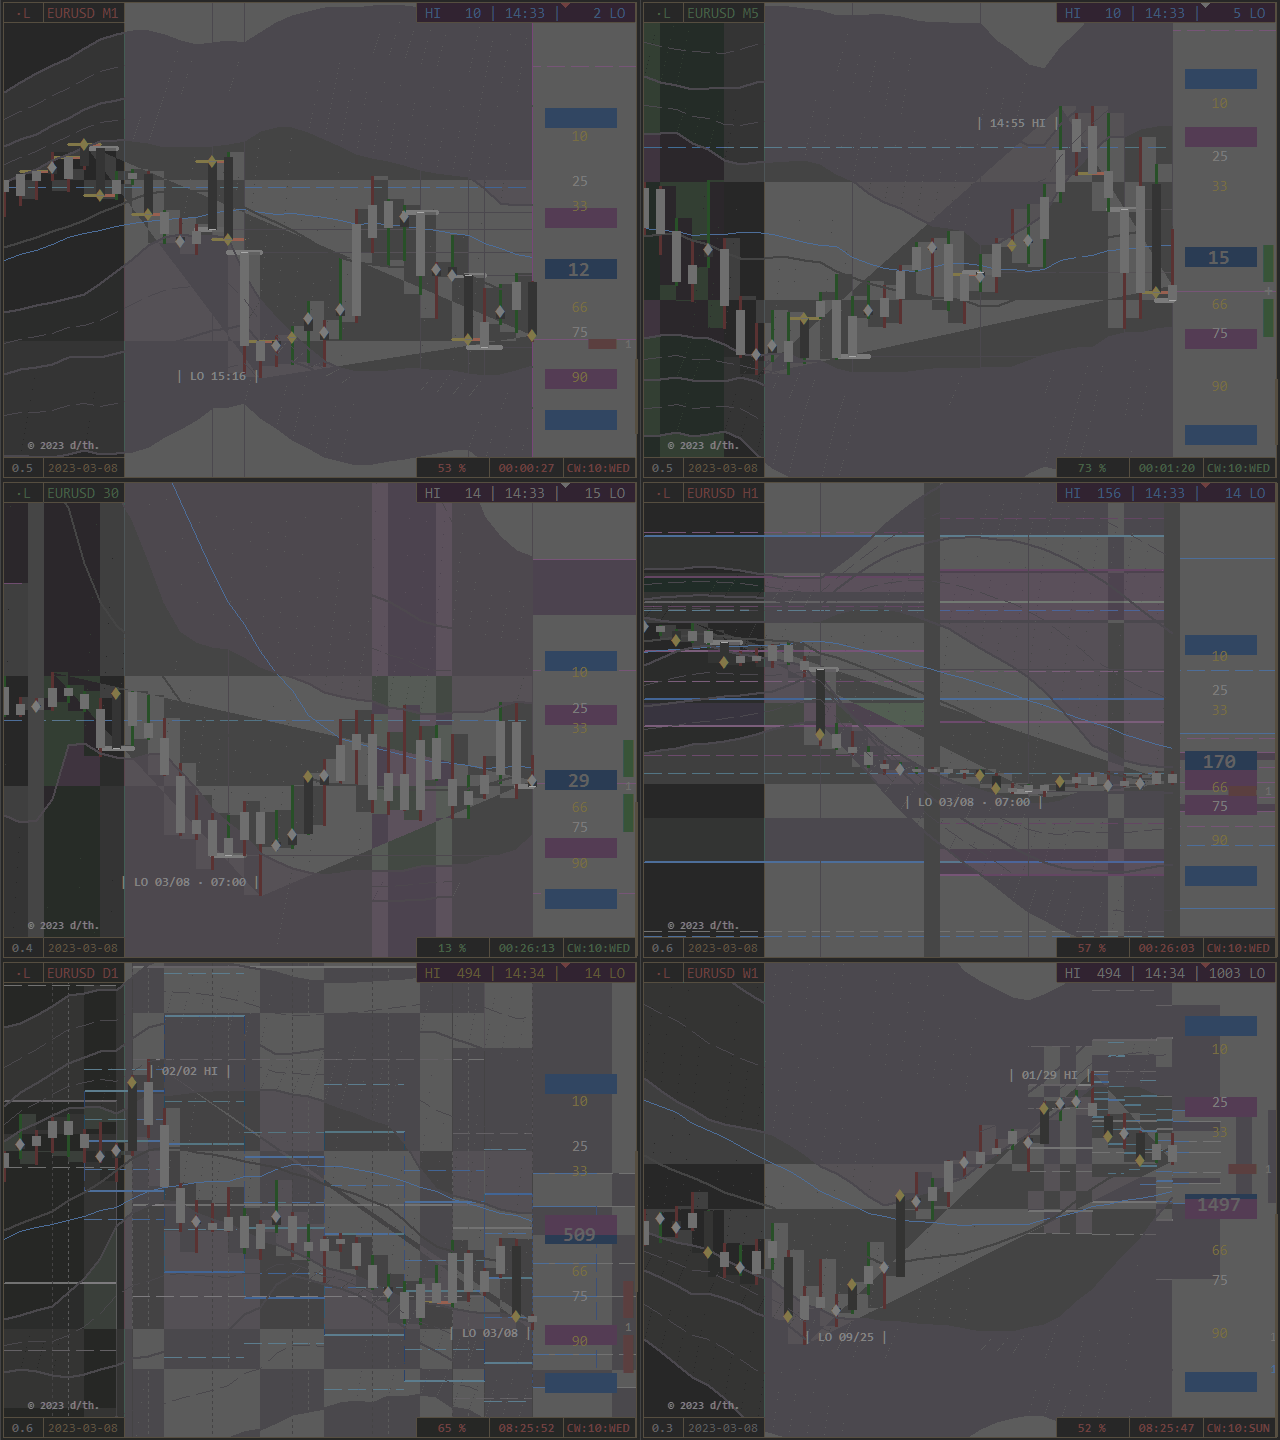
The Chart generates a (mostly central) gray Zone as Spread between

the highest Low and the lowest High of the visible Chart-Periods.


[5.1] Bools (on/ off) 

Code = Logic = Notation of Ordination


[5.1A] Fundament

Body of Chart


The first Options are the framing calculatoric Fundament of any Indicator Processing.

The visual Conjunction of both Mask-Complements delivers accidentially extra Room

for additional Buttons in the Sub-Chart, to have direct Access to these three Core-Options.

Bands and Pivots define the periodic Arrangement,

on which the Pen notes its designing Movements.

The Colors of Channel and Pivots cooperate = they are softened or amplified

and process accordingly to the Color Theory an indicating Background Tone.

The overlaying Period Event Notation is called by variable Conditions and

visualizes the Tracing/ Trending of Bull and Bear in their Habitates/ Hemispheres.


Time Price Channel [SUB]

To identify its Construction fully, colorize its dimmed Trendlines by Countdown-Button [C3]

(or preadjust via Colored Bands in Options).

  • hemispheric = 2 x 50% Coloring Ranges, depicted as colored Shells
  • gray D1, blue W1 Center = 0
  • Shells divided by Center-Trend
  • asymmetric Appearance due to separate Calculations 
  • of High and Low - Bands and central Moving Averages
    • Definition of Moving Average
    • variable Price Line 
    • Price of Time = external Argument
    • Definition of Channel-Band
    • constant Time Line 
    • (ime of Price = internal Argument

3-lettered Abbrevations on Price-Column:

  • Timeframe: MN = M, W1 = W, D1 = D
  • + Position HILO
  • e.g. WLO = Low of W1 - Channel (blue)


Period Event Notation [SUB]

special Contemplation of conditionally called absolute and/or relative Events:

  • Gator: 0-100 = Zero + Full Move
    • blue dashdot Centertrend on Period
    • notes new Phases (Caution)
  • Range/Move - High/Low (RH/ RL / MH / ML)
    • white move-connecting Trendline on Period
    • notes Stator/ Rotor - Function by Open Position of Period
  • Offset Move-Center against Range-Center 
    • colored Centertrend: green = North, red = South (directional)
    • notes potential/ tendencial Phase Shifts
  • periodic Centers in superordinated Range
    • white Value on Period if Close = 50% and < 15% or > 85% in D1-Range
    • notes near to Edge - Horizons in D1-Channel
  • Values beside Periods (connected with Dashes to Close)
    • if Close beyond W1 - Bands
    • note relative Barriers for overshooting Level-Phases
  • Tick Fraction Hits, as green and red Values
    • calculatoric Base is the Relation of Period Expansion and Volume
    • note expansional Edges of Time/ Price/ Tick
  • bright blue Double Points (Stars)
    • equivalent balanced/ central Position of Move in its Range
    • note Periods, which have an equal Size of their "Wicks"


Pivot Period Ports [SUB]

Enjoy freestyle Combinatory for 3 main + 1 sub Pivot ((MN/ W1/ D1) + H4).

universal Standard:

Pivots are processed Period-Gates and describe a superordinated Sequence of Market.
Equipped with cyclic and leveling Zones (colored Background), which note

  • by Time the first, central and last 10% of the Cycle Range 
  • (Visibility timeframe-dependent, adjust accordingly if necessary)
  • by Price the 66-75% of North and South Level-Range 
  • (Visibility chartscale-dependent, use implemented Autofocus if needed)
3-lettered Abbrevations on Price-Column:
  • Timeframe: MN = M, W1 = W, D1 = D, (H4 = H)
  • + Direction (N, S)
  • + Level (1, 2, 3)
  • or Pivot (PP)
  • e.g. MN1 = Monthly Pivot (white) Level 1 in Northern Hemisphere
Due to the inequal Hours of a Real-Time Week related to respective Weekdays

(last two Hours of Friday are processed on Sunday)

  • additional and isolated Sunday-Pivot.


Functions

Being develops from Within.

Equal Interest is generic.


The next five Options are Instruments for an extended Chart-Appearance and flexible Functionality:

[PRICE] Auto Focus:

Visual Flexibility, automatic

  • toggle by Click on the Price-Column (most right)
  • calculates the Chart-Dimensions related to the actual Move-Development
    • creates Room on active Hemisphere
    • more Range if Trend/ more Move if Trace
    • Sensitivity indicates upcoming Activity (Work on Tipping-Points)
  • situative fluid Chart Impression (Scalation of developing Range = relative)


[SCALE] 2 x Period (Range + Move):

Visual Flexibility, manual

Isolate Range and Move by Click-through:

  • toggle by Click on the Scale-Column (2nd right)
  • first Click = minus Move, shows blank Period-Range
  • second Click = toggles Range and Move, shows blank Period-Moves
  • third Click = all back

Not intended for Live-Use and, to avoid Mis-Clicks not accessible of the Chart, but via Options-Menu:
switch Periods completely off with both Options false => complete free view.

All Layers stay functional.


[PROJECTOR - TOPProtocol Role:

Data Divisioning, Sentence

The Protocol of periodical Events can be set to Autostart for sufficient wide charts.

Chart-Auto-Scroll has to be active.

According to the Chart-Concept it is divided in componental Columns of TOHLCV,
inclusive full Legend via Tooltip.

From left to right:

  • Period Time/special Occurrences
  • positioning Range Open Side
  • central periodic Function (two Roles)
  • navigating Move Close Side
  • Period Volume/special Occurrences
  • switch on/ off (completely) on Chart via Projector - Button
  • leave with staying Panel as Placeholder by direct Click on the List
The Placeholder-Panel is generally accessible by direct Click on it (most left Column).
It is in flat Markets potentially supportive for the Resolution, because MT-Scale-Calculations

are situatively adjusted by Reduction of Periods (optional in Conjunction with Autofocus).


[REFLECTOR - BOTUniversal Mask:

Data Divisioning, Sequence

  • Open/ Close at High/ Low/ Center (Notes/ Dashes/ Crosshairs)
  • Open/ Close - Grid, PointZero Support-Resistance Graduation
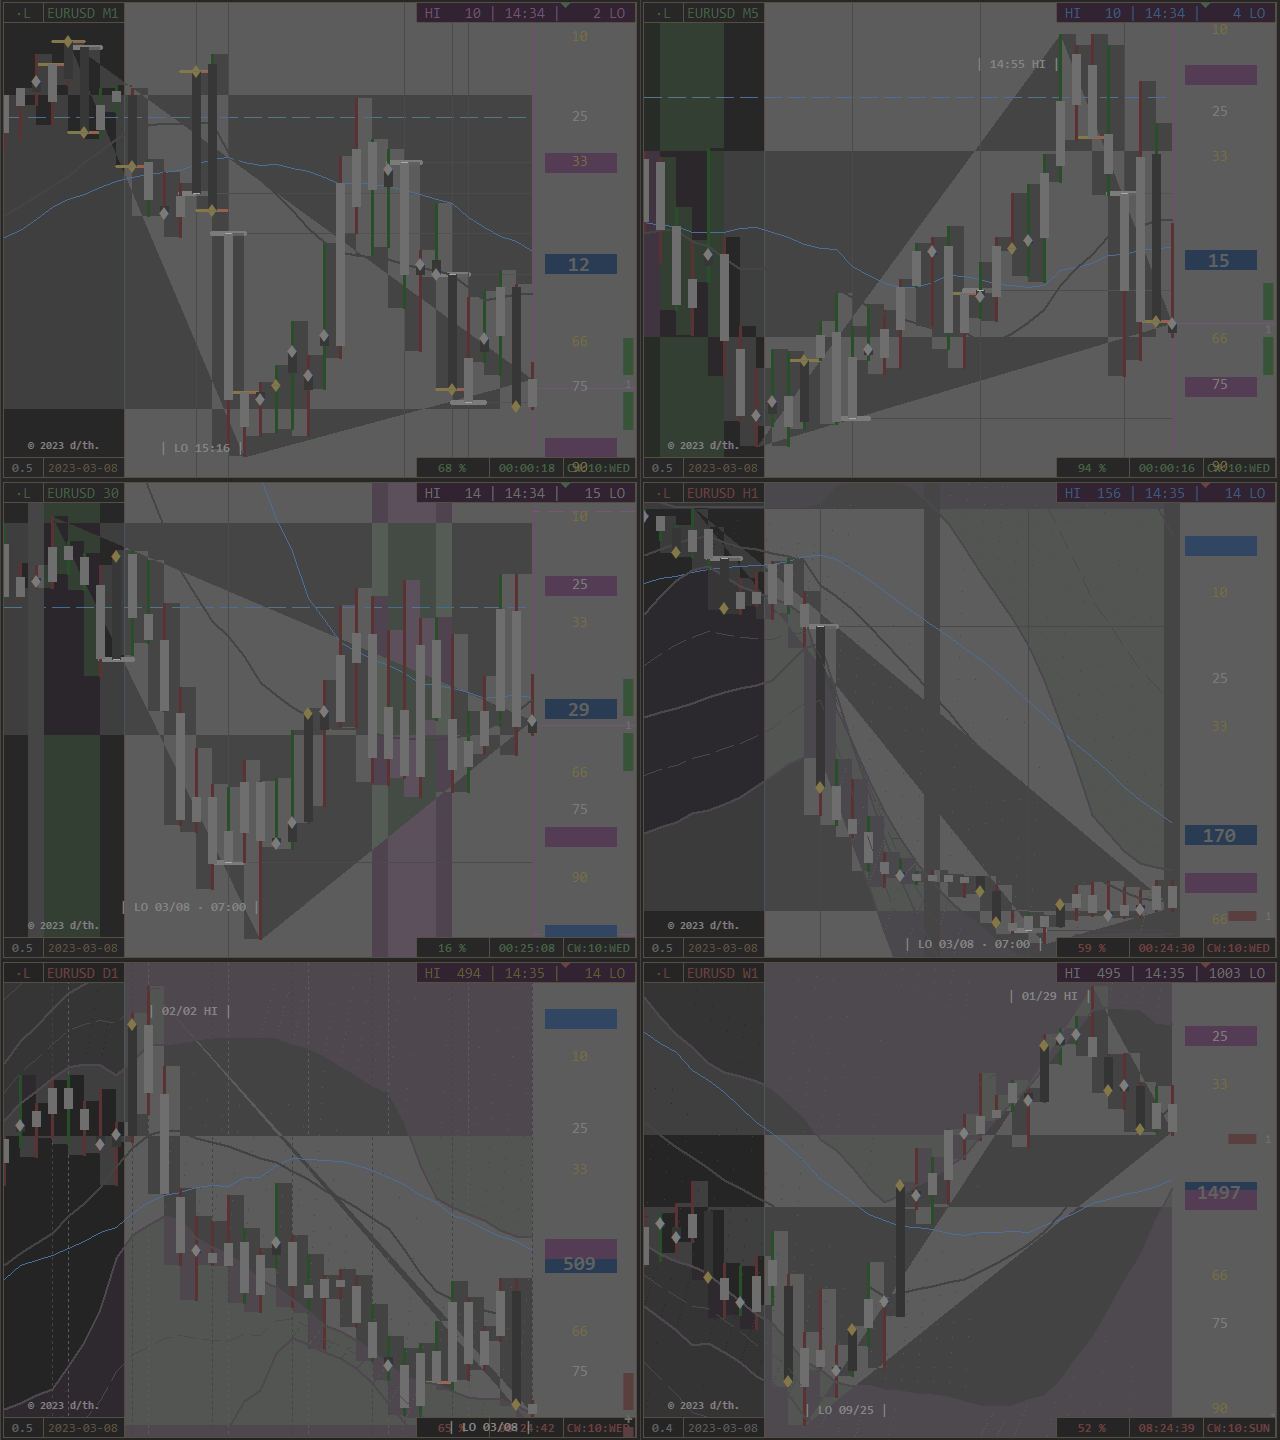
  • High/ Low/ Bid - Cone of Light (Chart Phase Scope)
  • High/ Low - Chart-Time of visible Periods (white, on Chart: timeframe-sensitive)
  • High/ Low - Chart-Price of visible Periods (white, on Price-Column: CHI = Chart High, CLO = Chart Low)

Indication of weekly Realtime-Transition Wednesday and Thursday

    • Odin = Ministrant/ Mantle/ collects = Close of Phase
    • Thor = Kloeckner/ Hammer/ strikes = Open of Phase

appears on Timeframes > M5 as underlying Histogram-Ray (chart-traversal)

  • if Zero = Close at Open/ High/ Low/ Center: white dash, notes Edges and Centers of Phases


Following Layers are Product of a special Contemplation

of the inner and outer Relations of Open and Close.

Move-Info

DisplayPosition + Direction + Function + Phase

[TOP] Echo Bars:

  • mirrored Bars, directional colored according to their respective Period-Direction,
  • adds an inverted Visual of Movements and forms functional Helix.

[BOT] Echo Trend:

  • mirrored Open- and Close-Trendlines, white = Open and orange = Close,
  • notes separately the leading Component of a Period as Heartbeat-Trend.


Layers

projective Reflection = reflective Projection


The Card Deck:

2 Buttons Corner 0TL

most top-left:
Order-Tool
  • first Letter = Pivot, second Letter = RealTime
  • DisplayC = Cycle/ L = Level/ Dot if not

Symbol - Button:

Clock

  • Market is clocked realtime to the real World by own Interest via cyclic and leveling Events.
  • Button Top right Corner 1 (Screenshot-Button) shows VOL (Volume/ Volatility)
  • Phases MN = M/ W1 = W/ D1 = D
The actual Time-Phase correlates with actual valid Price- and Volume-Phases 
and defines the timely Range of the pricely Movement. 
Price confirms this defining Call as designed Reflection.
Equal Colors cooperate through all Dimensions.


1 Button Corner 1TR

  • Clock Display
  • Screenshot, saved as GIF in \\DataFolder\MQL\Files\


2 Buttons Corner 2BL

Spread-Button (first, left) extends Button Row:

Activate four additional informational Buttons beside Protocol/ Interactive Mask,

which give access to the separate Chart Projectors. 

Note:

The following Layers are Product of the Projection of PointZeros to the actual processed Range and Move.

According to the Separation in Cycles and Levels, the direct

  • Projections as Light Cones are separately accessible.

Ranges and Scales are functional combined, and both are

  • by time: white/ blue and
  • by price: green/ red colored.

All have their conditional Appearance according to

  • Timeframe/ Security and Presence of Conditions 
in common.

Thus, Event-Density and -Impact

  • according to relative Distribution and Correlation of present Potentials!

Because of this, they are directly accessible by Chart-Button, or via Options automatically activated.

Choose of limitless Adjustability for Templates!

Due to their steady Interaction with the present Period they develop

and work actively (if enabled), until the PointZero leaves the Chart.


    From left to right:
    Time-Price-Button:
      DisplayServer-Time + Bid
      FunctionPointZero - Level Scaling
      • TOP Level Ranges
      • absolute and relative Plot of High/ Low - Ranges of respective PointZeros, 
        • Color navigational/ positional
      • BOT Phase Scales
      • absolute Division of respective PointZero - Range, 
        • overlying Variable notes TOHLCV - Position of next directive Call


      TPP / PPT - Button:

        Display: Productivity

        VPP = Volume per Period:
        Protocol List/ Center on TimeBand
        absolute (= Frequency)
        Impulse / Period
        Sensitivity 15%

          TPP = Ticks per Pip:

          • relative (= Alteration)
          • Impulse / Pip
          • Sensitivity 33%

            PPT = Pips per Tick:

            • total (= Oscillation)
            • Pip / Impulse
            • Sensitivity 50%

              Please further Informations to external Productivity in Section [7.0].


              FunctionPointZero - Projector (Beams)

              • on Top = Cycle
              • on Bottom = Level


                Both Projectors are setting their own Range Position in Relation to the actual Range Position,

                depending on their individual cyclic/ leveling Function.

                They work according to their Function and related to the individual Chart-Situation 
                as 
                ranging Barriers (Resistance) or 
                moving Tractors (Support).
                  Their Update-Frequency is by Tick, that means: they adjust in Cooperation with the 
                  actual Development, as long as their Period is on the Chart visible (if enabled).

                  Date-Button (second, right)
                    • Toggles the Period-Scale and 
                    • navigating Arrows RH/ MH/ ML/ RL, noting their Offset to their prior Position.
                    • Periods: Support white - Resistance orange


                      3 Buttons Corner 3 = BR

                      Colorize Channel Bands and Period Ranges to identify their Classification/ Function:

                      • Step = violet = D1 
                      • Lift = blue = W1
                      • Null = white = MN
                      • Full = orange = H4

                      left: [Period-Percentage] = colored Periods

                      note the classified State of Period-Moves

                      right: [CalendarWeek:WeekDay] = colored Channel-Bands
                      note the classified State of Period-Ranges = Channel-Shells/ Levels
                      center: [Countdown] = Close Signal

                      initially not shown, here on/off


                      Adjustments of general Nature:

                      • The Descriptive Mode is useful for Orientation or Confirmation (of not finally settled Experience).
                      • Extend the Pivot by H4 for smaller Timeframe Analysis.
                      • The MT4-Scales are a "fundamental Adjustment". I cannot resolve them..


                      Integer/ Double

                      constant variable = variable constant

                      The Icing:

                      • Protocol Role0 = Func (Function) / 1 = Bube (BullBear)
                      • Offset Price: position Price by whitchever Intent
                      • Shorten Digits: 6 Digits can be shorten to the preferred Length

                      • Screenshot 
                        • Interval: 0 = off
                        • Integer above 0 = Interval in Minutes
                        • adjust in Height and Width
                        • saved as GIF in \\DataFolder\MQL\Files\


                      Please find all necessary Informations to this Product in its Compendium in its respective RadioPhase - Blog.


                      logiclaboratory studio
                      © 2018-2023 /thiejden.


                      Отзывы 2
                      Daniel
                      875
                      Daniel 2023.07.26 17:01 
                       

                      Ich schaue mir beide Indis von dir mal an, Optik und Ausführung perfekt, mal schauen wie ichdamit zurecht komme. Erstmal vielen dank für die Indis und die Arbeit.

                      Jamie Daniel Thompson
                      263
                      Jamie Daniel Thompson 2023.06.22 14:43 
                       

                      Extremely useful and incredible tool! I don't understand how this doesn't have 5 star reviews yet! It has totally changed the accuracy of my entries! Thanks to the author!

                      Рекомендуем также
                      Индикатор отображает на графике сигналы согласно стратегии Билла Вильямса. Демо версия индикатора имеет такие же функции, как и платная, за исключением того, что может работать только на демо-счете. Сигнал "Первый мудрец" формируется, когда появляется разворотный бар с ангуляцией. Бычий разворотный бар - у которого более низкий минимум и цена закрытия в верхней его половине. Медвежий разворотный бар - более высокий максимум и цена закрытия в нижней его половине. Ангуляция образуется, когда все
                      FREE
                      Introducing the Consecutive Green/Red Candle Alert Indicator for MT4 - Your Trend Spotting Companion! Are you ready to take your trading to the next level? We present the Consecutive Green/Red Candle Alert Indicator, a powerful tool designed to help you spot trends and potential reversals with ease. Whether you're a new trader looking for clarity in the market or an experienced pro seeking additional confirmation, this indicator is your trusted companion. Key Features of the Consecutive Green/Re
                      FREE
                      SensorMap
                      Juergen Thielen
                      5 (1)
                      Concept Market arranges in Time upcoming Phases according to the present Results of its Interest. Directing Modulations are an Interaction of immanent Periods, which show in Reference to Time cyclic Activity and to Price leveling Activity. SensorMap is a reflecting Volume Mask of this Concept of Time and Price and apportioning developed Price Movements in an equalized 100 % - Range: how far moved ? indicating their Status by marking special Events: when which Action ? setting the Situation in
                      FREE
                      Free automatic fibonacci - это индикатор, который автоматически строит коррекции Фибоначчи, основываясь на количестве баров, выбранных в параметре BarsToScan. Линии Фибоначчи автоматически обновляются в реальном времени при появлении новых максимальных и минимальных значений среди выбранных баров. В настройках индикатора можно выбрать уровни, значения которых будут отображены. Также можно выбрать цвет уровней, что позволяет трейдеру прикреплять индикатор несколько раз с разными настройками и цве
                      FREE
                      TrendPlus
                      Sivakumar Subbaiya
                      4.21 (14)
                      Trend Plus   Trendplus  Indicator   Time Frame: Suitable for any time frame.  Purpose: Trend Prediction. Blue and red candle indicate the buy and sell call respectively. Buy: When the blue candle is formed buy call is initiated. close the buy trades when the next red candle will formed.   Sell: When the Red candle is formed Sell call is initiated. close the Sell trades when the next blue candle will formed.   Happy trade!!
                      FREE
                      SuperMac Free
                      Agus Wahyu Pratomo
                      4 (1)
                      FREE VERSION ONLY USE LOT SIZE 0.01 TO UNLOCK IT GO HERE  https://www.mql5.com/en/market/product/61498 SuperMac EA is a trading robot  for the trading on forex and trades  Scalping  Strategy and Tren Follower. This is a Trend Following system that trades in all session.   It use Multi Complex Algorithm to determine tren behaviour.  EA optimized on EURUSD, GBPUSD and NZDUSD (Use together) but can be use on other pair  Use PAIR can use 3 pairs (recommended to maximize profit) at the same tim
                      FREE
                      Индикатор PipTick OHLC показывает текущие и исторические значения минимума, максимума, открытия, закрытия и средне цены на выбранном периоде. Он может отображать текущие значения или значения за предыдущую сессию. Диапазоном для расчета индикатора может быть дневная, недельная, месячная или любая выбранная пользователем сессия. Уровни Максимум текущей или предыдущей сессии. Минимум текущей или предыдущей сессии. Открытие текущей или предыдущей сессии. Закрытие текущей или предыдущей сессии. Ср
                      FREE
                      Этот индикатор является идеальным инструментом для сравнения брокеров на предмет минимального запаздывания. Он моментально показывает медленных и быстрых брокеров. Точка на линии означает, что этот брокер самый быстрый, а красной линией (Broker_A) отмечен самый медленный брокер. Посмотрите пример на скриншоте. Как это работает? Индикатор работает с общей ценовой информацией в общей папке из каталога данных. Он сравнивает все цены. Цена основана на среднем значении (Ask + Bid) / 2. Есть два усл
                      FREE
                      Индикатор показывает сигналы, основанные на терминальном осцилляторе RSI на графике. Есть возможность отфильтровывать повторяющиеся (залипшие) сигналы. Здесь RSI используется для поиска сигналов на разворот. Рекомендуется в качестве точки входа по свинг-стратегии и торговли от уровней. Доступен мультивалютный дэшборд. С его помощью вы можете легко переключаться между графиками. В обсуждениях продукта вы можете предложить алгоритм, в который хотите встроить дэшборд. Входные параметры.
                      FREE
                      PZ The Zone
                      PZ TRADING SLU
                      4.25 (4)
                      Индикатор показывает сигналы на покупку и продажу в соответствии с определением торговой зоны, данным Биллом Вильямсом. Прост в использовании и интерпретации Избегает флета Детерминистский индикатор с четкими правилами Не перерисовывается Доступны все типы алертов Согласно Биллу Вильямсу, торговля в пределах зоны позволяет максимизировать/удвоить/утроить прибыль при движении рынка в нужную сторону, а именно, когда импульс, ускорение и цена подтверждают сильный тренд или период ускорения. Распола
                      FREE
                      Follow The Line
                      Oliver Gideon Amofa Appiah
                      4 (13)
                      FOLLOW THE LINE GET THE FULL VERSION HERE: https://www.mql5.com/en/market/product/36024 This indicator obeys the popular maxim that: "THE TREND IS YOUR FRIEND" It paints a GREEN line for BUY and also paints a RED line for SELL.  It gives alarms and alerts of all kinds. IT DOES NOT REPAINT and can be used for all currency pairs and timeframes. Yes, as easy and simple as that. Even a newbie can use it to make great and reliable trades. NB: For best results, get my other premium indicators for more
                      FREE
                      SuperTrend V
                      Muhammad Hassaan
                      5 (1)
                      *This is TradingView indicator converted to mql4* The SuperTrend V indicator is a popular technical analysis tool used to identify trends and potential trend reversals in financial markets. It is based on the concept of the SuperTrend indicator but incorporates additional features and variations. The SuperTrend V indicator uses a combination of price action and volatility to determine the trend direction and generate trading signals. Here are the key components and features of the indicator:
                      FREE
                      FFx MACD
                      Eric Venturi-Bloxs
                      4.38 (8)
                      Целью этой новой версии стандартного MT4 индикатора, входящего в поставку платформы, является отображение в подокне нескольких таймфреймах одного и того же индикатора. См. пример, приведенный на рисунке ниже. Однако индикатор отражается не как простой индикатор MTF. Это реальное отображение индикатора на его таймфрейме. Доступные настройки в индикаторе FFx: Выбор таймфрейма для отображения (от M1 до MN) Установка ширины (количество баров) для каждого окна таймфрейма Всплывающее оповещение/звуков
                      FREE
                      Бесплатный информационный индикатор-помощник Email Alert & InfoPanel. Особенно будет полезен трейдерам, использующим большое количество валютных пар или сеточные торговые системы с усреднением или Мартингейлом. Также он просто удобен, как информатор с возможность отправки сообщения на почту или мобильное приложение. Выполняет следующие функции: Рассчитывает просадку депозита по эквити и отправляет сообщение пользователю, если она больше, чем указана в настройках. Отправляет уведомление о просадк
                      FREE
                      Are you tired of drawing trendlines every time you're analyzing charts? Or perhaps you would like more consistency in your technical analysis. Then this is for you. This indicator will draw trend lines automatically when dropped on a chart. How it works Works similar to standard deviation channel found on mt4 and mt5. It has 2 parameters: 1. Starting Bar 2. Number of bars for calculation The   starting bar   is the bar which drawing of the trend lines will begin, while the   number of bars for c
                      FREE
                      OrderBlock TS Roman
                      Vladislav Vlastovskii
                      4 (7)
                      Индикатор строит блоки заказов (БЗ) по торговой системе (ТС) Романа. Поиск блоков осуществляется одновременно на двух таймфремах: текущем и старшем (определяемым в настройках). Для оптимизации и игнорирования устаревших блоков в настройках задается ограничение количества дней в пределах которых осуществляется поиск блоков. Блоки строятся по правилам ТС состоящем из трех шагов: какую свечу вынесли (что?); какой свечой вынесли (чем?); правило отрисовки (как?).
                      FREE
                      Download the free version   here. Divergence Divergence refers to when the price of a currency pair moves in one direction while the trend indicator is moving in the opposite direction. With divergence, there can be positive and negative signals. Divergences in Forex trading are quite common signals of technical analysis. These are basic early Forex signals indicating the trend reversal and filter false signals. Application of this indicator It is usually not easy to detect divergences by the t
                      FREE
                      Ловец трендов: Стратегия Ловец трендов с индикатором оповещения - это универсальный инструмент технического анализа, который помогает трейдерам определять рыночные тренды и потенциальные точки входа и выхода. Он представляет собой динамичную стратегию Ловец трендов, адаптирующуюся к рыночным условиям для четкого визуального представления направления тренда. Трейдеры могут настраивать параметры в соответствии со своими предпочтениями и уровнем риска. Индикатор помогает в идентификации тренда,
                      FREE
                      Данный сканер показывает значения тренда известного индикатора SuperTrend для множества инструментов (до 30) и 8 таймфреймов. Уведомляет о смене направления тренда в терминале MetaTrader 4, по email и push-уведомлением. Это бесплатная версия индикатора SuperTrend Scanner Бесплатная версия работает только на EURUSD и GBPUSD! Важная информация Для максимального использования потенциала сканера прочитайте полное описание (на английском языке): www.mql5.com/en/blogs/post/718074 Бесплатная версия
                      FREE
                      Ppr PA
                      Yury Emeliyanov
                      4 (1)
                      "Ppr PA" – это уникальный технический индикатор, созданный для выявления паттернов " PPR " на валютных графиках торговой платформы МТ4. Эти паттерны могут указывать на возможные развороты или продолжения тренда, предоставляя трейдерам ценные сигналы для входа в рынок. Особенности: Автоматическое Обнаружение PPR: Индикатор автоматически идентифицирует и отмечает паттерны PPR стрелками на графике. Визуальные Сигналы: Зеленые и красные стрелки обозначают оптимальные точки для покупки и продажи соот
                      FREE
                      Trend arrow Indicator
                      NGUYEN NGHIEM DUY
                      3.23 (13)
                      Trend arrow Indicator is an arrow Indicator used as an assistant tool for your trading strategy. The indicator analyzes the standard deviation of bar close for a given period and generates a buy or sell signals if the deviation increases. It good to combo with Martingale EA to follow Trend and Sellect Buy Only/Sell Only for EA work Semi-Automatic. You can use this  Indicator with any EAs in my Products.
                      FREE
                      Данный индикатор создан для поиска предполагаемых разворотных точек цены символа. В его работе используется небольшой разворотный свечной паттерн в совокупности с фильтром экстремумов. Индикатор не перерисовывается! В случае отключения фильтра экстремумов, индикатор показывает все точки, в которых есть паттерн. В случае включения фильтра экстремумов, работает условие – если в истории на Previous bars 1 свечей назад, были более высокие свечки и они дальше чем свеча Previous bars 2 – то тогда тако
                      FREE
                      Pivot Mean Oscillator (PMO) is a unbounded zero-centered oscillator that provides a quick and normalized measure of divergence between two spreads. Detailed description of the mathematical formulation along with some comments and experiments can be found in this article .  Trading aspects This version of PMO is tuned on spreads relative to Close and Open price signals against their cumulative moving average (CMA). Positive PMO(m,n) values means that last (normalized) m Close prices are higher
                      FREE
                      Signals and Alerts for Accelerator/Decelerator indicator based on these MQL5 posts: Accelerator Oscillator and Signals of the Indicator Accelerator Oscillator . Note : this tool is based on the code of Accelerator indicator developed by MetaQuotes Software Corp. Features The signals are triggered at   closing   of last bar/opening of a new bar; Any kind of alerts can be enabled: Dialog Box, Email message, SMS notifications for smartphones and tablets, and Sound alerts; Customizable arrows. By
                      FREE
                      This classic "old school" MAGIC MACD indicator gives you the cross of the parameters you set. Standart setting is (12,26,9) . The arrows give you a possible change of trend. Be careful and do not use this indicator as a single signal source. FREE version  Please feel free to check out our other REX indicator series. We do have other free indicators.     "OLD BUT GOLD"
                      FREE
                      Sm Ichimoku Scanner
                      Steeve Christian Martol
                      5 (6)
                      Multi Time Frame Indicator acts as a Scanner based on the Ichimoku Trading System. The outcome is displayed on a board. This helps you to make "at a glance" a mental picture of the System without having to open the chart. Up to 10 Currencies can be watched. Scanned elements And Legend "KUMO Futur" - Green : The Kumo Futur is Bullish. "KUMO Futur" - Red : The Kumo Futur is Bearish. "PRICE Cross KJ" - Green : The Price is Above the Kijun Sen.  "PRICE Cross KJ" - Red : The Price is Below the Kijun
                      FREE
                      This trial scanner works with the other "Smart Market Structure Opportunity Scanner", and is basically an extension of that scanner with added features to find more accurate entry opportunities for day trading or refined swing trading.  The most important added features are:  1) The ADRs ( Average Daily Range ) for the last 5 days would have color and  +/- sign that shows the direction of each days ADR     move.  2) I added RSI values for each of the trading timeframes ( 1min, 5min, 15min, 30min
                      FREE
                      Профессиональный инструмент для торговли  - индикатор дивергенции между RSI и ценой, позволяющий своевременно получать сигнал о развороте тренда или ловить движения откатов цены (в зависимости от настроек). Настройки индикатора позволяют регулировать силу дивергенции за счет угла наклона пиков RSI и процентного изменения цены, что даёт возможность тонко настроить силу сигнала. Код индикатора оптимизирован и в составе советника очень быстро тестируется.  Индикатор не перерисовывает, стрелки для н
                      FREE
                      Профессиональный инструмент для торговли  - индикатор дивергенции между RSI и ценой, позволяющий своевременно получать сигнал о развороте тренда или ловить движения откатов цены (в зависимости от настроек). Настройки индикатора позволяют регулировать силу дивергенции за счет угла наклона пиков RSI и процентного изменения цены, что даёт возможность тонко настроить силу сигнала. Код индикатора оптимизирован и в составе советника очень быстро тестируется.  Индикатор не перерисовывает, стрелки для
                      FREE
                      ZigZag Fibo Retracement Indicator Optimize Your Trading Strategy! Are you seeking to optimize your trading strategy in the financial markets? Explore the unique features of the ZigZag Fibo Retracement Indicator, a powerful tool designed to help you identify potential support and resistance levels based on the combination of ZigZag patterns and Fibonacci ratios. Integration of ZigZag Patterns and Fibonacci: The ZigZag Fibo Retracement Indicator combines the effectiveness of ZigZag patterns, helpi
                      FREE
                      С этим продуктом покупают
                      Gann Made Easy - это профессиональная, но при этом очень простая в применении Форекс система, основанная на лучших принципах торговли по методам господина У.Д. Ганна. Индикатор дает точные BUY/SELL сигналы, включающие в себя уровни Stop Loss и Take Profit. Пожалуйста, напишите мне после покупки! Я поделюсь своими рекомендациями по использованию индикатора. Также вас ждет отличный бонусный индикатор в подарок! Вероятно вы уже не раз слышали о торговли по методам Ганна. Как правило теория Ганна от
                      Прежде всего стоит подчеркнуть, что этот торговый индикатор не перерисовывается, не перерисовывает и не отставает, что делает его идеальным как для ручной, так и для роботизированной торговли. Атомный аналитик - это индикатор ценового действия PA, который использует силу и импульс цены, чтобы найти лучший край на рынке. Оборудованный расширенными фильтрами, которые помогают убирать шумы и ложные сигналы, и повышают торговый потенциал. Используя несколько слоев сложных индикаторов, Атомный анали
                      Gold Stuff
                      Vasiliy Strukov
                      4.89 (250)
                      Gold Stuff - трендовый индикатор, разработанный специально для золота, также может использоваться на любых финансовых инструментах. Индикатор не перерисовывается и не запаздывает. Рекомендуемый тайм-фрейм H1.  По данному индикатору написан советник EA Gold Stuff, Вы можете найти его в моем профиле. Свяжитесь со мной сразу после покупки для получения   персонального бонуса! Настройки и мануал  здесь ПАРАМЕТРЫ Draw Arrow - вкл.выкл. отрисовку стрелок на графике. Alerts - вкл.выкл.звуковые оповещен
                      В НАСТОЯЩЕЕ ВРЕМЯ СКИДКА 26% Лучшее решение для новичка или трейдера-эксперта! Этот индикатор является уникальным, высококачественным и доступным торговым инструментом, поскольку мы включили в него ряд собственных функций и новую формулу. С помощью всего лишь ОДНОГО графика вы можете определить силу валюты для 28 пар Форекс! Представьте, как улучшится ваша торговля, потому что вы сможете точно определить точку запуска нового тренда или возможность скальпирования? Руководство пользователя:
                      Scalper Vault — это профессиональная торговая система, которая дает вам все необходимое для успешного скальпинга. Этот индикатор представляет собой полную торговую систему, которую могут использовать трейдеры форекс и бинарных опционов. Рекомендуемый тайм фрейм М5. Система дает точные стрелочные сигналы в направлении тренда. Она также предоставляет вам сигналы выхода и рассчитывает рыночные уровни Ганна. Индикатор дает все типы оповещений, включая PUSH-уведомления. Пожалуйста, напишите мне после
                      Trend Screener
                      STE S.S.COMPANY
                      4.83 (86)
                      Индикатор тренда, революционное уникальное решение для торговли и фильтрации тренда со всеми важными функциями тренда, встроенными в один инструмент! Это 100% неперерисовывающийся мультитаймфреймный и мультивалютный индикатор, который можно использовать на всех инструментах/инструментах: форекс, товары, криптовалюты, индексы, акции. Trend Screener - это эффективный индикатор, следующий за трендом, который выдает сигналы тренда в виде стрелок с точками на графике. Функции, доступные в индикаторе
                      TPSpro TRENDPRO   —  трендовый индикатор, который автоматически анализирует рынок и предоставляет информацию о тренде и каждой его смене а также дающий сигналы для входа в сделки без перерисовки! Индикатор использует каждую свечу, анализируя их отдельно. относя к разным импульсам – импульс вверх или вниз. Точные точки входа в сделки  для  валют, крипты, металлов, акций, индексов! -  Version MT5                   ПОЛНОЕ ОПИСАНИЕ          /        СЕТАПЫ ДЛЯ ТОРГОВЛИ                        Реком
                      Представляем       Индикатор Quantum Trend Sniper   , инновационный индикатор MQL5, который меняет способ определения разворотов тренда и торговли ими! Разработан командой опытных трейдеров со стажем торговли более 13 лет,       Снайперский индикатор Quantum Trend       разработан, чтобы вывести ваше торговое путешествие на новые высоты благодаря инновационному способу определения разворотов тренда с чрезвычайно высокой точностью. ***Купите индикатор Quantum Trend Sniper и получите индикатор
                      Прежде всего стоит подчеркнуть, что этот Торговый Инструмент является Неперерисовывающимся Нерепейнтинговым Индикатором, что делает его идеальным для профессиональной торговли. Индикатор Концепций Умного Действия Цены - очень мощный инструмент как для новичков, так и для опытных трейдеров. Он объединяет более 20 полезных индикаторов в одном, комбинируя передовые торговые идеи, такие как анализ Inner Circle Trader и стратегии торговли концепциями умных денег. Этот индикатор сосредотачивается н
                      Станьте Breaker Trader и получайте прибыль от изменений структуры рынка по мере изменения цены. Индикатор выключателя блока ордеров определяет, когда тренд или движение цены приближаются к истощению и готовы развернуться. Он предупреждает вас об изменениях в структуре рынка, которые обычно происходят, когда произойдет разворот или серьезный откат. Индикатор использует собственный расчет, который определяет прорывы и ценовой импульс. Каждый раз, когда новый максимум формируется около возможн
                      Инновационный индикатор, использующий эксклюзивный алгоритм для быстрого и точного определения тренда. Индикатор автоматически рассчитывает время открытия и закрытия позиций, а также подробную статистику работы индикатора на заданном отрезке истории, что позволяет выбрать наилучший торговый инструмент для торговли. Вы также можете подключить свои пользовательские стрелочные индикаторы к Scalper Inside Pro для проверки и расчета их статистики и прибыльности. Scalper Inside PRO инструкция и настро
                      Advanced Supply Demand
                      Bernhard Schweigert
                      4.92 (310)
                      Этот индикатор является уникальным, качественным и доступным инструментом для торговли, включающим в себя наши собственные разработки и новую формулу. В обновленной версии появилась возможность отображать зоны двух таймфреймов. Это означает, что вам будут доступны зоны не только на старшем ТФ, а сразу с двух таймфреймов - таймфрейма графика и старшего: отображение вложенных зон. Обновление обязательно понравится всем трейдерам, торгующим по зонам спроса и предложения. Важная информация Для мак
                      Важным ключевым элементом в трейдинге является зоны или уровни, от которых принимаются решения о покупке или продаже торгового инструмента. Несмотря на попытки крупных игроков скрыть свое присутствие на рынке, они неизбежно оставляют следы. Наша задача заключалась в том, чтобы научиться находить эти следы и правильно их интерпретировать. Первые Импульсные Уровни (ПИУ)     -      Reversal First Impulse levels (RFI)   -  Version MT5                INSTRUCTIONS                 RUS                 E
                      Откройте для себя секрет успешной торговли форекс с нашим пользовательским индикатором MT4! Задумывались ли вы, как добиться успеха на рынке Forex, постоянно зарабатывая прибыль при минимизации риска? Вот ответ, который вы искали! Позвольте нам представить наш собственный индикатор MT4, который будет революционизировать ваш подход к торговле. Уникальная универсальность Наш индикатор специально разработан для пользователей, которые предпочитают формирования свечей Renko и Rangebar. Мы пони
                      TrendMaestro
                      Stefano Frisetti
                      5 (2)
                      note: this indicator is for METATRADER4, if you want the version for METATRADER5 this is the link: TRENDMAESTRO recognizes a new TREND in the bud, he never makes mistakes. The certainty of identifying a new TREND is priceless. DESCRIPTION TRENDMAESTRO identifies a new TREND in the bud, this indicator examines the volatility, volumes and momentum to identify the moment in which there is an explosion of one or more of these data and therefore the moment in which prices have strong probability of f
                      В настоящее время скидка 20%! Лучшее решение для новичка или трейдера-эксперта! Эта приборная панель работает на 28 валютных парах. Он основан на 2 наших основных индикаторах (Advanced Currency Strength 28 и Advanced Currency Impulse). Он дает отличный обзор всего рынка Forex. Он показывает значения Advanced Currency Strength, скорость движения валюты и сигналы для 28 пар Forex на всех (9) таймфреймах. Представьте, как улучшится ваша торговля, когда вы сможете наблюдать за всем рынком с пом
                      Представляем удивительный форекс-индикатор "Miraculous": раскройте силу точного трейдинга Вы устали от бесконечного поиска лучшего форекс-индикатора, который действительно доставляет исключительные результаты на всех таймфреймах? Не ищите дальше! Представляем вам форекс-индикатор "Miraculous", который пришел, чтобы изменить ваш опыт трейдинга и поднять ваши прибыли на новый уровень. Основанный на передовых технологиях и годам тщательной разработки, форекс-индикатор "Miraculous" является вершиной
                      МУЛЬТИВАЛЮТНАЯ И МНОГОТАЙМФОРМНАЯ ПОКУПКА И ПРОДАЖА. АВТОМАТИЧЕСКИЙ ТРЕЙЛИНГ-СТОП И ВОЗНАГРАЖДЕНИЕ ЗА РИСК ТЕЙКПРОФИТ! ИНДИКАТОР СКАНИЗИРУЕТ И АНАЛИЗИРУЕТ РЫНОК, ТАК ЧТО ВАМ НЕЧЕГО ДЕЛАТЬ! ТОРГУЙТЕ ВСЕМИ ВАЛЮТАМИ НА ОДНОМ ГРАФИКЕ!   После покупки оставьте комментарий, свяжитесь со мной и я пришлю вам советника по торговле. Индикатор использует несколько осцилляторов и прикрепленных к ним фильтров для поиска лучших ПОДТВЕРЖДЕННЫХ точек входа, поэтому вам не нужно об этом беспокоиться! Он п
                      Топовый индикатор МТ4, дающий сигналы для входа в сделки без перерисовки! Идеальные точки входа в сделки   для  валют, крипты, металлов, акций, индексов !  Смотрите  видео  (6:22) с примером отработки всего одного сигнала, окупившего индикатор. Версия индикатора для MT5 Преимущества индикатора Сигналы на вход без перерисовки Если сигнал появился, он никуда НЕ исчезает! В отличие от индикаторов с перерисовкой, которые ведут к потере депозита, потому что могут показать сигнал, а потом убрать его.
                      Этот индикатор невозможно остановить в сочетании с другим нашим индикатором под названием Katana. После покупки напишите нам сообщение и вы сможете получить Katana БЕСПЛАТНО в качестве БОНУСА! Цена скоро увеличится до $149! Не пропустите это выгодное предложение за 65 долларов! Индикатор «Прогнозирование тренда» — это уникальный и простой инструмент, который позволяет прогнозировать будущее движение цен на основе сигналов, генерируемых MACD. Это поможет вам оценить области, в которых цена мож
                      Представляем       Quantum Breakout PRO   , новаторский индикатор MQL5, который меняет ваш способ торговли в зонах прорыва! Разработанная командой опытных трейдеров с опытом торговли более 13 лет,   Quantum Breakout PRO   предназначена для того, чтобы вывести ваше торговое путешествие на новые высоты благодаря своей инновационной и динамичной стратегии зон прорыва. Quantum Breakout Indicator покажет вам сигнальные стрелки на зонах прорыва с 5 целевыми зонами прибыли и предложением стоп-лос
                      PRO Renko System - это высокоточная система торговли на графиках RENKO. Система универсальна. Данная торговая система может применяться к различным торговым инструментам. Система эффективно нейтрализует так называемый рыночный шум, открывая доступ к точным разворотным сигналам. Индикатор прост в использовании и имеет лишь один параметр, отвечающий за генерацию сигналов. Вы легко можете адаптировать алгоритм к интересующему вас торговому инструменту и размеру ренко бара. Всем покупателям с удовол
                      Получайте ежедневную информацию о рынке с подробностями и скриншотами через наш утренний брифинг здесь, на mql5 , и в Telegram ! FX Power MT4 NG - это новое поколение нашего популярного измерителя силы валют FX Power. Что же предлагает этот измеритель силы нового поколения? Все, что вы любили в оригинальном FX Power ПЛЮС Анализ силы GOLD/XAU Еще более точные результаты расчетов Индивидуально настраиваемые периоды анализа Настраиваемый предел расчета для еще более высокой производительности Спец
                      Break & Retest неудержим, когда объединен с нашим другим индикатором расхождений. После покупки отправьте нам сообщение, и вы сможете получить этот второй индикатор БЕСПЛАТНО в качестве бонуса. После многих месяцев тяжелой работы и преданности мы с гордостью представляем вам наш индикатор действий цены Break and Retest, созданный с нуля. Один из самых сложных индикаторов, который мы создали, содержит более 1400 строк кода! Основная идея нашей стратегии Break and Retest заключается в том, ч
                      СЕЙЧАС СКИДКА 31% !!! Лучшее решение для новичка или трейдера-эксперта! Этот индикатор является уникальным, высококачественным и доступным торговым инструментом, поскольку мы включили в него ряд собственных функций и секретную формулу. Всего на ОДНОМ графике он выдает алерты по всем 28 валютным парам. Представьте, как улучшится ваша торговля, ведь вы сможете точно определить точку запуска нового тренда или возможность скальпирования! Построенный на новых базовых алгоритмах, он позволяет е
                      TrendDecoder Premium
                      Christophe, Pa Trouillas
                      5 (3)
                      Определите диапазоны и следующие вероятные движения   |  Получите самые ранние сигналы и силу трендов   |  Получите четкие выходы перед разворотом   |  Определите уровни Фибо, которые будет тестировать цена Индикатор без перерисовки и задержек - идеально подходит для ручной и автоматической торговли - подходит для всех активов и всех временных единиц Ограниченное предложение >>   50% OFF После покупки пожалуйста, свяжитесь с моим каналом  для получения рекомендуемых настроек Версия   МТ5 :   кли
                      Индикатор разворота ADR сразу показывает, где в настоящее время торгуется цена относительно своего нормального среднего дневного диапазона. Вы будете получать мгновенные оповещения через всплывающие окна, электронную почту или push-уведомления, когда цена превышает свой средний диапазон и уровни выше него по вашему выбору, чтобы вы могли быстро переходить к откатам и разворотам. Индикатор рисует на графике горизонтальные линии на экстремумах среднего дневного диапазона, а также расширения выше
                      Currency Strength Wizard — очень мощный индикатор, предоставляющий вам комплексное решение для успешной торговли. Индикатор рассчитывает силу той или иной форекс-пары, используя данные всех валют на нескольких тайм фреймах. Эти данные представлены в виде простых в использовании индексов валют и линий силы валют, которые вы можете использовать, чтобы увидеть силу той или иной валюты. Все, что вам нужно, это прикрепить индикатор к графику, на котором вы хотите торговать, и индикатор покажет вам ре
                      Индикатор обнаруживает гармонические паттерны, которые строятся на графике с помощью ручных и автоматических методов. Руководство пользователя доступно по этой ссылке: Add Your review And contact us to get it Это бесплатная версия продукта. Вы можете использовать его для обнаружения паттернов Gartley и Nenstar: https://www.mql5.com/ru/market/product/30181 Примечания Если вы используете Windows 10, нажмите на иконку MetaTrader правой кнопкой мыши > "Совместимость" > "Переопределите режим масш
                      FX Volume
                      Daniel Stein
                      4.6 (35)
                      Получайте ежедневную информацию о рынке с подробностями и скриншотами в нашем утреннем брифинге здесь, на mql5 , и в Telegram ! FX Volume - это ПЕРВЫЙ и ЕДИНСТВЕННЫЙ индикатор объема, который дает РЕАЛЬНОЕ представление о настроении рынка с точки зрения брокера. Он дает потрясающее представление о том, как институциональные участники рынка, такие как брокеры, позиционируют себя на рынке Forex, гораздо быстрее, чем отчеты COT. Видеть эту информацию прямо на своем графике - это настоящий геймчей
                      Другие продукты этого автора
                      SensorMap
                      Juergen Thielen
                      5 (1)
                      Concept Market arranges in Time upcoming Phases according to the present Results of its Interest. Directing Modulations are an Interaction of immanent Periods, which show in Reference to Time cyclic Activity and to Price leveling Activity. SensorMap is a reflecting Volume Mask of this Concept of Time and Price and apportioning developed Price Movements in an equalized 100 % - Range: how far moved ? indicating their Status by marking special Events: when which Action ? setting the Situation in
                      FREE
                      Фильтр:
                      Daniel
                      875
                      Daniel 2023.07.26 17:01 
                       

                      Ich schaue mir beide Indis von dir mal an, Optik und Ausführung perfekt, mal schauen wie ichdamit zurecht komme. Erstmal vielen dank für die Indis und die Arbeit.

                      Jamie Daniel Thompson
                      263
                      Jamie Daniel Thompson 2023.06.22 14:43 
                       

                      Extremely useful and incredible tool! I don't understand how this doesn't have 5 star reviews yet! It has totally changed the accuracy of my entries! Thanks to the author!

                      Ответ на отзыв
                      Версия 3.7 2023.04.16
                      Integration of the TickEvent News-Addon, no further Changes
                      Версия 3.6 2023.04.10
                      final Pixelwork on the Phase-Propeller, no further Changes.
                      Версия 3.5 2023.03.14
                      extended by Single-Pivot Option
                      Версия 3.4 2023.03.12
                      Taken out redundant Pivot-Adjustment (H4) and extended by Time-Adjustment Server-Terminal
                      Версия 3.3 2023.03.09
                      aligned/ defined/ extended/ finalized/ homologized/ completed
                      Версия 3.2 2022.12.20
                      The Bull-Bear-Propeller received an indicational update and prints now the Propeller-Status instead of the actual period-direction..
                      Версия 3.1 2022.12.19
                      PØINTZERØ SENSØRMAP is now splitted in two separate partial indicators, independent of each other working, standalone functional, fully enfolding their power by combination.

                      PØINTZERØ >+< PRØJECTØR: oscillating absolute Pricechart relating the functional categories (main)
                      SENSØRMAP <+> REFLECTØR: equalized relative Timechart alternating the categorized functions (sub)

                      If you want to have a Visual of the complete PØINTZERØ SENSØRMAP, please save a SENSØRMAP-Template as Tester-Template (tester.tpl) in templates-folder.
                      Of course you should load the indicator in advance ;-)

                      Merry christmas world!
                      Версия 3.0 2022.11.26
                      major update v 3.0
                      Версия 2.9 2022.11.21
                      faster and better than planned.. observation is the only functioning technique!
                      Версия 2.8 2022.11.17
                      if I wouldn't love what I do, I wouldn't do what I do.. PIV-color-setup now functional.. H4 reimplemented - no daytrading without it.. now with a clear conscience..
                      Версия 2.7 2022.11.17
                      functionality of Navi-News-Panel adjusted and sudden period-counting-typo corrected.. patience always gets rewarded..
                      Версия 2.6 2022.11.17
                      with this last update for this year everything is brought into the right light. compose and develop markets image as variable as market is driven. HAIRCROSS and enabled TOOL answer most of initial/ orientational questions. I wish nice holidays!
                      Версия 2.5 2022.11.17
                      PEN-rotor_stator now Trendline instead of txt-object //dismissed PIV<D1 // optimized PEN-Trace-Trend-Logic: Trace= dark/ Trend= bright : this way realistic price-action-mirroring // dismissed obsolete variables , some household and freshing cosmetics - imaging sharper every update..//
                      Версия 2.4 2022.11.16
                      the spread-level-warn-display had to be corrected..
                      Версия 2.3 2022.11.16
                      final touches and cosmetics..
                      Версия 2.2 2022.11.14
                      simplified visual, any effort is dedicated to optimized functionality..
                      Версия 2.1 2022.11.13
                      poets on coding serials..interst stands in front of discovery.
                      Версия 2.0 2022.11.09
                      adjusted the speed-display to directional colors, now makes sense ;-)
                      Версия 1.9 2022.11.09
                      some further internal optimizations..
                      Версия 1.8 2022.11.07
                      update to new MT4 Terminal-version 4.00 build 1363 03 Nov 2022, it comes with several internal optimizations..
                      Версия 1.7 2022.11.03
                      color correction corner 3, apart from that conflict-free presentation today..
                      Версия 1.6 2022.11.03
                      minor graphical definitions - mismatches cleared - no further irregularities discovered.. stable and vivid.. here go
                      Версия 1.5 2022.11.01
                      the value of a calibration one can measure in signals, which accomplish to pass revision tests by being such rare that any revision would take days..
                      Версия 1.4 2022.11.01
                      there is always potential to optimize.. redundants cleared..
                      Версия 1.3 2022.10.30
                      with one last minor graphical correction this now awaits to become discovered by you
                      Версия 1.2 2022.10.30
                      the winter-time-change cheated the last update - corrected + goddie for wintertime :-)
                      Версия 1.1 2022.10.30
                      Functional Implematation of the Rotor-Stator-Function via Bull and Bear, obsolete code cleaned and graphics and visuals defined