• Обзор
  • Отзывы
  • Обсуждение

BalanceCurve

1. What is this

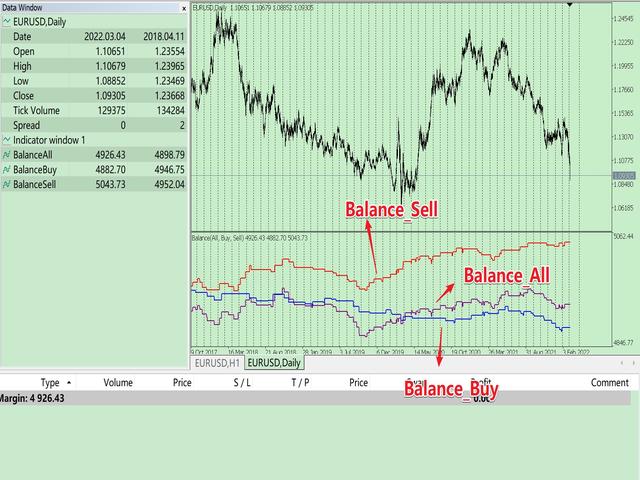
This is a tool used to display the balance curve in real time. The historical orders of the MT5 software are only tabular, and it looks troublesome when you have a lot of orders. This program can draw your historical trading orders in the form of a capital curve graph. This way you can see at a glance how well you are trading and where you are going wrong.

At the same time, although the MT5 strategy backtest has a capital curve, it does not match the price one by one. So it is very troublesome to use. This program makes the price curve match the capital curve one by one, which is very convenient to use.

2. Features

  • You can draw your historical trading orders in the form of a capital curve chart, which can draw different capital curves according to different time frames.
  • It can be used for strategy backtesting to show how your EA strategy is doing in real time.
  • It is divided into three funding curves. One is for only showing long position, one is for showing only short position, and one is for including all.
  • Programming in the form of indicators does not affect the overlay of other EAs or indicators.

3. Parameter description

  • InitDeposit = 5000; // Initial Deposit
  • Inp_StartTime = 0; // History start time, 0 - all time
  • Inp_ProfitNorm = false; // Is corrected position to 1.0 lots, default false.
  • Inp_Symbol = NULL; // Select Symbol, default is all symbols.

4. How to use

Just load it directly on the chart.

Here's how to use it in strategy backtesting, both of the following methods will work:

  • a. Load the following code into OnInit() of your EA, it will automatically load the indicator in the history test. First you have to copy the program to the Indicator directory.
    //---First you have to copy the program to the Indicator directory.
    iCustom(_Symbol, _Period, "BalanceCurve", 5000, 0, false);
  • b. Save the indicator to the template, and then load the template in the strategy backtest.



Рекомендуем также
ET9 New on the Market, Launch promo! Only a few copies left at: $599 Next price: $799 Final price: $1599 The Best Expert Advisor  on   XAUUSD   any timeframes , It can also be used on GBPUSD at the same time! ET9  for MT5 Updated v4.20 !!      Important update: Enable automatic closing of profits,  Various parameters of the ET1 strategy can be modified, Optimized the stability of ET1 strategy Include Free ET1 for MT5:  https://www.mql5.com/en/market/product/113131 Dragon Ball MT5 Updated v1.30
Trend Trading - это индикатор, предназначенный для получения максимальной прибыли от трендов, происходящих на рынке, путем определения времени отката и прорыва. Он находит торговые возможности, анализируя, что делает цена во время установленных тенденций. [ Руководство по установке | Руководство по обновлению | Устранение неполадок | FAQ | Все продукты ] Торгуйте на финансовых рынках с уверенностью и эффективностью Прибыль от устоявшихся тенденций без проволочек Признать прибыльные откаты,
Before installing the HeatMap indicator make sure you are using a broker that gives you access to the Depth of market (DOM) !! This indicator creates a heatmap on your chart allowing you to see the buy or sell limit orders easily and in real time. You have the possibility to change the setting and the colors of the HeatMap in order to adapt to all markets and all charts. Here is an example of a setting you can use with the NASDAQ100 on the AMPGlobal broker :  https://www.youtube.com/watch?v=x0
KT Renko Patterns MT5
KEENBASE SOFTWARE SOLUTIONS
KT Renko Patterns scans the Renko chart brick by brick to find some famous chart patterns that are frequently used by traders across the various financial markets. Compared to the time-based charts, patterns based trading is easier and more evident on Renko charts due to their uncluttered appearance. KT Renko Patterns features multiple Renko patterns, and many of these patterns are extensively explained in the book titled Profitable Trading with Renko Charts by Prashant Shah. A 100% automate
Индикатор кумулятивной дельты Как считает большинство трейдеров, цена движется под давление рыночных покупок или продаж. Когда кто-то выкупает стоящий в стакане оффер, то сделка проходит как "покупка". Если же кто-то наливает в стоящий в стакане бид - сделка идет с направлением "продажа". Дельта - это разница между покупками и продажами. А кумулятивная дельта - разница между покупками и продажами накопленным итогом за определенный период времени. Она позволяет видеть, кто в настоящий момент конт
Прежде всего стоит подчеркнуть, что этот торговый индикатор не перерисовывается, не перерисовывает и не отставает, что делает его идеальным как для ручной, так и для роботизированной торговли. Атомный аналитик - это индикатор ценового действия PA, который использует силу и импульс цены, чтобы найти лучший край на рынке. Оборудованный расширенными фильтрами, которые помогают убирать шумы и ложные сигналы, и повышают торговый потенциал. Используя несколько слоев сложных индикаторов, Атомный анали
Советник Auto Trade Copier предназначен для копирования сделок на нескольких счетах/терминалах MetaTrader 4/MetaTrader 5 со 100% точностью. С помощью этого инструмента вы можете выступать как в роли поставщика (источник), так и получателя (назначение). Все торговые действия будут скопированы от поставщика к получателю без задержки. Ссылки: Если копирование производится через Интернет, посмотрите продукт Trade Copier Pro MT5 по ссылке: https://www.mql5.com/ru/market/product/5531 Если копирование
| Fully-automated Smart Money Concept (ICT) inspired trading solution with multi-strategy capabilities | Built by a grid trader >> for grid traders.  This is MT5 version, click  here  for  Blue CARA MT4  (settings and logics are same in both versions)     Real monitoring signal  -->  Cara Gold Intro Blue CARA EA   ('CARA') - short for  C omprehensive  A lgorithmic   R esponsive   A dvisor is a next-gen  multi-currency    multi-timeframe  EA base on the widely known (and perhaps the most popul
Premium level - это уникальный индикатор с точностью правильных прогнозов  более 80%!  Данный индикатор тестировался более двух месяцев лучшими Специалистами в области Трейдинга!  Индикатор авторский такого вы больше не где не найдете!  По скриншотах можете сами увидеть точностью данного инструмента!  1 отлично подходит для торговли бинарными опционами со временем экспирации на 1 свечу. 2 работает на всех валютных парах, акциях, сырье, криптовалютах Инструкция: Как только появляется красная стре
Торговая панель предназначена для управлением ордерами – как открытые с помощью кнопок так и открытые пользователем. Проста и удобна в использовании. Дополнит любую стратегию.  Я рекомендую использовать в паре с   Gold Stuff   индикатором.  Позволяет торговать как одиночными ордерами так и строить сетку с дистанцией. Чтобы отключить построение сетки просто поставьте большую дистанцию, например 10000.  Для работы торговой панели нужен хеджевый тип счета  Результаты в реальном времени можно пос
For a trader, trend is our friend. This is a trend indicator for MT5, can be used on any symbol. just load it to the terminal and you will see the current trend. green color means bullish trend and red means bearlish trend. you can also change the color by yourself when the indicator is loaded to the MT5 terminal the symbol and period is get from the terminal automaticly. How to use: I use this trend indicator on 2 terminals with different period  for the same symbol at same time. for example M5
Surf Board
Mohammadal Alizadehmadani
Benefits of the Surfboard indicator : Entry signals without repainting If a signal appears and is confirmed, it does NOT disappear anymore, unlike indicators with repainting, which lead to major financial losses because they can show a signal and then remove it. perfect opening of trades The indicator algorithms allow you to find the Peak and floor position to enter a deal (buy or sell an asset), which increases the success rate for each and every trader using it. Surfboard works with any asse
Профессиональный эксперт форекс   Gyroscope (для пар EURUSD, GBPUSD, USDJPY, AUDUSD, USDCHF, EURGBP, EURJPY, NZDUSD, USDCAD, EURCHF, AUDJPY, CADJPY)  ализирующий рынок при помощи индекса волн эллиота. Волновая теория Эллиотта — интерпретация процессов на финансовых рынках через систему визуальных моделей (волн) на ценовых графиках.  Автор теории Ральф Эллиотт выделил восемь вариантов чередующихся волн (из них пять по тренду и три против тренда). Движение цен на рынках принимает форму пяти вол
Description : Rainbow EA MT5 is a simple Expert advisor based on   Rainbow MT5 indicator witch is based on Moving average with period 34. The indicator is incorporated in the EA, therefore, it is not required for the EA to operate, but if you wish, you can download it from   my product page . The Expert Advisor settings are as follows : Suitable for Timeframes up to H1 The parameters below can be set according to your trading rules. StopLoss ( Stop Loss in pips) TakeProfit ( Take Profit in pi
AUTOMATIC TRADE COPIER for local *   use . (copy trades between several metatrader terminals on the local computer/ *or GLOBALLY after setting your network /server !) Can copy trades from one or   several main MT5 accounts   to several MT5 and MT4 accounts   (no limit). For MT5 to MT4 copy you have to also get version for Metatrader 4 here : https://www.mql5.com/en/market/product/80842 - very fast execution (theoretically up to 5ms delay, depends on computer speed) - user can set speed of co
Orbit Rage Final 2
BILLY ARANDUQUE ABCEDE
Note : i only sell this EA on MQL5, any other sellers is fake. Orbit Rage Final, a cutting-edge trading strategy meticulously designed around the bull/bear candle approach and divergence analysis. This powerful tool is engineered to empower you to shape the life you desire. To embark on this transformative journey, simply download and seamlessly integrate it into your MetaTrader 4 platform by placing it in the experts advisors folder. Orbit Rage Final revolutionizes trading by offering a risk-f
The relative strength index (RSI) is a popular momentum oscillator introduced in 1978. The RSI provides technical traders with signals about bullish and bearish price momentum, and it is often plotted beneath the graph of an asset's price. An asset is usually considered overbought when the RSI is above 70 and oversold when it is below 30. The Best RSI uses the input signal from the RSI indicator. Unlock the potential of the markets with The Best RSI, the fully automated and ready-to-use trading
Mine Farm
Maryna Kauzova
5 (1)
Mine Farm is one of the most classic and time-tested scalping strategies based on the breakdown of strong price levels. Mine Farm is the author's modification of the system for determining entry and exit points into the market... Mine Farm - is the combination of great potential with reliability and safety. Why Mine Farm?! - each order has a short dynamic Stop Loss - the advisor does not use any risky methods (averaging, martingale, grid, locking, etc.) - the advisor tries to ge
NEXT PRICE : $799 Monster EA X Gold is a GOLD trading expert advisor based on a strong scalping strategy in the night when the market volume is low combined with a strong trade management and execution system. Trading Strategy Monster EA X Gold  trades only on GOLD using only pending orders. It starts putting pending orders on specific times  with proper Stop Loss and Hidden Profit Booking mechanism  when the scalping strategy probability is the highest, it uses combination of linked numbers
Советник отображает обновляющийся в реальном времени график ренко для простоты технического анализа. Протестируйте на истории вашу стратегию, используя график ренко в MetaTrader 5. Параметры Box Size : размер окна. Show Wicks : при true отображать свечу с максимумом/минимумом. History Start: дата создания первой свечи. Применение Запустите советника на графике (таймфрейм M1), для которого хотите создать ренко. Введите размер окна и дату. Используйте график ренко только на M1.
Способ применения Pair Trading Station Рекомендуется использовать Pair Trading Station на таймфрейме H1 с любой валютной парой. Чтобы получить сигналы на покупку и продажу, следуйте указанным ниже инструкциям по применению Pair Trading Station в терминале MetaTrader. При загрузке Pair Trading Station на график индикатор оценит доступные исторические данные на вашей платформе MetaTrader для каждой валютной пары. В самой начале на графике отобразятся исторические данные, доступные для каждой валют
Noize Absorption Index - is the manual trading system that measures the difference of pressure between bears forces and bulls forces. Green line - is a noize free index that showing curent situation. Zero value of index shows totally choppy/flat market.Values above zero level shows how powerfull bullish wave is and values below zero measures bearish forces.Up arrow appears on bearish market when it's ready to reverse, dn arrow appears on weak bullish market, as a result of reverse expectation.
Magic EA MT5
Kyra Nickaline Watson-gordon
Magic EA is an Expert Advisor based on Scalping, Elliot Waves and with filters such as RSI, Stochastic and 3 other strategies managed and decided with the robot smartly. Large number of inputs and settings are tested and optimized and embedded in the program thus inputs are limited and very simple. Using EA doesn't need any professional information or Forex Trading Knowledge. EA can trade on all symbols and all time frames, using special and unique strategies developed by the author. The EA
Индикатор рисует сильные уровни цены (уровни консолидации цены). Построение уровней происходит с помощью 2-х индикаторов МА и 1 MACD по сложному алгоритму . Алгоритм используется в эксперте, который находится в личной эксплуатации.  Данные уровни имеют 4 варианта (цвета вариантов могут быть изменены пользователем): сильный вверх, слабый вверх, сильный вниз, слабый вниз. В свою очередь, уровень появляется всегда как правило слабый, и потом может стать сильным. Сильный уровень тоже может стать с
Утилита для автоматического управления ордерами и рисками.   Позволяет взять максимум с прибыли и ограничить свои убытки.   Создан практикующим трейдером для трейдеров.   Утилита  проста в использовании,  работает с любыми рыночными ордерами, открытыми трейдером вручную или при помощи советников. Может фильтровать сделки по магическому номеру. Одновременно утилита может работать с любым количеством ордеров.  Имеет такие функции: 1. В ыставление уровней стоплосс и тейкпрофит; 2. З акрытие сдело
Magic Finger can help you identify trends and trading opportunities clearly. The finger points to the open position signal, and the discoloration line is confirmed by the trend. If you are a day trader, you can choose to trade during a period of active trading, referring to the discoloration line as the basis for the next order, finger signal as a filter. If you are a trend trader, you can choose a period above H1, wait for the appearance of the finger signal in the key price area, and enter
This indicator uses a mathematical calculation algorithm . This algorithm calculates the remainder between the updated model and the actual values and produces the possible progress of the graph on the graph. It is not a super prophet in trading, but it is very good for the trader when entering the market and to analyze it before entering. Applicable for all currencies. Данный индикатор использует алгоритм математических вычислений . Данный алгоритм вычисляет остаток между обновленной моделью и
Awesome Oscillator Билла Уильямса с возможностью тонкой настройки и замены алгоритмов усреднения индикатора, что значительно расширяет возможности применения этого осциллятора в алгоритмическом трейдинге и приближает его по своим свойствам к такому индикатору, как MACD. Для уменьшения ценовых шумов итоговый индикатор обработан дополнительным усреднением Smooth.  Индикатор имеет возможность подавать алерты, отправлять почтовые сообщения и push-сигналы при смене направления движения осциллятора и
Santa Scalping is a fully automated Expert Advisor with no use of martingale. Night scalping strategy. The SMA indicator filter are used for entries. This EA can be run from very small accounts. As small as 50 EUR. General Recommendations The minimum deposit is 50 USD,  default settings reccomend for eurusd m5 gmt +2 . Please use max spread 10 if you will not have orders change it to -1. Use a broker with good execution and with a spread of 2-5 points. A very fast VPS is required, preferably w
Unlimited Trade Copier Pro - это мощный инструмент для удаленного копирования сделок между несколькими счетами MetaTrader 4/MetaTrader 5, расположенными удаленно друг от друга, по сети интернет. Это идеальное решение для провайдеров сигналов, которые хотят поделиться своей торговлей с другими трейдерами по всему миру. Один поставщик может копировать сделки на неограниченное количество счетов-получателей, а один получатель также может копировать сделки неограниченного количества провайдеров. Пост
С этим продуктом покупают
Trade Assistant MT5
Evgeniy Kravchenko
4.4 (172)
Помогает рассчитать риск на сделку, простая установка нового ордера с помощью линий, управление ордерами с функциями частичного закрытия, 7 типов трейлинг-стопа и другие полезные функции. Внимание приложение не работает в тестере стратегий.  Manual, Description, Download demo Функция Линии   - отображает на графике линию открытия, стоп-лосс, тейк-профит. С помощью этой функции легко установить новый ордер и увидеть его дополнительные характеристики перед открытием. Управление риском   -  
Считаете ли вы, что на рынках, где цена может измениться за доли секунды, размещение ордеров должно быть максимально упрощено? Если вы хотите создать ордер в Metatrader, вы должны открыть окно, в котором надо ввести цену открытия, stop loss и take profit, а также размер сделки. В торговле на финансовых рынках управление капиталом необходимо для сохранения и приумножения первоначального депозита. Итак, когда вы хотите разместить ордер, вы, вероятно, задаетесь вопросом, насколько крупную сделку в
Local Trade Copier EA MT5
Juvenille Emperor Limited
5 (63)
Опыт экстремально быстрого копирования сделок с помощью Local Trade Copier EA MT5 . Благодаря простой установке в течение 1 минуты этот копировщик сделок позволяет вам копировать сделки между несколькими терминалами MetaTrader на одном компьютере с Windows или на Windows VPS с крайне быстрыми скоростями копирования менее 0.5 секунды. Независимо от того, новичок вы или профессиональный трейдер, Local Trade Copier EA MT5 предлагает широкий спектр опций, чтобы настроить его под ваши конкретные п
TradePanel MT5
Alfiya Fazylova
4.86 (114)
Trade Panel — это многофункциональный торговый помощник. Приложение содержит более 50 функций для ручной торговли, и позволяет автоматизировать большую часть торговых действий. Перед покупкой вы можете протестировать Демоверсию на демо-счете. Демоверсия здесь . Полная инструкция здесь . Торговля. Позволяет совершать основные торговые операции в один клик: Открытие отложенных ордеров и позиций. Закрытие отложенных ордеров и позиций. Переворот позиций (закрыть BUY открыть SELL или закрыть SELL отк
MT5 to Telegram Signal Provider — это простой в использовании полностью настраиваемый инструмент, который позволяет отправлять определённые сигналы в чат, канал или группу Telegram, превращая вашу учётную запись в провайдера сигналов . В отличие от большинства конкурирующих продуктов, он не использует импорт DLL. [ Демо ]   [ Руководство ] [ Версия MT4 ] [ Версия для Discord ] [ Канал в Telegram ] Настройка Доступно пошаговое руководство пользователя . Никаких знаний API Telegram не требуется
The product will copy all telegram signal to MT5 ( which you are member) , also it can work as remote copier.  Easy to set up, copy order instant, can work with almost signal formats, image signal,  s upport to translate other language to English Work with all type of channel or group, even channel have "Restrict Saving Content", work with  multi channel, multi MT5 Work as remote copier: with signal have ticket number, it will copy exactly via ticket number. Support to backtest signal. How to s
Trade Manager, который поможет вам быстро входить и выходить из сделок, автоматически рассчитывая риск. Включает функции, которые помогут предотвратить чрезмерную торговлю, торговлю из мести и эмоциональную торговлю. Сделками можно управлять автоматически, а показатели эффективности счета можно визуализировать в виде графика. Эти функции делают эту панель идеальной для всех трейдеров, занимающихся ручной торговлей, и помогают улучшить платформу MetaTrader 5. Многоязычная поддержка. Версия для МТ
Strategy Builder offers an incredible amount of functionality. It combines a trade panel with configurable automation (covert indicators into an EA), real-time statistics (profit & draw down) plus automatic optimization of SL, TP/exit, trading hours, indicator inputs. Multiple indicators can be combined into an single alert/trade signal and can include custom indicators, even if just have ex4 file or purchased from Market. The system is easily configured via a CONFIG button and associated pop-u
Mentfx Mmanage mt5
Anton Jere Calmes
4.43 (7)
The added video will showcase all functionality, effectiveness, and uses of the trade manager. Drag and Drop Trade Manager. Draw your entry and have the tool calculate the rest. Advanced targeting and close portions of a trade directly available in tool (manage trades while you sleep). Market order or limit order on either side with factored spread. Just draw the entry, the tool does the rest. Hotkey setup to make it simple. Draw where you want to enter, and the stop loss, the tool calculates al
Tired of complex order placement and manual calculations? Trade Dashboard is your solution. With its user-friendly interface, placing orders becomes effortless, by a single click, you can open trades, set stop loss and take profit levels, manage trade lot size, and calculate risk to reward ratios, allowing you to only focus on your strategy. Say goodbye to manual calculations and streamline your trading experience with Trade Dashboard. Download   demo version   right now. You can find   deta
OrderManager MT5
Lukas Roth
4.88 (16)
Представляем   OrderManager : Революционный инструмент для MT5 Управляйте своими сделками как профессионал с новейшим инструментом Order Manager для MetaTrader 5. Разработанный с учетом простоты и удобства использования, Order Manager позволяет вам легко определять и визуализировать риски, связанные с каждой сделкой, что позволяет принимать обоснованные решения и оптимизировать вашу торговую стратегию. Для получения дополнительной информации о OrderManager, пожалуйста, обратитесь к руководству.
Копируйте сигналы из любого канала, участником которого вы являетесь (в том числе частного и ограниченного), прямо на свой MT5. Этот инструмент был разработан с учетом потребностей пользователей и предлагает множество функций, необходимых для управления и мониторинга сделок. Этот продукт представлен в простом в использовании и визуально привлекательном графическом интерфейсе. Настройте свои параметры и начните использовать продукт в течение нескольких минут! Руководство пользователя + Демо  |
-25% discount ($199 -> $149) Advanced trading tool: One click smart orders that execute under your conditions Developed by trader for trading community:  position size calculator (lot size), open position after price action, strategy builder, set and forget trading, mobile notifications... Risk Management -  Risk percentage position size calculator, gain percentage, target risk reward ratio, spread and commissions are included in calculations 7 Advanced order types  - Set and forget trading w
Для оплаты рублями/криптой используйте Webmoney. Задай цели для цены, а для всего остального есть HINN Lazy Trader!   Инструмент предназначен для автоматического набора позиций от заданных уровней к заданным целям. Рекомендуется использовать VPS (*) Разработан для минимизации времени, проводимым за чартом, максимизации охвата торговых идей без необходимости контролировать что-либо. Призван стать идеальным инструментом для делегирования рутины, переложить бремя принятия решения и эмоциональный
The  Easy Strategy Builder (ESB)  is a " Do It Yourself " solution that allows you to create a wide range of the automated trading strategies without any line of codes. This is the world’s easiest method to automate your strategies that can be used in STP, ECN and FIFO brokers. No drag and drop is needed. Just by set conditions of your trading strategy and change settings on desired values and let it work in your account. ESB has hundreds of modules to define unlimited possibilities of strategi
Ultimate Trailing Stop EA MT5
BLAKE STEVEN RODGER
4.57 (7)
This EA Utility allows you to manage (with advanced filtering) unlimited open orders (manual or EA) with 16 trailing stop methods: fixed, percent, ATR Exit, Chandelier Exit, Moving Average, Candle High Low Exit, Bollinger Bands, Parabolic, Envelope, Fractal, Ichimoku Kijun-Sen, Alligator, Exit After X Minutes or Bars, RSI and Stochastic. The trailing stop can be either real or virtual, and you can exit fully or with a partial close percent on touch or bar close.  Moreover, you can add (overri
MT5 to Discord Signal Provider — это удобный, полностью настраиваемый инструмент, предназначенный для отправки торговых сигналов напрямую в Discord. Этот инструмент превращает ваш торговый счет в эффективного поставщика сигналов. Настройте формат сообщений под свой стиль! Для удобства выберите из предварительно разработанных шаблонов и решите, какие элементы сообщения включить или исключить. [ Демо ] [ Руководство ] [ Версия MT4] [ Версия Telegram ] Настройка Следуйте нашему подробному пользов
-25% discount ($149 -> $111) Everything for chart Technical Analysis indicator mt5 in one tool Draw your supply demand zone with rectangle and support resistance with trendline and get alerts to mobile phone or email alert -  Risk reward indicator mt5 Video tutorials, manuals, DEMO download   here .   Find contacts on my   profile . 1.   Extended rectangles and trendlines Object will be extended to the right edge of the chart when price will draw new candles on chart. This is rectangle extend
DrawDown Limiter
Haidar, Lionel Haj Ali
5 (17)
Drawdown Limiter EA You are in the right place if you were searching for Drawdown control, Drawdown limiter, Balance protection, Equity Protection or Daily Drawdown Limit related to Prop Firm, FTMO, or Funded account trading, or if you want to protect your trading account. Have you suffered from controlling your drawdown when trading funded accounts? This EA is meant for you. Prop firms usually set a rule called “Trader Daily Drawdown”, and if it is not respected, you are disqualified.  I am an
FTMO Sniper 7
Vyacheslav Izvarin
Dedicated for FTMO and other Prop Firms Challenges 2020-2023 Trade only GOOD and checked PROP FIRMS  Default parameters for Challenge $100,000 Best results on GOLD and US100  Use any Time Frame Close all deals and Auto-trading  before  US HIGH NEWS, reopen 2 minutes after Close all deals and Auto-trading  before Weekend at 12:00 GMT+3  Friday Recommended time to trade 09:00-21:00 GMT+3 For Prop Firms MUST use special  Protector  https://www.mql5.com/en/market/product/94362 ------------------
Didi Alert Needle Detector
Alexandre Tadeu Molina
5 (1)
EA DIDI Alert - Детектор игл от «АТМ Системс» Вы ищете инструмент, который поможет вам воспользоваться лучшими торговыми возможностями на финансовом рынке? Тогда вам нужно знать, что DIDI Alert - Agulhadas Detector от ATM Systems, единственный советник на рынке, который использует мощную торговую стратегию Needles Setup Диди Агиара через DIDI INDEX, имеет несколько доступных ресурсов, в отличие от любого другого советника, посвященного этой стратегии. такой полный, функциональный и практичный
Comprehensive on chart trade panel with the unique ability to be controllable from mobile as well. Plus has a library of downloadable configuration, e.g. exit rules, extra panel buttons, pending order setup and more. Please see our product video. Works with all symbols not just currency pairs. Features On chart panel plus controllable from free app for Windows, iPhone and Android Built-in script engine with library of downloadable configuration, e.g. add 'Close All Trades in Profit' button, exit
Торговая панель для торговли в один клик.  Работа с позициями и ордерами!  Торговля с  графика  или  клавиатуры  . Используя нашу торговую панель, вы можете торговать в один клик с графика и совершать торговые операции в 30 раз быстрее, чем стандартное управление MetaTrader. Автоматические расчеты параметров и функций, которые облегчают жизнь трейдеру и помогают трейдеру вести торговую деятельность намного быстрее и удобнее. Графические подсказки и полная информация о торговых сделках на графике
UTM Manager — это интуитивно понятный и простой в использовании инструмент, предлагающий быстрое и эффективное исполнение сделок. Одной из выдающихся функций является режим «Игнорировать спред», который позволяет вам торговать по цене свечей, полностью игнорируя спреды (например, позволяет торговать парами с более высокими спредами на LTF, избегая выхода из сделок из-за спреда). Еще одним ключевым аспектом UTM Manager является его уникальный локальный копировщик сделок, позволяющий гибко запуска
Grid Manual MT5
Alfiya Fazylova
4.83 (12)
Grid Manual — это торговая панель для работы с сеточными стратегиями. Утилита универсальная, имеет гибкие настройки и понятный интерфейс. Работает с сеткой ордеров не только в сторону усреднения убытков, но и в сторону наращивания прибыли. Трейдеру не нужно создавать и сопровождать сетку ордеров, это сделает утилита. Достаточно открыть ордер и Grid manual автоматически создаст ему сетку ордеров и будет сопровождать его до самого закрытия. Полная инструкция и демо-версия здесь . Основные особенно
Bots Builder Pro MT5
Andrey Barinov
4.75 (4)
Это визуальный конструктор стратегий. Единственный в своем роде. Превратите свои торговые стратегии и идеи в советники, не написав ни одной строчки кода. Создавайте файлы исходного кода mql в несколько кликов и получайте полнофункциональных советников, готовых к реальной работе, тестеру стратегий и облачной оптимизации. Вариантов для тех, кто не имеет навыков программирования и не может создавать свои торговые решения на языке MQL, очень мало. Теперь с помощью Bots Builder Pro каждый может созд
Самые продаваемые советники на рынке стоят очень дорого, и в один прекрасный день они внезапно исчезают. Это связано с тем, что одна стратегия не будет работать на рынке форекс все время. Наш продукт уникален среди всех других на MQL Marketplace, потому что наш советник имеет более 34 встроенных индикаторов, которые позволяют каждый раз добавлять больше стратегий. Вы строите свою стратегию и постоянно обновляете ее. Если одна стратегия не работает, просто постройте другую, используя только одног
Exp COPYLOT CLIENT for MT5
Vladislav Andruschenko
3.76 (17)
Trade copier for MT5 - копировщик позиций/СДЕЛОК/ордеров для МetaТrader 5  из МТ4/МТ5) Для копирования на терминал MetaTrader 5 между терминалами МТ5 - МТ5, МТ4 - МТ5  для версии COPYLOT MT5 ( или МТ4 - МТ4 МТ5 - МТ4 для версии COPYLOT MT4). Версия МT4 Полное описание +DEMO +PDF Как купить Как установить    Как получить файлы журналов   Как тестировать и оптимизировать    Все продукты от Expforex Вы также можете копировать сделки в терминал МТ4 (МТ4 - МТ4, МТ5 - МТ4):    COPYLOT CLIENT f
News Trade EA MT5
Konstantin Kulikov
4.55 (11)
Представляю полезного робота, которым пользуюсь сам уже несколько лет. Может использоваться как в полуавтоматическом, так и в полностью автоматическом режиме. Программа содержит гибкие настройки торговли на новостях экономического календаря. В тестере стратегий проверить нельзя. Только реальная работа. В настройках терминала необходимо добавить новостной сайт в список разрешенных URL. Кликните Сервис > Настройки > Советники. Поставьте галочку в "Разрешить WebRequest для следующих URL:". Добав
Exp5 Duplicator
Vladislav Andruschenko
4.71 (7)
Советник дублирует позиции на Вашем счете MetaTrader 5 , открытые Вами, другим советником или сигналом MQL. Копирует все сделки, которые открыты вручную или другим советником.  Возможность увеличивать лот сигналов. Копирует сигналы и увеличивает лот с сигналов! Увеличение лота сигналов MQL5 Поддерживает функции: свой лот при дублировании, дублировать стоплосс/тейкпрофит, использовать трейлингстоп для продублированных позиций и многое другое. Версия МТ4 Полное описание +DEMO +PDF Как купить
Другие продукты этого автора
This product can be used to synchronize multiple Charts, and each Chart can be set to a different sync mode. With this product you can better view and manipulate charts: different time frames for a single Symbol, the same time frame for multiple Symbols, system indicators for single/multiple Symbols... and more. Feature: Chart settings can be synchronized, including : background, indentation, size, etc. Multiple Chart window start times  or end times can be synchronized. Multiple Chart time f
1. Why did I develop this series of indicators I found that most traders need to use multiple time frame indicators. They usually switch time frame to see indicators. However, once the timeframe is switched, you cannot see the  corresponding relationship  between  the price in the smaller timeframe  and  the indicator in the larger timeframe . For example: if your price chart is in H1 timeframe, you can see H4, D1 and W1 indicators in H1 timeframe Chart. This is more helpful for you to find t
Do you think it's a bit cumbersome when you need to switch symbols or timeframes with mouse click? 1. What is this? This is a program that can switch symbols and timeframes with direction keys. Fast switching, very convenient, no mouse click required. For traders, one symbol with multi-timeframe charts are usually added,  you can change symbol on those charts easily. For multi-currency traders, different symbol charts are usually added, you can also change those timeframes easily. I wrote this p
This product can be used to synchronize multiple Charts, and each Chart can be set to a different sync mode. With this product you can better view and manipulate charts: different time frames for a single Symbol, the same time frame for multiple Symbols... and more. PS: The link below is the FreeDemo product, you can use it on EURUSD/XUAUSD/USDCNH symbol: https://www.mql5.com/en/market/product/38557 Feature: Chart settings  can be synchronized, including : background, indentation, size, etc.
Have you ever take a long time to watch a Symbol when the network link is not good ? Have you ever wait for a long time when you switch chart between different Symbols or different TimeFrames ? If you do long-term backtesting , Have you ever to be downloaded datas for a long time ? Yes, If there is no data in the system, those will happen.  1. What is this: Download all the Symbol data in Market Watch to the system. PS: This is not outputting data to Files. This Link go to Demo version: https:
1. What is this         Rising volatility and falling volatility are not the same, whether it is academic research or actual testing has shown this point.         The original ATR indicator is calculated by putting up and down fluctuations together. This indicator is to calculate separately the upward volatility and the downward volatility, which can better help you study the market. 2. Indicator description          There are two modes for the calculation of this indicator, as shown in the f
I see that many tools in the market deal with Position and Order in the form of operation panels. Which is loaded into a Chart in the form of an EA. However, once the operator panel EA is loaded, no other EAs can be loaded. So, I wrote the one-click operation of Position and Order as a script, so you can load other EAs and easily complete one-click operation of Trade. 1. What is this: This is a one-click script to close position order. Now you can close position tickets at high speed, for examp
I see that many tools in the market deal with Position and Order in the form of operation panels. Which is loaded into a Chart in the form of an EA. However, once the operator panel EA is loaded, no other EAs can be loaded. So, I wrote the one-click operation of Position and Order as a script, so you can load other EAs and easily complete one-click operation of Trade. 1. What is this: This is a one-click script to delete the pending order . Now you can delete pending tickets at high speed, for
Do you think it's a bit cumbersome when you need to switch symbols or timeframes with mouse click? 1. What is this? This is a program that can switch symbols and timeframes with direction keys. Fast switching, very convenient, no mouse click required. For traders, one symbol with multi-timeframe charts are usually added,  you can change symbol on those charts  easily . For multi-currency traders, different symbol charts are usually added, you can also change those timeframes easily. I wrote thi
According to trading experience: Some symbols are easy to reverse on certain days, such as Monday, or afternoon, and so on. So comparing the current price with the corresponding historical moment price is valuable. If the price coordinate system uses a logarithmic price, you will get a lot of valuable information. 1. What is this? This program can convert the symbol price and add it to your Chart. You can compare it with your major chart. The DEMO version Link: https://www.mql5.com/en/market/p
What is this: Violent trading: means sending a large number of orders to your brokerage server,  it can conduct a stress test of the trading. In this program you can run a variety of trading tests.  Now you can trade at high speed, For example 1000 orders in an instant. The Demo version's link:  https://www.mql5.com/en/market/product/38431/ Why to use: Whether manual trading or EA trading,  the status of the broker server is very important. So it is beneficial to conduct a trading stress test on
1. Why did I develop this series of indicators I found that most traders need to use multiple time frame indicators. They usually switch time frame to see indicators. However, once the timeframe is switched, you cannot see the  corresponding relationship  between  the price in the smaller timeframe  and  the indicator in the larger timeframe . For example: if your price chart is in H1 timeframe, you can see H4, D1 and W1 indicators in H1 timeframe Chart. This is more helpful for you to find t
Фильтр:
Нет отзывов
Ответ на отзыв