• Обзор
  • Отзывы (9)
  • Обсуждение (3)

SST Vwap

5
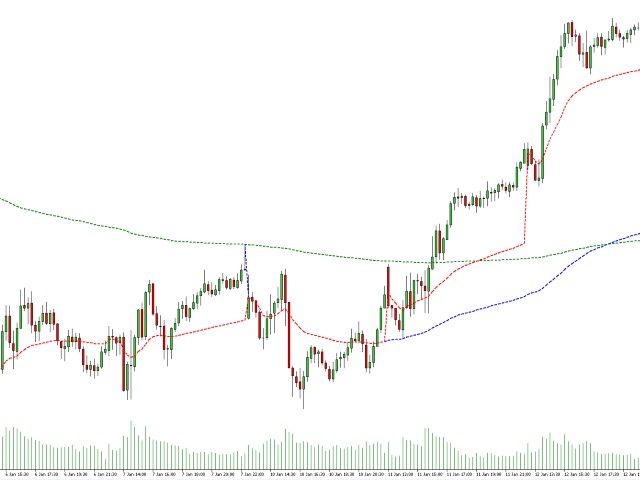
VWAP, or volume-weighted average price, helps traders and investors observe the average price that major traders consider the "fair price" for that move. VWAP is used by many institutions to set up large operations.


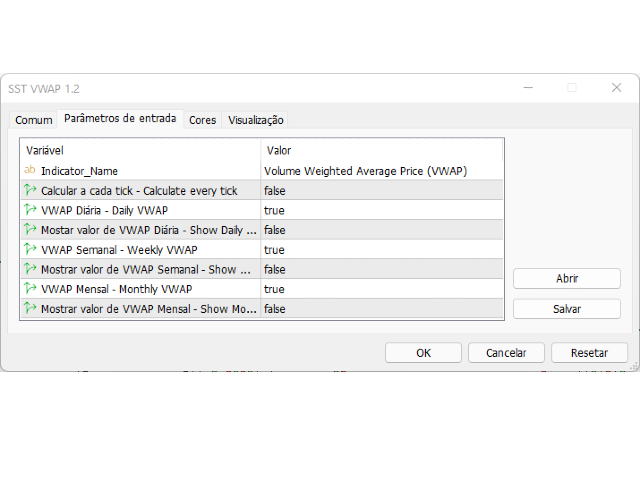
In this indicator, you can enjoy the following features:


  • Daily VWAP, with option to display your current price next to the chart
  • VWAP Weekly, with option to display your current price next to the chart
  • Monthly VWAP, with option to display your current price next to the chart

Отзывы 9
Thomas Nascimento
64
Thomas Nascimento 2023.09.25 15:57 
 

Muito bom!

E_lugao
64
E_lugao 2023.09.03 22:32 
 

Gostei muito, vai ajudar demais

João Batista Vicente
32
João Batista Vicente 2023.08.07 22:57 
 

Gostei muito.

Рекомендуем также
Value Chart Candlesticks
Flavio Javier Jarabeck
4.67 (9)
The idea of a Value Chart indicator was presented in the very good book I read back in 2020 , " Dynamic Trading Indicators: Winning with Value Charts and Price Action Profile ", from the authors Mark Helweg and David Stendahl. The idea is simple and the result is pure genius: Present candlestick Price analysis in a detrended way! HOW TO READ THIS INDICATOR Look for Overbought and Oversold levels. Of course, you will need to test the settings a lot to find the "correct" one for your approach.
FREE
Stackable VWAP
Flavio Javier Jarabeck
3.33 (6)
Volume Weighted Average Price (VWAP) is a trading benchmark commonly used by Big Players that gives the average price a Symbol has traded throughout the day. It is based on both Volume and price. Additionally we put in this indicator the MVWAP (Moving Volume Weighted Average Price). For those who do not know the usage and the importance od this indicator I recommend a great article about this subject at Investopedia ( https://www.investopedia.com/articles/trading/11/trading-with-vwap-mvwap.asp
FREE
This simple indicator paints with a darker color on the volume bar when the quantity traded is above the average of select number of periods of the volume itself, highlighting the moments when there was a large volume of deals above the average. It is also possible to use a configuration of four colors where the color tone shows a candle volume strength. The indicator defaults to the simple average of 20 periods, but it is possible to change to other types of averages and periods. If you like
FREE
Functional in the Forex market. Functional in the B3 market - Bolsa Brasil Balcão. Motivation The technical Fibonacci retraction indicator for many is essential and the basis for all market movement forecasts. The name of the tool comes from the Italian mathematician Leonardo de Pisa (13th century). This DEMO version will work in Meta Trader with Demo and Strategy Tester. To purchase the Full version that works on a Real account, click on: https://www.mql5.com/en/market/product/38089
FREE
Midas VWAP
Paulo Henrique Faquineli Garcia
4 (1)
Volume Weighted Average Price (VWAP) is a trading benchmark commonly used by Big Players that gives the average price a Symbol has traded throughout the day. It is based on both Volume and price. This indicator contains Daily VWAP and MIDAS' VWAP, which means you are able to anchor the beggining of MIDAS' calculations and, therefore you will be able to use this methodology to study price versus volume moves after anchor point. You will be able to anchor up to 3 HIGH MIDAS VWAP's and 3 LOW. Wis
FREE
Weis Waves
Flavio Javier Jarabeck
3.15 (26)
The original author is David Weis, an expert in the Wyckoff Method. The Weis Wave is a modern adaptation of the 1930's Wyckoff Method, another expert in Tape Reading techniques and Chart Analysis. Weis Waves takes market volume and stacks it into waves according to price conditions giving the trader valuable insights about the market conditions. If you want to learn more about this subject you can find tons of videos in YouTube. Just look for "The Wickoff Method", "Weis Wave" and "Volume Spread
FREE
The indicator works to convert normal volume into levels and determine financial liquidity control points. It is very similar in function to Fixed Volume Profile. But it is considered more accurate and easier to use than the one found on Trading View because it calculates the full trading volumes in each candle and in all the brokers present in MetaTrade, unlike what is found in Trading View, as it only measures the broker’s displayed prices. To follow us on social media platforms: tel
FREE
Aggression Volume
Flavio Javier Jarabeck
3.86 (21)
Aggression Volume Indicator is the kind of indicator that is rarely found in the MQL5 community because it is not based on the standard Volume data provided by the Metatrader 5 platform. It requires the scrutiny of all traffic Ticks requested on the platform... That said, Aggression Volume indicator requests all Tick Data from your Broker and processes it to build a very special version of a Volume Indicator, where Buyers and Sellers aggressions are plotted in a form of Histogram. Additionally,
FREE
Wave Box Market Frenquency
Jean Jacques Huve Ribeiro
4.83 (6)
Totally linked to the result of a movement and the duration he had. Its height records how many ticks the asset walked during a given movement, its width shows us the duration that movement had. Its configuration must be in line with the Weis Wave Indicator configuration to observe the movement force and can indicate a possible accumulation or distribution of the movement;
FREE
This indicator sums up the difference between the sells aggression and the buys aggression that occurred in each Candle, graphically plotting the waves of accumulation of the aggression volumes.   Through these waves an exponential average is calculated that indicates the direction of the business flow. Note: This indicator DOES NOT WORK for Brokers and/or Markets WITHOUT the type of aggression (BUY or SELL).   Be sure to try our Professional version with configurable features and alerts:  Agr
FREE
En esta versión, las alertas están funcionando y en la versión que publicó, la zona muerta de atr era solo una zona muerta sin atr, por lo que también la convirtió en una zona muerta de atr. Indicator input parameters   input int Fast_MA = 20;       // Period of the fast MACD moving average input int Slow_MA = 40;       // Period of the slow MACD moving average input int BBPeriod=20;        // Bollinger period input double BBDeviation=2.0; // Number of Bollinger deviations input int  Sensetiv
FREE
Super Trend eu
Emin Ulucanli
4.75 (4)
SUPERTREND ; Это индикатор следования за трендом, основанный на SuperTrend ATR, созданном Оливье Себаном. Его можно использовать для обнаружения изменений в направлении тренда и обнаружения стопов. Когда цена падает ниже кривой индикатора, она становится красной и указывает на нисходящий тренд. И наоборот, когда цена движется выше кривой, индикатор становится зеленым, указывая на восходящий тренд. Как и другие индикаторы, он хорошо работает с SuperTrend в сочетании с другими индикаторами, такими
FREE
FRB Trader - Our mission is to provide the best support to customers through conted and tools so that they can achieve the expected results FRB Support and Resistance - Indicator places lines on the chart to show Support and Resistance regions. - You can choose the timeframe you want to calculate, as well as the colors of the lines. - Algorithm calculates the points where the strengths of the asset are considered and are extremely important for decision making.
FREE
Cybertrade Keltner Channels - MT5 Created by Chester Keltner, this is a volatility indicator used by technical analysis. It is possible to follow the trend of financial asset prices and generate support and resistance patterns. In addition, envelopes are a way of tracking volatility in order to identify opportunities to buy and sell these assets. It works on periods longer than the period visible on the chart. All values ​​are available in the form of buffers to simplify possible automations.
FREE
Measures the average price and Maximum Stop Loss accepted, adjustable Measures too the projected average price (For Pending entrys), in case you have a open position and pending orders to scale in shows how much it will increase or decrease the average price after fullfilling that pending orders! It shows too the Stop Loss based on the projected average entry, how much it has to be stoped out to fullfill your risk management, after fullfilling that pending orders
FREE
Best SAR MT5
Ashkan Hazegh Nikrou
5 (1)
Описание :  мы рады представить наш новый бесплатный индикатор, основанный на одном из профессиональных и популярных индикаторов на рынке форекс (PSAR), этот индикатор является новой модификацией оригинального индикатора Parabolic SAR, в индикаторе pro SAR вы можете видеть пересечение между точками и графиком цены, это пересечение не является сигналом, а говорит о возможности окончания движения, вы можете начать покупать с новой синей точки, и разместить стоп-лосс за один атр до первой синей
FREE
MIDAS Super VWAP
Flavio Javier Jarabeck
4.29 (14)
Imagine VWAP, MVWAP and MIDAS in one place... Well, you found it! Now you can track the movement of Big Players in various ways, as they in general pursue the benchmarks related to this measuring, gauging if they had good execution or poor execution on their orders. Traders and analysts use the VWAP to eliminate the noise that occurs throughout the day, so they can measure what prices buyers and sellers are really trading. VWAP gives traders insight into how a stock trades for that day and deter
FREE
VWAP and MVWAP
Flavio Javier Jarabeck
4.17 (6)
Volume Weighted Average Price (VWAP) is a trading benchmark commonly used by Big Players that gives the average price a Symbol has traded throughout the day. It is based on both Volume and price. Additionally we put in this indicator the MVWAP (Moving Volume Weighted Average Price). For those who do not know the usage and the importance od this indicator I recommend a great article about this subject at Investopedia ( https://www.investopedia.com/articles/trading/11/trading-with-vwap-mvwap.asp )
FREE
The Weis Waves RSJ Indicator sums up volumes in each wave. This is how we receive a bar chart of cumulative volumes of alternating waves. Namely the cumulative volume makes the Weis wave charts unique. It allows comparing the relation of the wave sequence characteristics, such as correspondence of the applied force (expressed in the volume) and received result (the price progress). If you still have questions, please contact me by direct message:  https://www.mql5.com/en/users/robsjunqueira/
FREE
Necessary for traders: tools and indicators Waves automatically calculate indicators, channel trend trading Perfect trend-wave automatic calculation channel calculation , MT4 Perfect trend-wave automatic calculation channel calculation , MT5 Local Trading copying Easy And Fast Copy , MT4 Easy And Fast Copy , MT5 Local Trading copying For DEMO Easy And Fast Copy , MT4 DEMO Easy And Fast Copy , MT5 DEMO The homeopathic indicator is also called the CCI indicator. The CCI indicator was propos
FREE
CAP Channel Trading - индикатор на основе волатильности, который в своей работе использует "теорию расширенных огибающих". Эти огибающие состоят из двух внешних линий. Теория огибающих утверждает, что рыночная цена, как правило, попадает в диапазон между границами огибающей (или канала). Если цены выходят за пределы огибающей, это торговый сигнал или торговая возможность. Как торговать В основном CAP Channel Trading можно использовать для помощи при определении состояния перекупленности и пере
FREE
Calculate the Variance of prices on the chosen time frame and compare with the price range reached. Or in other words how mutch is price moving in the recent candles? Two impots: Candle = 4 (Default) number of previous candle to calculate Backward = 500 (Default) How many candle to go backward Variance is calculated as follow: Variance(X) = Average(X 2 ) – [Average(X)] 2 Subsequently Variance is rapported to the price range fo the chosen period (i.e. 4 candles) Indicator =    Variance(X) / (
FREE
Necessary for traders: tools and indicators Waves automatically calculate indicators, channel trend trading Perfect trend-wave automatic calculation channel calculation , MT4 Perfect trend-wave automatic calculation channel calculation , MT5 Local Trading copying Easy And Fast Copy , MT4 Easy And Fast Copy , MT5 Local Trading copying For DEMO Easy And Fast Copy , MT4 DEMO Easy And Fast Copy , MT5 DEMO Расширенные полосы Боллинджера: 1. Рельс Боллинджера изменит цвет в зависимости от направлен
FREE
Tabajara V5
Flavio Javier Jarabeck
4.88 (41)
Metatrader 5 version of the famous Andre Machado's Tabajara indicator. If you don't know Andre Machado's Technical Analysis work you don't need this indicator... For those who need it and for those several friend traders who asked this porting from other platforms, here it is... FEATURES 8-period Moving Average 20-period Moving Average 50-period Moving Average 200-period Moving Average Colored candles according to the inflexion of the 20-period MA SETTINGS You can change the Period of all M
FREE
Necessary for traders: tools and indicators Waves automatically calculate indicators, channel trend trading Perfect trend-wave automatic calculation channel calculation , MT4 Perfect trend-wave automatic calculation channel calculation , MT5 Local Trading copying Easy And Fast Copy , MT4 Easy And Fast Copy , MT5 Local Trading copying For DEMO Easy And Fast Copy , MT4 DEMO Easy And Fast Copy , MT5 DEMO Can set the cycle for other varieties of K line graph covered this window, fluctuations obse
FREE
Bar Countdown
Mario Antonio Oliveira
4.8 (5)
Bar Countdown is a simple indicator for MetaTrader 5 that shows the time remaining of the each candle. It can be placed in any corner of the chart or near of the price close and it'll help you to know if the current candle is ending. Choose the counter format between HR:MIN:SEC and MIN:SEC It is so easy to use, configure the color, size and counter position on the chart and that's it!!! The Countdown starts now! Updates: 2021/02/28; v1.0: Initial release 2021/03/16; v1.1: Minor code changes
FREE
Are you tired of drawing trendlines every time you're analyzing charts? Or perhaps you would like more consistency in your technical analysis. Then this is for you. This indicator will draw trend lines automatically when dropped on a chart. How it works Works similar to standard deviation channel found on mt4 and mt5. It has 2 parameters: 1. Starting Bar 2. Number of bars for calculation The   starting bar   is the bar which drawing of the trend lines will begin, while the   number of bars for c
FREE
Economic Markers
Flavio Javier Jarabeck
4.83 (18)
Easily get all relevant economic events of the current day right into your chart, as markers. Filter what kind of markers do you want: by country (selected individually) and by Importance (High relevance, Medium, Low or any combination of these). Configure the visual cues to your liking. If there is more than one event set to the very same time, their Names will be stacked and you will see the messages merged with the plus (+) sign on the marker. Obviously that long or too much events on the sam
FREE
Donchian Pro
Paulo Henrique Faquineli Garcia
5 (2)
The Donchian Channel Channels are among the most popular tools of technical analysis, as they visually convey to the analyst the limits within which most price movement tends to occur. Channel users know that valuable information can be obtained at any time, whether prices are in the central region of a band or close to one of the border lines. One of the best known techniques to explore these concepts is Bollinger Bands. However, John Bollinger was not the only one to research the applicatio
FREE
Candle Zones
Flavio Javier Jarabeck
5 (1)
You probably heard about Candlesticks behaviors, which in most of the times could denote and trace Volume behaviors even if you are not watching Volume itself... Well, this indicator will do this. Naked traders love to rely solely on candlesticks patterns and with Candle Zones you can trap special patterns and DRAW THEM on your chart. As simple as that. There are several filters you can tweak in order to achieve the analysis you want. Just give it a try. After several months of testing, we think
FREE
С этим продуктом покупают
Прежде всего стоит подчеркнуть, что этот торговый индикатор не перерисовывается, не перерисовывает и не отставает, что делает его идеальным как для ручной, так и для роботизированной торговли. Руководство пользователя: настройки, вводы и стратегия. Атомный аналитик - это индикатор ценового действия PA, который использует силу и импульс цены, чтобы найти лучший край на рынке. Оборудованный расширенными фильтрами, которые помогают убирать шумы и ложные сигналы, и повышают торговый потенциал. Испо
Представляем       Индикатор Quantum Trend Sniper   , инновационный индикатор MQL5, который меняет способ определения разворотов тренда и торговли ими! Разработан командой опытных трейдеров со стажем торговли более 13 лет,       Снайперский индикатор Quantum Trend       разработан, чтобы вывести ваше торговое путешествие на новые высоты благодаря инновационному способу определения разворотов тренда с чрезвычайно высокой точностью. ***Купите индикатор Quantum Trend Sniper и получите индикатор
Прежде всего стоит подчеркнуть, что эта торговая система является индикатором без перерисовки, без повторной отрисовки и без задержки, что делает ее идеальной как для ручной, так и для роботизированной торговли. Онлайн курс, руководство и загрузка пресетов. «Smart Trend Trading System MT5» - это комплексное торговое решение, созданное для новичков и опытных трейдеров. Он объединяет более 10 премиальных индикаторов и предлагает более 7 надежных торговых стратегий, что делает его универсальным
Раскройте силу торговли трендами с помощью индикатора Trend Screener: вашего идеального решения для торговли трендами, основанного на нечеткой логике и мультивалютной системе! Повысьте уровень своей торговли по тренду с помощью Trend Screener, революционного индикатора тренда, основанного на нечеткой логике. Это мощный индикатор отслеживания тренда, который сочетает в себе более 13 инструментов и функций премиум-класса и 3 торговые стратегии, что делает его универсальным выбором для превращения
Прежде всего стоит подчеркнуть, что этот Торговый Инструмент является Неперерисовывающимся Нерепейнтинговым Индикатором, что делает его идеальным для профессиональной торговли. Онлайн-курс, руководство пользователя и демонстрация. Индикатор Концепций Умного Действия Цены - очень мощный инструмент как для новичков, так и для опытных трейдеров. Он объединяет более 20 полезных индикаторов в одном, комбинируя передовые торговые идеи, такие как анализ Inner Circle Trader и стратегии торговли конц
Reversal First Impulse levels (RFI)          INSTRUCTIONS     RUS      -      ENG           Рекомендуем использовать с  индикатором -  TREND PRO -  Version MT4             Важным ключевым элементом в трейдинге являются зоны или уровни, от которых принимаются решения о покупке или продаже торгового инструмента. Несмотря на попытки крупных игроков скрыть свое присутствие на рынке, они неизбежно оставляют следы. Наша задача заключалась в том, чтобы научиться находить эти следы и правильно их интер
Gold Stuff mt5
Vasiliy Strukov
4.89 (175)
Gold Stuff mt5 - трендовый индикатор, разработанный специально для золота, также может использоваться на любых финансовых инструментах. Индикатор не перерисовывается и не запаздывает. Рекомендуемый тайм-фрейм H1.  Свяжитесь со мной сразу после покупки для получения   персонального бонуса!   Вы можете получить бесплатную копию нашего индикатора Strong Support and Trend Scanner, пожалуйста, в личку. мне! Настройки и мануал  здесь ПАРАМЕТРЫ Draw Arrow -   вкл.выкл. отрисовку стрелок на графике. A
WHY IS OUR FXACCCURATE LS MT5 THE PROFITABLE ? PROTECT YOUR CAPITAL WITH RISK MANAGEMENT Gives entry, stop and target levels from time to time. It finds Trading opportunities by analyzing what the price is doing during established trends. POWERFUL INDICATOR FOR A RELIABLE STRATEGIES We have made these indicators with a lot of years of hard work. It is made at a very advanced level. Established trends provide dozens of trading opportunities, but most trend indicators completely ignore them!
IVISTscalp5
Vadym Zhukovskyi
5 (4)
Представляем вам индикатор iVISTscalp 5 , который не только уникален, но и эффективен в использовании при анализе торговых операциях. Этот индикатор основывается на временных данных и является результатом многолетнего опыта и глубокого анализа финансовых рынков. Индикатор iVISTscalp 5 отличный помощник для ручной торговли. Удобство, простота и визуализация. Все самое сложное спрятано внутри. Мы максимум упростили настройки и использование индикатора iVISTscalp 5 . Индикатор подходит для всех
Представляем   Quantum Heiken Ashi PRO Свечи Heiken Ashi, разработанные для обеспечения четкого понимания рыночных тенденций, известны своей способностью отфильтровывать шум и устранять ложные сигналы. Попрощайтесь со сбивающими с толку колебаниями цен и познакомьтесь с более плавным и надежным представлением графиков. Что делает Quantum Heiken Ashi PRO действительно уникальным, так это его инновационная формула, которая преобразует данные традиционных свечей в легко читаемые цветные столбцы. Кр
FX Volume MT5
Daniel Stein
4.94 (17)
Получайте ежедневную информацию о рынке с подробностями и скриншотами в нашем утреннем брифинге здесь, на mql5 , и в Telegram ! FX Volume - это ПЕРВЫЙ и ЕДИНСТВЕННЫЙ индикатор объема, который дает РЕАЛЬНОЕ представление о настроении рынка с точки зрения брокера. Он дает потрясающее представление о том, как институциональные участники рынка, такие как брокеры, позиционируют себя на рынке Forex, гораздо быстрее, чем отчеты COT. Видеть эту информацию прямо на своем графике - это настоящий геймчей
TPSpro TRENDPRO   —  трендовый индикатор, который автоматически анализирует рынок и предоставляет информацию о тренде и каждой его смене а также дающий сигналы для входа в сделки без перерисовки! Индикатор использует каждую свечу, анализируя их отдельно. относя к разным импульсам – импульс вверх или вниз. Точные точки входа в сделки  для  валют, крипты, металлов, акций, индексов! -  Version MT4                ПОЛНОЕ ОПИСАНИЕ ИНДИКАТОРА          Рекомендуем использовать с  индикатором -  RFI LE
The Volume by Price Indicator for MetaTrader 5 features Volume Profile and Market Profile TPO (Time Price Opportunity). Volume and TPO histogram bar and line charts. Volume Footprint charts. TPO letter and block marker collapsed and split structure charts. Session filtering and grouping. Static, dynamic and flexible range segmentation and compositing methods with relative and absolute visualizations. Graphical layering, positioning and styling options to suit the user's analytic and aesthetic n
Станьте Breaker Trader и получайте прибыль от изменений структуры рынка по мере изменения цены. Индикатор выключателя блока ордеров определяет, когда тренд или движение цены приближаются к истощению и готовы развернуться. Он предупреждает вас об изменениях в структуре рынка, которые обычно происходят, когда произойдет разворот или серьезный откат. Индикатор использует собственный расчет, который определяет прорывы и ценовой импульс. Каждый раз, когда новый максимум формируется около возможн
ICT, SMC, SMART MONEY CONCEPTS, SMART MONEY, Smart Money Concept, Support and Resistance, Trend Analysis, Price Action, Market Structure, Order Blocks, BOS/CHoCH,   Breaker Blocks ,  Momentum Shift,   Supply&Demand Zone/Order Blocks , Strong Imbalance,   HH/LL/HL/LH,    Fair Value Gap, FVG,  Premium  &   Discount   Zones, Fibonacci Retracement, OTE, Buy Side Liquidity, Sell Side Liquidity, BSL/SSL Taken, Equal Highs & Lows, MTF Dashboard, Multiple Time Frame, BigBar, HTF OB, HTF Market Structure
Introducing the Power Trade Plus indicator designed by a small group of traders with a few years of experience trading the market profitably.  The Power Trade Plus is derived from the Power Trade indicator,  the indicator strive in powerful sniper entries and take profit levels,  with an algorithm that's can determine the markets volatility and Provides entries based on the current market volatility. This indicator is much more effective in stock ,currencies and indices.
Представляем       Quantum Breakout PRO   , новаторский индикатор MQL5, который меняет ваш способ торговли в зонах прорыва! Разработан командой опытных трейдеров со стажем торговли более 13 лет,       Квантовый прорыв PRO       разработан, чтобы поднять ваше торговое путешествие к новым высотам с его инновационной и динамичной стратегией зоны прорыва. Quantum Breakout Indicator покажет вам сигнальные стрелки на зонах прорыва с 5 целевыми зонами прибыли и предложением стоп-лосса на основе по
Сейчас 147 долл. США (увеличиваясь до 499 долл. США после нескольких обновлений) - неограниченные учетные записи (ПК или Mac) Руководство пользователя + Обучающие видео + Доступ к приватному Discord-каналу + VIP-статус и мобильная версия + Лицензия на 5 ПК с неограниченным количеством аккаунтов и терминалов MT4. Сколько раз вы покупали индикатор торговли с замечательными обратными тестами, доказательствами производительности на живых счетах и зашикарными цифрами и статистикой, но после испо
Этот индикатор является уникальным, качественным и доступным инструментом для торговли, включающим в себя наши собственные разработки и новую формулу. В обновленной версии появилась возможность отображать зоны двух таймфреймов. Это означает, что вам будут доступны зоны не только на старшем ТФ, а сразу с двух таймфреймов - таймфрейма графика и старшего: отображение вложенных зон. Обновление обязательно понравится всем трейдерам, торгующим по зонам спроса и предложения. Важная информация Для мак
TPA True Price Action indicator reveals the true price action of the market makers through 100% non-repainting signals strictly at the close of a candle! TPA shows entries and re-entries, every time the bulls are definitely stronger than the bears and vice versa. Not to confuse with red/green candles. The shift of power gets confirmed at the earliest stage and is ONE exit strategy of several. There are available now two free parts of the TPA User Guide for our customers. The first "The Basics"
Индикатор Trend Line Map является дополнением к индикатору Trend Screener Indicator. Он работает как сканер всех сигналов, генерируемых скринером тренда (сигналы линии тренда). Это сканер линий тренда на основе индикатора Trend Screener. Если у вас нет индикатора Trend Screener Pro, программа Trend Line Map Pro работать не будет. It's a Trend Line Scanner based on Trend Screener Indicator. If you don't have Trend Screener Pro Indicator,     the Trend Line Map Pro will not work . Зайдя в н
AW Trend Predictor MT5
AW Trading Software Limited
4.78 (58)
Сочетание тренда и пробоя уровней в одной системе. Продвинутый алгоритм индикатора фильтрует рыночный шум, определяет тренд, точки входа, а также возможные уровни выхода из позиции. Сигналы индикатора записываются в статистический модуль, который позволяет выбирать наиболее подходящие инструменты, показывая эффективность истории сигналов. Индикатор рассчитывает отметки ТейкПрофитов и стоплосса. Руководство пользователя ->  ЗДЕСЬ  / MT4 версия ->  ЗДЕСЬ Как торговать с индикатором: Торговля с Tr
BUY INDICATOR AND GET EA FOR FREE AS A BONUS + SOME OTHER GIFTS! ITALO TREND INDICATOR  is the best trend indicator on the market, the Indicator works on all time-frames and assets, indicator built after 7 years of experience on forex and many other markets. You know many trend indicators around the internet are not complete, does not help, and it's difficult to trade, but the Italo Trend Indicator is different , the Italo Trend Indicator shows the signal to buy or sell, to confirm the signal t
Matrix Arrow Indicator MT5
Juvenille Emperor Limited
5 (14)
Индикатор Matrix Arrow MT5   — это уникальный индикатор тренда 10 в 1, следующий за   100% неперерисовывающимся   индикатором с несколькими таймфреймами, который можно использовать на всех символах/инструментах:   форекс ,  товары ,   криптовалюты ,   индексы ,  акции . Индикатор Matrix Arrow MT5  будет определять текущую тенденцию на ранних этапах, собирая информацию и данные от до 10 стандартных индикаторов, а именно: Индекс среднего направленного движения (ADX) Индекс товарного канала (CCI)
Auto Order Block with break of structure based on ICT and Smart Money Concepts (SMC) Futures Break of Structure ( BoS )             Order block ( OB )            Higher time frame Order block / Point of Interest ( POI )    shown on current chart           Fair value Gap ( FVG ) / Imbalance   -  MTF      ( Multi Time Frame )    HH/LL/HL/LH  -  MTF      ( Multi Time Frame )  Choch  MTF      ( Multi Time Frame )  Volume Imbalance     ,  MTF          vIMB Gap’s Power of 3  ( PO3) Equ
Индикатор разворота ADR сразу показывает, где в настоящее время торгуется цена относительно своего нормального среднего дневного диапазона. Вы будете получать мгновенные оповещения через всплывающие окна, электронную почту или push-уведомления, когда цена превышает свой средний диапазон и уровни выше него по вашему выбору, чтобы вы могли быстро переходить к откатам и разворотам. Индикатор рисует на графике горизонтальные линии на экстремумах среднего дневного диапазона, а также расширения выше
Индикатор определения тренда, дополнит любую стратегию, а также может использоваться как самостоятельный инструмент.  ВАЖНО! Свяжитесь со мной сразу после покупки, чтобы получить инструкции и бонус!  Преимущества Прост в использовании, не перегружает график не нужной информацией; Возможность использования  как фильтр для любой стратегии; Имеет встроенные уровни динамических поддержек и сопротивлений, что может использоваться как для фиксации прибыли, так и для установки стоп-лоссов; Индикатор не
Golden Spikes Detector This indicator is based on an advanced strategy primarily for trading spikes on Boom and Crash Indices. Complex algorithms were implemented to detect high probability entries only. It alerts on potential Buy and Sell entries. To trade spikes on the Deriv or Binary broker, only take Buy Boom and Sell Cash alerts. It was optimised to be loaded on 5-minute timeframe although multiple timeframe analysis is done in the background. Features ·             Desktop pop up and sound
Bill Williams Advanced предназначен для автоматического анализа графика по системе " Profitunity " Билла Уильямса. Индикатор анализирует сразу четыре таймфрейма. Инструкция/Мануал ( Обязательно читайте перед приобретением ) Преимущества 1. Автоматически анализирует график по системе "Profitunity" Билла Уильямса. Найденные сигналы помещает в таблицу в углу экрана. 2. Оснащён трендовым фильтром по индикатору Аллигатор. Большинство сигналов системы рекомендуется использовать только по тренду.
Индикатор очень точно определяет уровни возможного окончания тренда и фиксации профита. Метод определения уровней основан на идеях В.Д.Ганна (W.D.Gann), с использованием алгоритма, разработанного его последователем Кириллом Боровским. Чрезвычайно высокая достоверность достижения уровней (по словам К.Боровского  – 80-90%) Незаменим для любой торговой стратегии – каждому трейдеру необходимо определить точку выхода из рынка! Точно определяет цели на любых таймфремах и любых инструментах (форекс, ме
Другие продукты этого автора
SST Chart Trade
Eduardo Sergio Wolff Garufi
4.8 (35)
SST Chart Trade creates a new experience for the trader and investor using Metatrader 5. Available in English and Portuguese ! It creates a control panel that has the following features: Selection of Stop Loss and Take Profit, independently Volume Quantity Selection 3 Quick Quantity buttons Easy-to-identify buttons for Buy, Sell, Buy at Bid Price or Sell at Ask Price Reset button that automatically closes your position Cancel orders + Fkat button, which in addition to closing your posit
FREE
Фильтр:
igorvita13
44
igorvita13 2023.09.28 18:26 
 

Mto bom!

Thomas Nascimento
64
Thomas Nascimento 2023.09.25 15:57 
 

Muito bom!

E_lugao
64
E_lugao 2023.09.03 22:32 
 

Gostei muito, vai ajudar demais

João Batista Vicente
32
João Batista Vicente 2023.08.07 22:57 
 

Gostei muito.

socratesarthus01
24
socratesarthus01 2023.04.21 14:14 
 

Indicador muitíssimo relevante disponibilizado. Obrigado Eduardo Sergio Wolff Garufi !

jadediditupi
14
jadediditupi 2023.02.10 18:22 
 

gostei muito e sendo no 08000 melhor ainda

campanhafabio
14
campanhafabio 2022.09.04 18:17 
 

MUITOOO BOMMM! !!... EXCELENTE INDICADOR! !!... ESTAVA DANDO UM DURO PARA ACHAR ESSE INDICADOR! !!... SENSACIONAL! !!... FUNCIONA MUITOOO BEMMM! !!... AJUDA MUITOOO! !!... principalmente nas minhas localizações de níveis de preço... se tá caro... ou se tá barato...

Milton Pereira Dos Santos
58
Milton Pereira Dos Santos 2022.05.06 21:23 
 

Se é de graça, como o Meta Trader, o amigo poderia me enviar o código? Minha intenção é implementálo em um bot, e te envio uma copia do mesmo assim que pronto. Da forma como está é ótimo para o trader de janela, mas infelizmente só opero com bot e achei muito interessante a curva que esse indicador faz, arrisco a dizer que tem mais precisão que muitos outros vwaps, por isso o interese. Se não puder, não tem porblema. miltonwindows@gmail.com , desde já muito grato.

LEANDRO NABOSNE
18
LEANDRO NABOSNE 2022.04.27 20:24 
 

it works perfectly

Ответ на отзыв