• Обзор
  • Отзывы (37)
  • Обсуждение (137)
  • Что нового

Weis Waves

3.3

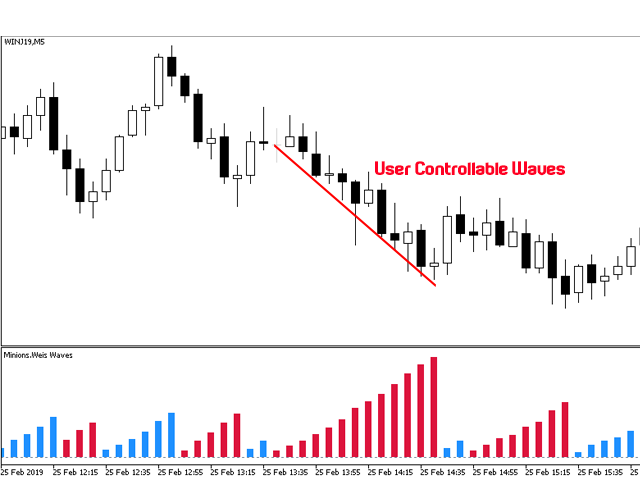
The original author is David Weis, an expert in the Wyckoff Method. The Weis Wave is a modern adaptation of the 1930's Wyckoff Method, another expert in Tape Reading techniques and Chart Analysis. Weis Waves takes market volume and stacks it into waves according to price conditions giving the trader valuable insights about the market conditions.

If you want to learn more about this subject you can find tons of videos in YouTube. Just look for "The Wickoff Method", "Weis Wave" and "Volume Spread Analysis".

There is also the book David Weis wrote himself called "Trades About to Happen" (Wiley Trading Series).


FEATURES

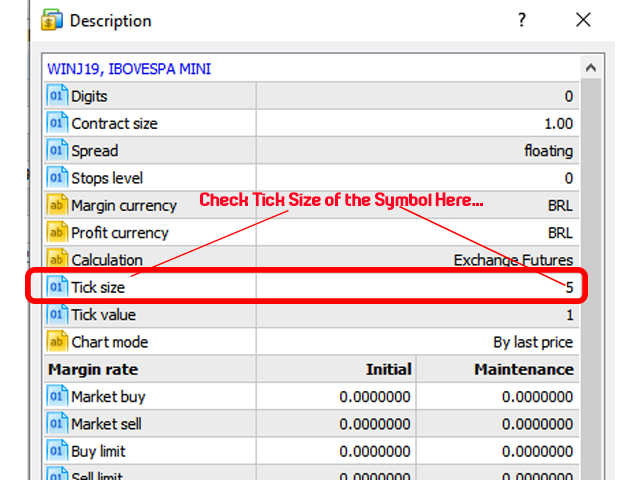
  • Volume Waves stacked according to a threshold (*in TICKS*) adjusted by the user for each Symbol, so you can exactly grab the market swings.
  • You can set the number of bars you need to load in your study, so you can limit the load and usage of MT resources and gaining speed of processing.
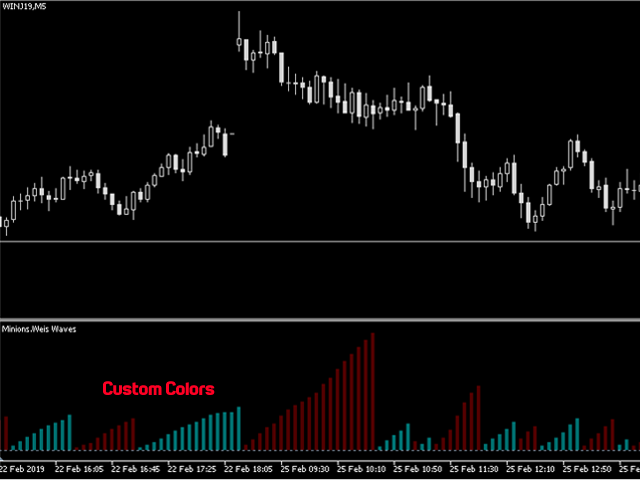
  • You can change the color and style of the waves.
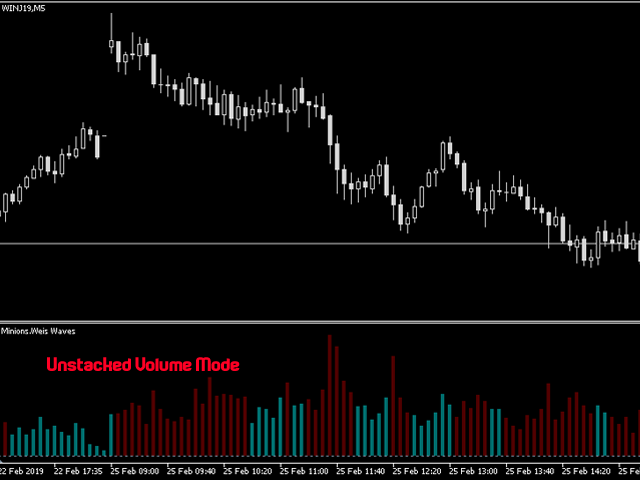
  • You can Unstack the volume into a simple histogram if desired.
  • You can use Real Volume or Ticks Volume.
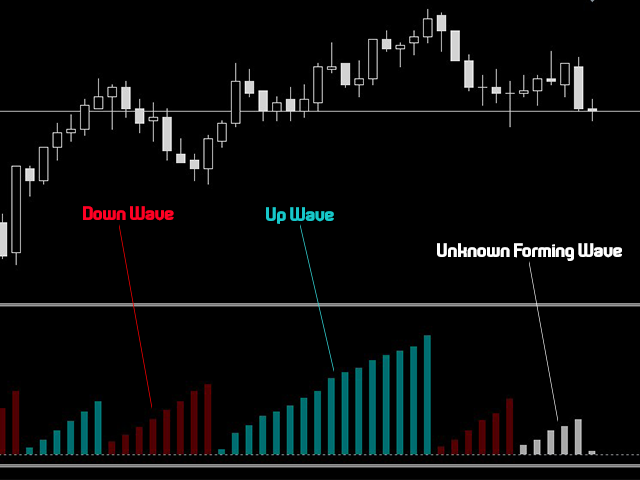
  • You will have Up Waves and Down Waves, and the new and yet unknown wave being formed will have a white (user-changeable) color.
  • Sometimes MT5 cache of data gets delayed or not renewed, so some bars can momentarily disappear. The indicator will detect and correct the missing bars in a timed interval if needed.
  • If for some reason the terminal is closed during a session, you may encounter during the restart some bars mixed at the current wave. This is normal, give the indicator a time for recomposing itself to the current state of the market...
  • This indicator was developed for Intraday trading (Day Trading), so you can use it on a maximum of H1 chart.

A mighthy companion will be the Waves Sizer, which is shown inside the chart and measures the distance Price traveled along the swings...
Get yours here:

https://www.mql5.com/en/market/product/41721


    If you like this indicator, all I am asking is a little Review (not a Comment, but a REVIEW!)...   

    This will mean A LOT to me... And this way I can continue to give away Cool Stuff for Free...

    With No Strings Attached!  Ever!


    Live Long and Prosper!

    ;)


    RELATED TOOLS THAT COULD ENHANCE YOUR READING...

    ▔▔▔▔▔▔▔▔▔▔▔▔▔▔▔▔▔▔▔▔▔▔▔▔▔▔▔▔

    Отзывы 20
    Reynaldo surf
    73
    Reynaldo surf 2022.03.19 01:04 
     

    excelente indicado, quando o preço estar em ranges tem que ler com precisão! Obrigado

    valdecism
    118
    valdecism 2020.12.06 22:36 
     

    I am trying it yet. Looks good! Thanks to developer for share it with us.

    vassill
    22
    vassill 2020.11.22 08:20 
     

    Отлично

    Рекомендуем также
    The idea of a Value Chart indicator was presented in the very good book I read back in 2020 , " Dynamic Trading Indicators: Winning with Value Charts and Price Action Profile ", from the authors Mark Helweg and David Stendahl. The idea is simple and the result is pure genius: Present candlestick Price analysis in a detrended way! HOW TO READ THIS INDICATOR Look for Overbought and Oversold levels. Of course, you will need to test the settings a lot to find the "correct" one for your approach.
    FREE
    Donchian Channel is an indicator created by Richard Donchian. It is formed by taking the highest high and the lowest low of the last specified period in candles. The area between high and low is the channel for the chosen period. Its configuration is simple. It is possible to have the average between the upper and lower lines, plus you have alerts when price hits one side. If you have any questions or find any bugs, please contact me. Enjoy! This is a free indicator, but it took hours to develo
    FREE
    Follow The Line MT5
    Oliver Gideon Amofa Appiah
    4.26 (23)
    This indicator obeys the popular maxim that: "THE TREND IS YOUR FRIEND" It paints a GREEN line for BUY and also paints a RED line for SELL. (you can change the colors). It gives alarms and alerts of all kinds. IT DOES NOT REPAINT and can be used for all currency pairs and timeframes. Yes, as easy and simple as that. Even a newbie can use it to make great and reliable trades. NB: For best results, get my other premium indicators for more powerful and reliable signals. Get them here: https://www.m
    FREE
    Waves Sizer
    Flavio Jarabeck
    3.67 (3)
    Wyckoff fans, enjoy! Ideally to be used with the Weis Waves indicator, but it can be easily used alone, the Waves Sizer puts the range (in resulting Price movement) done by the Price on its market swings. You can control how accurate or loose will be the swings. This tool is very helpful for visually know how much the Price has traveled in your Timeframe. This way you can confront this level of effort with the resulting Volume, etc... Weis Waves indicator: https://www.mql5.com/en/market/pro
    FREE
    Aggression Volume
    Flavio Jarabeck
    3.79 (19)
    Aggression Volume Indicator is the kind of indicator that is rarely found in the MQL5 community because it is not based on the standard Volume data provided by the Metatrader 5 platform. It requires the scrutiny of all traffic Ticks requested on the platform... That said, Aggression Volume indicator requests all Tick Data from your Broker and processes it to build a very special version of a Volume Indicator, where Buyers and Sellers aggressions are plotted in a form of Histogram. Additionally,
    FREE
    This indicator sums up the difference between the sells aggression and the buys aggression that occurred in each Candle, graphically plotting the waves of accumulation of the aggression volumes.   Through these waves an exponential average is calculated that indicates the direction of the business flow. Note: This indicator DOES NOT WORK for Brokers and/or Markets WITHOUT the type of aggression (BUY or SELL).   Be sure to try our Professional version with configurable features and alerts:  Agr
    FREE
    The Weis Waves RSJ Indicator sums up volumes in each wave. This is how we receive a bar chart of cumulative volumes of alternating waves. Namely the cumulative volume makes the Weis wave charts unique. It allows comparing the relation of the wave sequence characteristics, such as correspondence of the applied force (expressed in the volume) and received result (the price progress). If you still have questions, please contact me by direct message:  https://www.mql5.com/en/users/robsjunqueira/
    FREE
    Tabajara V5
    Flavio Jarabeck
    4.88 (33)
    Metatrader 5 version of the famous Andre Machado's Tabajara indicator. If you don't know Andre Machado's Technical Analysis work you don't need this indicator... For those who need it and for those several friend traders who asked this porting from other platforms, here it is... FEATURES 8-period Moving Average 20-period Moving Average 50-period Moving Average 200-period Moving Average Colored candles according to the inflexion of the 20-period MA SETTINGS You can change the Period of all M
    FREE
    The Donchian Channel Channels are among the most popular tools of technical analysis, as they visually convey to the analyst the limits within which most price movement tends to occur. Channel users know that valuable information can be obtained at any time, whether prices are in the central region of a band or close to one of the border lines. One of the best known techniques to explore these concepts is Bollinger Bands. However, John Bollinger was not the only one to research the applicatio
    FREE
    White Weis Volume This indicator shows the sum of the volume in each wave, bulish or bearish, as idealized by David Weis , but it brings an important addition , which is the marking of the bar with the highest volume of the wave (White Bar)! In coding the indicator, it was sought to optimize the code to require minimal processing during use and not to overload mt5. The indicator can be used for pre-trading analysis and study, where the trader analyzes possible points of support and resi
    30 USD
    PZ Penta O MT5
    PZ TRADING SLU
    3.8 (5)
    The Penta-O is a 6-point retracement harmonacci pattern which usually precedes big market movements. Penta-O patterns can expand and repaint quite a bit. To make things easier this indicator implements a twist: it waits for a donchian breakout in the right direction before signaling the trade. The end result is an otherwise repainting indicator with a very reliable trading signal. The donchian breakout period is entered as an input. [ Installation Guide | Update Guide | Troubleshooting | FAQ | A
    FREE
    Simple Weis Wave
    Jean Jacques Huve Ribeiro
    4 (4)
    One of the best tools for analyzing volume, Weis Wave was idelized by David Weis, to facilitate the reading of directional flow. For the VSA method disciples it is an evolution of the practices created by Richard Wycoff, facilitating a predictive reading of the market, always seeking an accumulation and distribution of the negotiated contracts. Cumulative wave volume  Range of wave ( removed) Average Wave volume Ref "Tim Ord lectures" ( removed)
    FREE
    Are you tired of drawing trendlines every time you're analyzing charts? Or perhaps you would like more consistency in your technical analysis. Then this is for you. This indicator will draw trend lines automatically when dropped on a chart. How it works Works similar to standard deviation channel found on mt4 and mt5. It has 2 parameters: 1. Starting Bar 2. Number of bars for calculation The   starting bar   is the bar which drawing of the trend lines will begin, while the   number of bars for c
    FREE
    MIDAS Super VWAP
    Flavio Jarabeck
    4.23 (13)
    Imagine VWAP, MVWAP and MIDAS in one place... Well, you found it! Now you can track the movement of Big Players in various ways, as they in general pursue the benchmarks related to this measuring, gauging if they had good execution or poor execution on their orders. Traders and analysts use the VWAP to eliminate the noise that occurs throughout the day, so they can measure what prices buyers and sellers are really trading. VWAP gives traders insight into how a stock trades for that day and deter
    FREE
    Big Player Candles
    Flavio Jarabeck
    4.76 (25)
    If you heard about The Wyckoff Method, Volume Spread Analysis, etc... You are probably searching for the candlestick indicator that shows you the Volume spread all over the current bar, signaling every types of market status... You can control the several Market Levels with custom colors... It is up to you to decide how to use it. Our job is provide you with the indicator... If you like this indicator, all I am asking is a little Review (not a Comment, but a REVIEW! )...    This will mean A
    FREE
    This is a buyer and seller aggression indicator that analyzes the shape of each candle and project this data in a histogram form. There are 4 histograms in one. On the front we have two: Upper - Buyer force. Lower - Seller force. At the background we also have two histogram, both with same color. They measure the combined strenght of buyers and sellers. This histograms can be turned off in Input Parameters. It is also possible to have the real or tick volume to help on this force measurement. IN
    FREE
    Free automatic Fibonacci is an indicator that automatically plots a Fibonacci retracement based on the number of bars you select on the BarsToScan setting in the indicator. The Fibonacci is automatically updated in real time as new highest and lowest values appears amongst the selected bars. You can select which level values to be displayed in the indicator settings. You can also select the color of the levels thus enabling the trader to be able to attach the indicator several times with differe
    FREE
    Sweet VWAP MT5
    Francisco Gomes Da Silva
    5 (4)
    Узнайте, где торгуют крупные институты и оптимизируйте свои инвестиции с бесплатным индикатором VWAP Ancorada Откройте для себя цену, по которой крупные институты заключают сделки с нашим бесплатным индикатором VWAP Ancorada ! Теперь вы можете экономить свое драгоценное время, автоматизируя построение своих VWAP, закрепленных на вершинах и днах рынка. Наша бесплатная версия позволяет легко отслеживать VWAP в реальном времени, следуя за движением указателя мыши на графике. Таким образом, вы может
    FREE
    Description The indicator uses market profile theory to show the most relevant trading zones, on a daily basis. The zones to be shown are LVN (low volume nodes) and POC (point of control). An LVN zone is one which represents price areas with the least time or volume throughout the day. Typically, these areas indicate a supply or demand initiative, and in the future, they can turn into important breakout or retracement zones. A POC zone is one which represents price areas with the most time or vo
    FREE
    Introduction This indicator detects volume spread patterns for buy and sell opportunity. The patterns include demand and supply patterns. You might use each pattern for trading. However, these patterns are best used to detect the demand zone (=accumulation area) and supply zone (=distribution area). Demand pattern indicates generally potential buying opportunity. Supply pattern indicates generally potential selling opportunity. These are the underlying patterns rather than direct price action. T
    FREE
    Qstick is a way to objectively quantify candlestick analysis and improve the interpretation of candlestick patterns. Qstick was developed by Tushar Chande and published in his book " The New Technical Trader - Boost Your Profit by Plugging Into the Latest Indicators (1994) ". Qstick is built based on a moving average of the difference between the Open and Close prices. The basis of the idea is that the Opening and Closing prices are the heart of candlestick analysis. We strongly recommend the re
    FREE
    Bar Color Trend
    Germano Chagas
    4.56 (9)
    Combining the best of Price Action , Directional Movement , and Divergence/Convergence analysis, Candle Color Trend is a easy and reliable way to identify trend direction. The indicator automatically paints the candles according to the assumption that an uptrend is defined by prices that form a series of higher highs and higher lows. In contrast, a downtrend is defined by prices that form a series of lower highs and lower lows. Additionally, ADX Wilder indicator is used to measure trend weakness
    FREE
    Important Lines
    Terence Gronowski
    4.88 (24)
    Индикатор отображает линии пивот, уровни максимума, минимума и закрытия предыдущего дня, а также минимум и максимум предыдущего часа. Нужно просто установить этот индикатор на график, чтобы отобразить все эти важные линии, нет необходимости настраивать множество отдельных индикаторов. Почему важны определенные линии Максимум и минимум предыдущего дня : эти уровни используются для торговли на дневном графике. Очень часто, если цена становится выше или ниже минимума/максимума предыдущего дня, пр
    FREE
    Market Profile 3 ForexArby com
    Hussien Abdeltwab Hussien Ryad
    3.8 (5)
    Market Profile 3 MetaTrader 5 indicator  version 4.70— is a classic Market Profile implementation that can show the price density over time, outlining the most important price levels, value area, and control value of a given trading session. This indicator can be attached to timeframes between M1 and D1 and will show the Market Profile for daily, weekly, monthly, or even intraday sessions. Lower timeframes offer higher precision. Higher timeframes are recommended for better visibility. It is als
    FREE
    Суть системы заключается в идентификации момента формирования "разворотной" композитной свечи с заданными характеристиками (размер свечи в пунктах, структура теней). В анализе японских свечей аналогами подобных разворотных моделей являются "Молот" (Hammer) и "Повешенный" (Hanging Man), но в данной системе тело свечи не обязательно должно быть маленьким, а результирующая свеча строится из нескольких свечей. Входные параметры системы: Range - задает максимальное количество баров, которые будут уча
    FREE
    Rainbow MT5
    Jamal El Alama
    4.33 (3)
    Description : Rainbow MT5 is technical indicator based on Moving Average with period 34 and very easy to use. When price crosses above MA and MA changes color to green, then this is a signal to buy. When price crosses below MA and MA changes color to red, then this is a signal to sell. The Expert advisor ( Rainbow EA MT5 ) based on Rainbow MT5 indicator is now available here . MT4 version is available  here .
    FREE
    You can download the Full version with more features here . Introduction Harmonic Patterns are best used to predict turning point. Harmonic Patterns give you high win rate and high opportunities for trade in during one day. This indicator detects the best and successful patterns base on Harmonic Trading books by Mr. Scott M.. Main Features Detect the best and   most successful patterns : Gartley, Bat, Crab, Butterfly, Cypher, Shark, Alt_Bat, Deep_Crab Easy-to-use and user friendly indicator Sca
    FREE
    Индикатор анализирует шкалу объёмов и разделяет её на две компоненты - объёмы продавцов и объёмы покупателей, а также вычисляет дельту и кумулятивную дельту. Индикатор не мерцает и не перерисовывает, вычисления и отрисовку производит достаточно быстро, используя при этом данные с младших (относительно текущего) периодов. Режимы работы индикатора переключаются с помощью входной переменной Mode : Buy - отображает только объёмы покупателей. Sell - отображает только объёмы продавцов. BuySell - отобр
    FREE
    VWAP and MVWAP
    Flavio Jarabeck
    4.29 (7)
    Volume Weighted Average Price (VWAP) is a trading benchmark commonly used by Big Players that gives the average price a Symbol has traded throughout the day. It is based on both Volume and price. Additionally we put in this indicator the MVWAP (Moving Volume Weighted Average Price). For those who do not know the usage and the importance od this indicator I recommend a great article about this subject at Investopedia ( https://www.investopedia.com/articles/trading/11/trading-with-vwap-mvwap.asp )
    FREE
    VWAP Indicator
    LUC JACOBUS A VERHEECKE
    4.19 (16)
    Volume Weighted Average Price (VWAP) The volume weighted average price (VWAP) is a   trading   benchmark   used by traders that gives the average price a security has traded at throughout the day, based on both volume and price. It is important because it provides traders with insight into both the trend and value of a security. This indicator VWAP V2 is free and is the manual version of the extended Easy VWAP indicator (30 Euro), where the date and time properties are automatically entered. Wit
    FREE
    С этим продуктом покупают
    ICT, SMC, SMART MONEY CONCEPTS, SMART MONEY, Smart Money Concept, Support and Resistance, Trend Analysis, Price Action, Market Structure, Order Blocks, BOS/CHoCH,   Breaker Blocks ,  Momentum Shift,   Supply&Demand Zone/Order Blocks , Strong Imbalance,   HH/LL/HL/LH,    Fair Value Gap, FVG,  Premium  &   Discount   Zones, Fibonacci Retracement, OTE, Buy Side Liquidity, Sell Side Liquidity, BSL/SSL Taken, Equal Highs & Lows, MTF Dashboard, Multiple Time Frame, BigBar, HTF OB, HTF Market Structur
    65 USD
    Топовый индикатор МТ5, дающий сигналы для входа в сделки без перерисовки! Идеальные точки входа в сделки для  валют, крипты, металлов, акций, индексов !  Смотрите  видео  (6:22) с примером отработки всего одного сигнала, окупившего индикатор. Версия индикатора для MT4 Преимущества индикатора Сигналы на вход без перерисовки Если сигнал появился, он никуда НЕ исчезает! В отличие от индикаторов с перерисовкой, которые ведут к потере депозита, потому что могут показать сигнал, а потом убрать его.
    125 USD
    Gold Stuff mt5
    Vasiliy Strukov
    4.97 (107)
    Gold Stuff mt5 - трендовый индикатор, разработанный специально для золота, также может использоваться на любых финансовых инструментах. Индикатор не перерисовывается и не запаздывает. Рекомендуемый тайм-фрейм H1.  Свяжитесь со мной сразу после покупки для получения настроек и персонального бонуса! ПАРАМЕТРЫ Draw Arrow -   вкл.выкл. отрисовку стрелок на графике. Alerts -   вкл.выкл.звуковые оповещения. E-mail notification -   вкл.выкл. уведомления на почту. Puch-notification -   вкл.выкл. уведо
    30 USD
    Индикатор тренда, революционное уникальное решение для торговли и фильтрации тренда со всеми важными функциями тренда, встроенными в один инструмент! Это 100% неперерисовывающийся мультитаймфреймный и мультивалютный индикатор, который можно использовать на всех инструментах/инструментах: форекс, товары, криптовалюты, индексы, акции. Trend Screener - это эффективный индикатор, следующий за трендом, который выдает сигналы тренда в виде стрелок с точками на графике. Функции, доступные в индикаторе
    50 USD
    Сочетание тренда и пробоя уровней в одной системе. Продвинутый алгоритм индикатора фильтрует рыночный шум, определяет тренд, точки входа, а также возможные уровни выхода из позиции. Сигналы индикатора записываются в статистический модуль, который позволяет выбирать наиболее подходящие инструменты, показывая эффективность истории сигналов. Индикатор рассчитывает отметки ТейкПрофитов и стоплосса. Руководство пользователя ->  ЗДЕСЬ  / MT4 версия ->  ЗДЕСЬ Как торговать с индикатором: Торговля с Tr
    55 USD
    Этот индикатор является уникальным, качественным и доступным инструментом для торговли, включающим в себя наши собственные разработки и новую формулу. В обновленной версии появилась возможность отображать зоны двух таймфреймов. Это означает, что вам будут доступны зоны не только на старшем ТФ, а сразу с двух таймфреймов - таймфрейма графика и старшего: отображение вложенных зон. Обновление обязательно понравится всем трейдерам, торгующим по зонам спроса и предложения. Важная информация Для мак
    199 USD
    Станьте Breaker Trader и получайте прибыль от изменений структуры рынка по мере изменения цены. Индикатор выключателя блока ордеров определяет, когда тренд или движение цены приближаются к истощению и готовы развернуться. Он предупреждает вас об изменениях в структуре рынка, которые обычно происходят, когда произойдет разворот или серьезный откат. Индикатор использует собственный расчет, который определяет прорывы и ценовой импульс. Каждый раз, когда новый максимум формируется около возможн
    49 USD
    Matrix Arrow Indicator MT5
    Juvenille Emperor Limited
    5 (11)
    Индикатор Matrix Arrow MT5   — это уникальный индикатор тренда 10 в 1, следующий за   100% неперерисовывающимся   индикатором с несколькими таймфреймами, который можно использовать на всех символах/инструментах:   форекс ,  товары ,   криптовалюты ,   индексы ,  акции . Индикатор Matrix Arrow MT5  будет определять текущую тенденцию на ранних этапах, собирая информацию и данные от до 10 стандартных индикаторов, а именно: Индекс среднего направленного движения (ADX) Индекс товарного канала (CCI)
    75 USD
    Market Structure Patterns is an indicator based on smart money concepts that displays structures and zones on the chart, can send alerts of any type, have his values accessed through global variables what makes easy create Expert Advisors based on it. This is the only one of this type in the market that allows the control of the transparency of the zones on the chart. The indicator also paints the   candlesticks   depending on the trend. This feature can be enabled in the parameter "Color Candle
    30 USD
    Индикатор Supply Demand использует предыдущее ценовое действие для выявления потенциального дисбаланса между покупателями и продавцами. Ключевым является определение зон с лучшими возможностями, а не просто вероятностей. Индикатор Blahtech Supply Demand обеспечивает функционал, не доступный ни в одной платформе. Этот индикатор 4 в 1 не только выделяет зоны с более высокой вероятностью на основе механизма оценки силы по множественным критериям, но также комбинирует его с мульти-таймфреймовым ана
    99 USD
    TPA True Price Action indicator reveals the true price action of the market makers through 100% non-repainting signals strictly at the close of a candle! TPA shows entries and re-entries, every time the bulls are definitely stronger than the bears and vice versa. Not to confuse with red/green candles. The shift of power gets confirmed at the earliest stage and is ONE exit strategy of several. There are available now two free parts of the TPA User Guide for our customers. The first "The Basics"
    168 USD
    Blahtech VWAP - Volume Weighted Average Price (VWAP) is the ratio of price to total volume. It provides an average price over a specified time interval.  Links [  Install  |  Update  |  Documentation   ] Feature Highlights Configurable VWAP Line Sessions, intervals, anchored or continuous Previous day settlement line Standard Deviation bands Alerts at bar close or real time Automatic Broker or Tick volumes Significantly reduced CPU usage Input Parameters Max Bars   - Restrict the number of
    49 USD
    Уровни поддержки и сопротивления с давних времен были мощнейшим инструментом для анализа рынка. Strong Support индикатор строит уровни поддержки по локальным минимумам цены, а уровни сопротивления по локальным максимумам цены.  Другие мои разработки можно посмотреть   здесь Рекомендуется использовать совместно с трендовым индикатором, например,   Gold Stuff   - это позволит торговать по тренду и одновременно определять зоны консолидации или разворота тренда, а также устанавливать стоп-лосс и тей
    30 USD
    Профиль Рынка (Market Profile) определяет ряд типов дней, которые помогают трейдеру распознать поведение рынка. Ключевая особенность - это область значений (Value Area), представляющая диапазон ценового действия, в котором произошло 70% торговли. Понимание области значений может помочь трейдерам вникнуть в направление рынка и установить торговлю с более высокими шансами на успех. Это отличное дополнение к любой системе, которую вы возможно используете. Blahtech Limited представляет сообществу Me
    99 USD
    Инструкция работы с индикатором   |  Стратегия Owl Smart Levels   |  Версия MT4   |   Как установить?   |   FAQ Индикатор Owl Smart Levels – это полноценная торговая система внутри одного индикатора, которая включает в себя такие популярные инструменты анализа рынка как усовершенствованные фракталы Билла Вильямса , Valable ZigZag, который строит правильную волновую структуру рынка, а также  уровни Фибоначчи, которые   отмечают точные уровни входа в рынок и места взятия прибыли. Подробное описан
    97 USD
    BUY INDICATOR AND GET EA FOR FREE AS A BONUS + SOME OTHER GIFTS! ITALO VOLUME INDICATOR  is the best volume indicator ever created, and why is that? The Indicator works on all time-frames and assets, indicator built after 6 years of experience on forex and many other markets. You know many volume indicators around the internet are not complete, does not help, and it's difficult to trade, but the Italo Volume Indicator is different , the Italo Volume Indicator shows the wave volume, when market
    65 USD
    ACB Breakout Arrows MT5
    KEENBASE SOFTWARE SOLUTIONS
    5 (1)
    Индикатор ACB Breakout Arrows формирует важные сигналы на вход в рынок, определяя специальные паттерны пробоя. Индикатор постоянно сканирует график, ожидая появления импульса в одном направлении, и генерирует точный сигнал входа прямо перед большим движением. Основные возможности: Не перерисовывается! Показывает уровни стоп-лосс и тейк-профит. Подходит для внутридневых трейдеров, свинг-трейдеров и скальперов. Оптимизированный алгоритм для повышения точности сигналов. Предварительно рассчитыва
    145 USD
    Автоматическое построение уровней поддержки и сопротивления ПЛЮС разрывы между свечами на вашем графике, чтобы вы могли видеть, куда цена, скорее всего, направится дальше и/или потенциально может развернуться. Этот индикатор разработан для использования в рамках методики позиционной торговли, которая преподается на моем сайте (The Market Structure Trader), и отображает ключевую информацию для таргетинга и потенциальных входов. MT4 Version:  https://www.mql5.com/en/market/product/97246/ В инди
    49 USD
    Auto Order Block with break of structure Detect Break of Structure , Mark Order Block and draw Entry / Stop and Risk to Reward lines when Order block is touch by price with Alert. Trend is Manually set to filter signals in a direction by a button on the chart. Entry / Stop and Risk to Reward lines can also be switch on / off by button on chart. Futures Auto Mark Break of Structure Auto Mark Order block Auto Mark higher time frame Point Of  Interest ( POI ) Popup Alert when BoS , Order block
    55 USD
    FX Volume MT5
    Daniel Stein
    4.77 (13)
    Следовать за умными деньгами наконец-то возможно! FX Volume - это ПЕРВЫЙ и ЕДИНСТВЕННЫЙ индикатор объема, который дает РЕАЛЬНОЕ представление о настроении рынка с точки зрения брокера. Он дает потрясающее представление о том, как институциональные участники рынка, такие как брокеры, позиционируются на рынке Forex, гораздо быстрее, чем отчеты COT. Видеть эту информацию прямо на своем графике - это настоящий геймчейнджер и прорывное решение для вашей торговли. Пожалуйста, прочитайте наш баз
    33 USD
    Индикатор Trend Line Map является дополнением к индикатору Trend Screener Indicator. Он работает как сканер всех сигналов, генерируемых скринером тренда (сигналы линии тренда). Это сканер линий тренда на основе индикатора Trend Screener. Если у вас нет индикатора Trend Screener Pro, программа Trend Line Map Pro работать не будет. It's a Trend Line Scanner based on Trend Screener Indicator. If you don't have Trend Screener Pro Indicator,     the Trend Line Map Pro will not work . Зайдя в н
    50 USD
    Индикатор очень точно определяет уровни возможного окончания тренда и фиксации профита. Метод определения уровней основан на идеях В.Д.Ганна (W.D.Gann), с использованием алгоритма, разработанного его последователем Кириллом Боровским. Чрезвычайно высокая достоверность достижения уровней (по словам К.Боровского  – 80-90%) Незаменим для любой торговой стратегии – каждому трейдеру необходимо определить точку выхода из рынка! Точно определяет цели на любых таймфремах и любых инструментах (форекс, ме
    65 USD
    EFW Analytics исходит из принципа "Мы торгуем, потому что на финансовом рынке есть закономерности". EFW Analytics - набор инструментов для повышения эффективности торговли путем обнаружения повторяющихся фрактальных геометрических паттернов на финансовом рынке (пятая закономерность). EFW Analytics - один из нескольких инструментов, поддерживающих торговую логику без необходимости тестирования на истории. Инструмент состоит из трех частей: Equilibrium Fractal Wave Index - индекс равновесной фракт
    200 USD
    Индикатор разворота ADR сразу показывает, где в настоящее время торгуется цена относительно своего нормального среднего дневного диапазона. Вы будете получать мгновенные оповещения через всплывающие окна, электронную почту или push-уведомления, когда цена превышает свой средний диапазон и уровни выше него по вашему выбору, чтобы вы могли быстро переходить к откатам и разворотам. Индикатор рисует на графике горизонтальные линии на экстремумах среднего дневного диапазона, а также расширения выше
    49 USD
    **   All Symbols   x   All Timeframes   scan just by pressing scanner button ** *** Contact me immediately after the purchase to send you instructions and add you in "Market Structure group" for sharing or seeing experiences with other users. CURRENT PRICE $39..... Future Price $200 Introduction: Market structure is important for both new and professional traders since it can influence the liquidity and price action of a market. It’s also one of the most commonly used techniques to understand tr
    39 USD
    FX Power MT5
    Daniel Stein
    4.3 (23)
    FX Power - это первый измеритель силы в реальном времени с гистограммой в реальном времени. Он анализирует динамику и силу всех основных валют для определения сделок с высокой вероятностью. Если вы хотите узнать, как определить правильные торговые возможности для постоянной прибыльности и успеха, мы настоятельно рекомендуем изучить правила нашей ПРОСТОЙ ТОРГОВОЙ СИСТЕМЫ -> нажмите здесь, чтобы извлечь выгоду Основные характеристики FX Power Аналитические функции Рыночная сила всех основных вал
    66 USD
    Индикатор определения тренда, дополнит любую стратегию, а также может использоваться как самостоятельный инструмент.  ВАЖНО! Свяжитесь со мной сразу после покупки, чтобы получить инструкции и бонус!  Преимущества Прост в использовании, не перегружает график не нужной информацией; Возможность использования  как фильтр для любой стратегии; Имеет встроенные уровни динамических поддержек и сопротивлений, что может использоваться как для фиксации прибыли, так и для установки стоп-лоссов; Индикатор не
    30 USD
    **   All Symbols   x   All Timeframes   scan just by pressing scanner button ** ***Contact me after the purchase to send you instructions and add you in "Swing scanner group" for sharing or seeing experiences with other users. CURRENT PRICE $49..... Future Price $200 Introduction: Swing Scanner   is the indicator designed to detect swings in the direction of the trend and possible reversal swings. The indicator studies several price and time vectors to track the aggregate trend direction and de
    49 USD
    Trend Chief — это продвинутый алгоритм индикатора, который отфильтровывает рыночный шум, определяет тренд, точки входа, а также возможные уровни выхода. Используйте более короткие таймфреймы для скальпинга и более высокие таймфреймы для свинг-трейдинга. Trend Chief идеально подходит для всех инструментов Metatrader: валют, металлов, криптовалют, акций и индексов. * Как пользоваться индикатором Trend Chief: - Получите основной тренд, посмотрев на дневной и H4-графики - Если тренд восходящий,
    99 USD
    XQ Indicator MT5
    Marzena Maria Szmit
    5 (1)
    The signal conditions are a combination of three indicators, and XQ Forex Indicators only display  medium and long-term trends . The indicator's efficacy has been improved with the addition of a filter that blocks out false signals. The XQ Forex Indicator can be used on  FX pairs, CFDs, and Cryptocurrencies . There are two type of signals:  Buy or Sell and Big Long or Big Short It is possible to enable sending emails when a major trend-change signal is detected, as well as to display the alerts
    179 USD
    Другие продукты этого автора
    Are you tired of drawing Support & Resistance levels for your Quotes? Are you learning how to spot Support & Resistances? No matter what is your case, Auto Support & Resistances will draw those levels for you! AND, it can draw them from other timeframes, right into you current chart, no matter what timeframe you are using... You can also Agglutinate regions/zones that are too much closer to each other and turning them into one single Support & Resistance Level. All configurable. SETTINGS Time
    FREE
    The Metatrader 5 has a hidden jewel called Chart Object, mostly unknown to the common users and hidden in a sub-menu within the platform. Called Mini Chart, this object is a miniature instance of a big/normal chart that could be added/attached to any normal chart, this way the Mini Chart will be bound to the main Chart in a very minimalist way saving a precious amount of real state on your screen. If you don't know the Mini Chart, give it a try - see the video and screenshots below. This is a gr
    30 USD
    Mini POC
    Flavio Jarabeck
    4.71 (17)
    For those who struggle with overbloated Volume Profile/Market Profile indicators, here is a solution that contains only the Point of Control (POC) information. Super-fast and reliable, the Mini POC indicator presents this vital information visually within your chart. Totally customizable in splittable timeframes, type of Volume, calculation method, and how many days back you need. SETTINGS Timeframe to split the POCs within the day. Volume type to use: Ticks or Real Volume. Calculation method
    FREE
    Tabajara V5
    Flavio Jarabeck
    4.88 (33)
    Metatrader 5 version of the famous Andre Machado's Tabajara indicator. If you don't know Andre Machado's Technical Analysis work you don't need this indicator... For those who need it and for those several friend traders who asked this porting from other platforms, here it is... FEATURES 8-period Moving Average 20-period Moving Average 50-period Moving Average 200-period Moving Average Colored candles according to the inflexion of the 20-period MA SETTINGS You can change the Period of all M
    FREE
    Symbol Watermark
    Flavio Jarabeck
    4.83 (6)
    Another request from my brotherhood was putting the name of the Symbol being seen - a little bigger - on the Chart, just to get sure that they are seeing the correct one... Mistakes pay a high price on the market... It is a very effective, and almost resource-null-consuming indicator that displays the current Symbol Name and Timeframe in almost any position of your Chart, with any color, and any Font Size... And also you can change the divisor character that is presented between the Symbol Name
    FREE
    Aggression Volume
    Flavio Jarabeck
    3.79 (19)
    Aggression Volume Indicator is the kind of indicator that is rarely found in the MQL5 community because it is not based on the standard Volume data provided by the Metatrader 5 platform. It requires the scrutiny of all traffic Ticks requested on the platform... That said, Aggression Volume indicator requests all Tick Data from your Broker and processes it to build a very special version of a Volume Indicator, where Buyers and Sellers aggressions are plotted in a form of Histogram. Additionally,
    FREE
    Big Player Candles
    Flavio Jarabeck
    4.76 (25)
    If you heard about The Wyckoff Method, Volume Spread Analysis, etc... You are probably searching for the candlestick indicator that shows you the Volume spread all over the current bar, signaling every types of market status... You can control the several Market Levels with custom colors... It is up to you to decide how to use it. Our job is provide you with the indicator... If you like this indicator, all I am asking is a little Review (not a Comment, but a REVIEW! )...    This will mean A
    FREE
    MIDAS Super VWAP
    Flavio Jarabeck
    4.23 (13)
    Imagine VWAP, MVWAP and MIDAS in one place... Well, you found it! Now you can track the movement of Big Players in various ways, as they in general pursue the benchmarks related to this measuring, gauging if they had good execution or poor execution on their orders. Traders and analysts use the VWAP to eliminate the noise that occurs throughout the day, so they can measure what prices buyers and sellers are really trading. VWAP gives traders insight into how a stock trades for that day and deter
    FREE
    Closing Price Reversal is a very well known and traded candlestick pattern. This little indicator paints with specific (user-selected) colors the Closing Price Reveral Up and Down patterns, as well as the Inside Bars (as a bonus). Higher timeframes are more effective  as with all other candlesticks patterns. Do NOT trade solely on this indicator. Search the web for "Closing Price Reversal" to learn about the several approaches that can be used with this pattern. One of them is combining short/me
    FREE
    Economic Markers
    Flavio Jarabeck
    4.92 (12)
    Easily get all relevant economic events of the current day right into your chart, as markers. Filter what kind of markers do you want: by country (selected individually) and by Importance (High relevance, Medium, Low or any combination of these). Configure the visual cues to your liking. If there is more than one event set to the very same time, their Names will be stacked and you will see the messages merged with the plus (+) sign on the marker. Obviously that long or too much events on the sam
    FREE
    The Inside Bar pattern is a very well known candlestick formation used widely by traders all over the world and in any marketplace. This approach is very simple and adds a little confirmation candle, so it adds a third past candlestick to the count to confirm the direction of the move (upward or downward). Obviously, there is no power on this candlestick formation if the trader has no context on what it is happening on the market he/she is operating, so this is not magic, this "radar" is only a
    FREE
    Price Momentum
    Flavio Jarabeck
    4.92 (13)
    Value Chart indicator presents the Price evolution in a new form. This indicator, Price Momentum , was developed taking all the calculations presented in the book " Dynamic Trading Indicators " by Mark W. Helweg and David Stendahl (2002). The technique involves de-trended Prices from a user-defined Period of analysis and the addition of a Volatility index correction. The result is an Oscillator with 3 zones: Fair Price Value, Overbought/Oversold and Extremely Overbought/Oversold zones. Adding th
    FREE
    Several assets in several markets have the behavior of using specific numbers as Force Numbers, where support, resistance and price thrust is created. Let this indicator draw those levels of support and resistance for you. You can also stack it to show different level of Prices! This technique is being used by Tape Readers and Order Flow traders all over the world for a long time. Give it a try. Challenge yourself to study new ways of Price Action! SETTINGS What Price reference to use in th
    FREE
    The traditional Money Flow Index indicator, this time, EA friendly . There are 3 buffers exposed that can be used by EAs to automatically analyze the Overbought and Oversold conditions of the quote. Just use the traditional iCustom() function to get these signals. This Money Flow Index calculation is based on the traditional Metaquote's MFI indicator. SETTINGS MFI Period Volume type to analyze (Real Volume or Ticks) Starting Overbought region Starting Oversold region USING WITH EAs Buffer
    FREE
    Waves Sizer
    Flavio Jarabeck
    3.67 (3)
    Wyckoff fans, enjoy! Ideally to be used with the Weis Waves indicator, but it can be easily used alone, the Waves Sizer puts the range (in resulting Price movement) done by the Price on its market swings. You can control how accurate or loose will be the swings. This tool is very helpful for visually know how much the Price has traveled in your Timeframe. This way you can confront this level of effort with the resulting Volume, etc... Weis Waves indicator: https://www.mql5.com/en/market/pro
    FREE
    The concept is simple: Plotting Price behavior within several periods of time. Some Symbols behave very well during the trading day - with this I mean Intraday trading - and this behavior ends up plotting effectively well with the proposed Exponential Moving Averages in this indicator... Obviously that this behavior could not be seen in all Symbols, but you can give it a try... Just drop this indicator in a chart and you will see for yourself... This indicator is intended for "Feeling the Trend
    FREE
    Flux Diffuser
    Flavio Jarabeck
    4.33 (6)
    Based on Brazilian trader André Moraes' Difusor de Fluxo theory, the indicator is a more reliable version of the original MACD. It is a great confirmation indicator for Swing Trading and also can be used as a Day Trading tool. If you are not familiar with the concept or André's trading strategies, I strongly recommend his excelent book named "Se Afastando da Manada" in which he explains in detail how this indicator is used. Even if you don't know the Portuguese language it is not difficult to un
    FREE
    For those who hate candlesticks in lower timeframes (M1 through M15) we "invented" a clean new way to follow Price movement and displacement (volatility) called Price Trail Chart . The big "secret" is to get rid of those annoying candle wicks and draw the whole complete candle without them, this way we get a cleaner chart and a new view of the Price Path. No Open or Close markings, just LOW's and HIGH's, full body candle. Additionaly we inserted a Volume monitor from our Best Downloaded indicat
    FREE
    VWAP and MVWAP
    Flavio Jarabeck
    4.29 (7)
    Volume Weighted Average Price (VWAP) is a trading benchmark commonly used by Big Players that gives the average price a Symbol has traded throughout the day. It is based on both Volume and price. Additionally we put in this indicator the MVWAP (Moving Volume Weighted Average Price). For those who do not know the usage and the importance od this indicator I recommend a great article about this subject at Investopedia ( https://www.investopedia.com/articles/trading/11/trading-with-vwap-mvwap.asp )
    FREE
    Stackable VWAP
    Flavio Jarabeck
    3.8 (5)
    Volume Weighted Average Price (VWAP) is a trading benchmark commonly used by Big Players that gives the average price a Symbol has traded throughout the day. It is based on both Volume and price. Additionally we put in this indicator the MVWAP (Moving Volume Weighted Average Price). For those who do not know the usage and the importance od this indicator I recommend a great article about this subject at Investopedia ( https://www.investopedia.com/articles/trading/11/trading-with-vwap-mvwap.asp
    FREE
    Minions Labs' Candlestick Pattern Teller It shows on your chart the names of the famous Candlesticks Patterns formations as soon as they are created and confirmed. No repainting. That way beginners and also professional traders who have difficulties in visually identifying candlestick patterns will have their analysis in a much easier format. Did you know that in general there are 3 types of individuals: Visual, Auditory, and Kinesthetic? Don't be ashamed if you cannot easily recognize Candlest
    30 USD
    You probably heard about Candlesticks behaviors, which in most of the times could denote and trace Volume behaviors even if you are not watching Volume itself... Well, this indicator will do this. Naked traders love to rely solely on candlesticks patterns and with Candle Zones you can trap special patterns and DRAW THEM on your chart. As simple as that. There are several filters you can tweak in order to achieve the analysis you want. Just give it a try. After several months of testing, we think
    FREE
    Server Clock
    Flavio Jarabeck
    4.88 (8)
    Many friends asked me for a simple, non-obtrusive, resource-friendly clock to track the time during their trades. It seems pretty obvious, but it is a must-have for those trading the market manually, waiting for the Market News, or just to visually know what time it is... Trading is an absorbing endeavor! So, here it is... Totally configurable, including Font Type, Font Size and Chart Location: Upper Left/Center/Right OR Lower Left/Center/Right, with a little twist of adjusting the Offset, just
    FREE
    Market Momentum
    Flavio Jarabeck
    3.86 (7)
    The Market Momentum indicator is based on the Volume Zone Oscillator (VZO), presented by Waleed Aly Khalil in the 2009 edition of the International Federation of Technical Analysts journal, and presents a fresh view of this market valuable data that is oftenly misunderstood and neglected: VOLUME. With this new approach of "seeing" Volume data, traders can infer more properly market behavior and increase their odds in a winning trade. "The VZO is a leading volume oscillator; its basic usefulnes
    FREE
    ATR Monitor
    Flavio Jarabeck
    4.8 (5)
    ATR is a measure of volatility introduced by market technician J. Welles Wilder Jr. in his book, "New Concepts in Technical Trading Systems". In general, traders are accustomed to seeing the ATR in the form of a sub-window indicator. What I am presenting here is a simplified version of ATR - just the current ATR number - very useful for monitoring just the very moment of the current chart. If you want to monitor several timeframes in the same chart, just add the ATR Monitor indicator several tim
    FREE
    ATR Monitor ATR is a measure of volatility introduced by market technician J. Welles Wilder Jr. in his book, "New Concepts in Technical Trading Systems". In general, traders are accustomed to seeing the ATR in the form of a sub-window indicator. What I am presenting here is a simplified version of ATR - just the current ATR number - very useful for monitoring just the very moment of the current chart. And, by default, this indicator will not show up on screen, you can just use the buffers thems
    FREE
    This indicator is EXCLUSIVELY to be used on the Brazilian stock exchange "B3". It automatically calculates the yesterday's Settlement Price (Ajuste) of the Symbol "DOL". It uses a mathematical calculation over the ticks received from the borker server, it DOES NOT access external sources (websites, HTTP connections, etc) so it is safe and totally reliable! For practical purposes and to maintain the longevity of the indicator it was added in the Parameters the ability to control the Time Range in
    FREE
    Arrows Cleaner
    Flavio Jarabeck
    4.83 (6)
    For those who use the Trading Arrows on the chart for later study, but use the Triple Screen approach and got all those arrows everywhere on all additional charts, here it is: Arrows Cleaner! Just drop it on the chart and leave it there. When needed, just with 1-click you get rid of all those annoying arrows... SETTINGS You can position the little Button on any corner of the chart. Additionally you can displace it with the Offset settings. You can enlarge or shrink its size, as well as the tex
    FREE
    The Market Momentum indicator is based on the Volume Zone Oscillator (VZO), presented by Waleed Aly Khalil in the 2009 edition of the International Federation of Technical Analysts journal, and presents a fresh view of this market valuable data that is oftenly misunderstood and neglected: VOLUME. With this new approach of "seeing" Volume data, traders can infer more properly market behavior and increase their odds in a winning trade. "The VZO is a leading volume oscillator; its basic usefulnes
    70 USD
    Easily get all relevant economic events of the current day right into your chart, as markers. Filter what kind of markers do you want: by country (selected individually) and by Importance (High relevance, Medium, Low or any combination of these). Configure the visual cues to your liking. Additionaly you have the ability to add up to 5 personal markers of your own agenda. With Alerts and/or with blackout periods, if you are using it within an Expert Advisor! All in one Economic Calendar indicator
    30 USD
    Фильтр:
    louis1977
    161
    louis1977 2023.02.01 23:38 
     

    Not showing

    dapac
    150
    dapac 2022.11.15 18:29 
     

    Very helpful indicator.

    idrisolamilekan
    38
    idrisolamilekan 2022.10.05 03:05 
     

    Author please will you re update this indicator, cos it does not show on the chart

    Miziomic
    16
    Miziomic 2022.09.22 15:03 
     

    Thank you very helpfoul for those that know and use the wyckoff theory/metodology. To me is very powerfoul if you know what you are doing. So tx again for your job, I did not see it before in MT5

    gelson48
    14
    gelson48 2022.06.26 22:15 
     

    Ele está faltando só fechar no final de cada pernada com mais precisão, ele é bom, para ficar melhor ainda só precisa isto. Quero saber como configurar ele melhor para ser nota 10.

    bgosper1
    121
    bgosper1 2022.06.01 16:26 
     

    Indicator paint/repaints in arrears after moves have already happened. Not useful. Looks great in hindsight but not for forecasting or real time.

    martim souza
    36
    martim souza 2022.05.14 21:07 
     

    A inda não testei mais parece ser bom

    Marcelo Pedro
    18
    Marcelo Pedro 2022.05.05 03:28 
     

    O indicador não aparece o gráfico de histogramas nessa nova versão do MT5. Podem ajudar?

    Everaldo Moraes
    18
    Everaldo Moraes 2022.05.03 18:41 
     

    As barras estão brancas. Já alterei o tempo gráfico, mas continuam brancas. O programa informa que está requisitando as barras passadas ao servidor, mas elas não atualizam. Reiniciei o programa, mas permanece o problema. O volume está configurado para volume real, e o ativo é ação. Reduzi a quantidade de barras passadas para 50, o break para 30, e reiniciei, mas o programa continua requisitando ao servidor e não muda. O número de barras passadas ideal para time frame 5 minutos é 84? Grato.

    Jhonata Uemerson
    21
    Jhonata Uemerson 2022.04.20 14:14 
     

    Não funciona aqui. Não tá gerando o histograma mesmo em configuração por tick (para forex). Poderia ajudar?

    Flavio Jarabeck
    442803
    Ответ разработчика Flavio Jarabeck 2022.04.20 14:41
    Então seu Broker não gera esses dados. O que diz a aba Experts?
    Reynaldo surf
    73
    Reynaldo surf 2022.03.19 01:04 
     

    excelente indicado, quando o preço estar em ranges tem que ler com precisão! Obrigado

    Moisesmel
    21
    Moisesmel 2021.12.03 22:38 
     

    Esse indicador não funcionou no FOREX, não aparece as barras. Não sei se precisa de alguma configuração...se alguém puder ajudar, ...muito obrigado.

    Flavio Jarabeck
    442803
    Ответ разработчика Flavio Jarabeck 2021.12.03 22:47
    Você configurou o VOLUME corretamente??
    Dorian E.
    68
    Dorian E. 2021.10.05 06:07 
     

    doesnt work.

    taxmedicine
    15
    taxmedicine 2021.09.04 09:37 
     

    Past Bars Volume Data not received from the server yet.... Waiting ... Error : 44043 . The indicator isnt working

    Flavio Jarabeck
    442803
    Ответ разработчика Flavio Jarabeck 2021.09.04 13:02
    If you are using on Forex, use the correct Volume setting, which is "TICKS". Forex does not have Real volume.
    vince cent
    128
    vince cent 2021.05.16 17:47 
     

    To get Weis Just need another indicator. This don't work. One bar and an error message.

    Flavio Jarabeck
    442803
    Ответ разработчика Flavio Jarabeck 2021.09.04 13:02
    If you are using on Forex, use the correct Volume setting, which is "TICKS". Forex does not have Real volume.
    Vilarinho
    16
    Vilarinho 2021.04.16 23:18 
     

    Um ótimo indicador, mas tem o defeito de parar do nada e mostra como erro. daí tem q mudar o tempo gráfico e voltar para ele atualizar...

    Cavalcante92
    26
    Cavalcante92 2021.03.02 01:28 
     

    é bom, mas precisa da uma melhorada, está apresentando alguns bugs , demorando dar as respostas quando a onda gira

    Michael Dias
    145
    Michael Dias 2020.12.26 04:55 
     

    O indicador é bom sempre usei Weis Wave, mais precisa melhorar um pouco no carregamento, tem uns delay no carregamento da umas travada e as vezes tem que trocar de M1 para M5 para atualizar.

    valdecism
    118
    valdecism 2020.12.06 22:36 
     

    I am trying it yet. Looks good! Thanks to developer for share it with us.

    vassill
    22
    vassill 2020.11.22 08:20 
     

    Отлично

    12
    Ответ на отзыв
    Версия 1.4 2020.06.06
    :: Recompiled (obligatory by Metaquotes as of June,05,2020) to the new MT5 version 2485. Please let me know if anything weird happens...
    Версия 1.3 2020.05.15
    :: ADDED the ability to "break the wave" for tick Symbols less than 1 (decimals).