HannFlow
- Индикаторы
-
Kareem Abdelhakim
 MQL4 , 5 Developer with more than 10 years of experience developing mt4/5 apps for my clients
- Версия: 1.0
- Активации: 10
🚀 Key Features
- Advanced Directional Movement Analysis: Evaluates the net difference between positive and negative directional movement.
- Hann Window Filtering: Applies specialized Hann Window weighting to the smoothed directional movement calculations to minimize noise.
- RMA Smoothing: Effectively reduces short-term market fluctuations and whipsaws in calculated values.
- Dual Visualization: Displays directional momentum cleanly through both a dynamic colored line and zero-baseline histogram bars.
- Clear Directional Identification: Blue indicates positive momentum / bullish bias; Red indicates negative momentum / bearish bias.
- Advanced Divergence Detection: Identifies discrepancies between price action and momentum, providing early warnings of potential trend reversals.
- Adjustable Calculation Period: Fully customizable sensitivity (Default Period: 13 ) to match your preferred trading timeframe and style * Recommended values on of ( 3,5,8,13,21,34,55 ) following the Fibo numbers pattern.The shorter the period the more sensitive the indicator to price movement suitable for quick scalping
- Dedicated Indicator Window: Keeps the main price chart uncluttered and organized for optimal technical analysis.
- Versatile Technical Compatibility: Pairs effortlessly with PSAR, price action, market structures, and institutional levels for powerful cnfirmation.
📊 How to Read HannFlow
- Indicator Color & Line:
- Blue: Positive directional momentum / Bullish bias.
- Red: Negative directional momentum / Bearish bias.
- Note: A change in color crossing the zero baseline indicates a potential shift in structural directional dominance.
- Histogram Bars:
- Expanding Positive Bars: Increasing bullish directional pressure.
- Contracting Positive Bars: Weakening bullish momentum.
- Expanding Negative Bars: Increasing bearish directional pressure.
- Contracting Negative Bars: Weakening bearish momentum.
🔄 DETECTING EARLY REVERSALS WITH DIVERGENCE
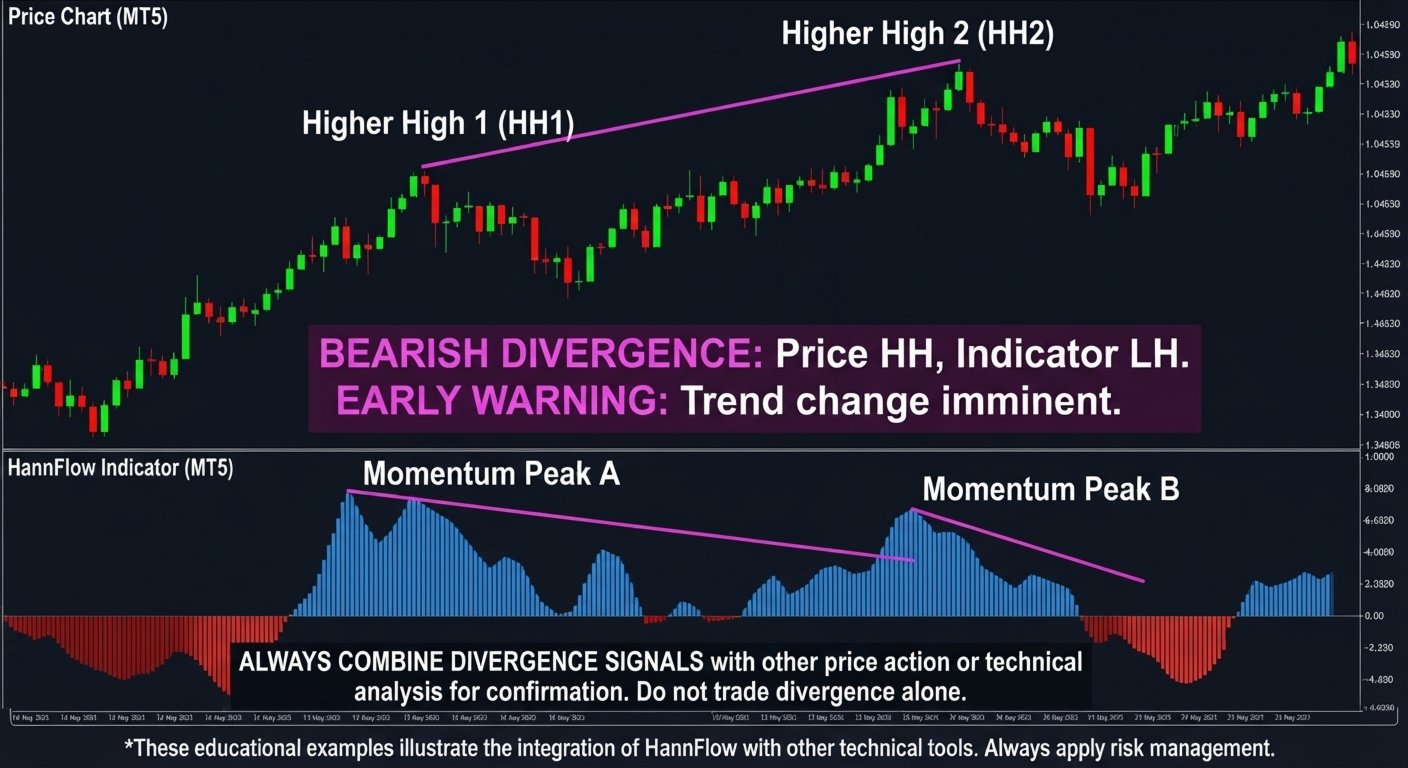
Bearish Divergence (As seen in the screenshot below)
- Description: Occurs when the price creates a new Higher High (HH), but the HannFlow indicator fails to confirm this new high and instead forms a Lower High (LH).
- Implication: This indicates weakening bullish momentum despite the rising price, serving as an early warning of a potential bearish reversal. The uptrend is losing steam.
Bullish Divergence
- Description: Occurs when the price creates a new Lower Low (LL), but the HannFlow indicator fails to confirm this new low and instead forms a Higher Low (HL).
- Implication: This indicates weakening bearish momentum despite the falling price, serving as an early warning of a potential bullish reversal. The downtrend is losing steam.
📈 Preferred Trading Strategies
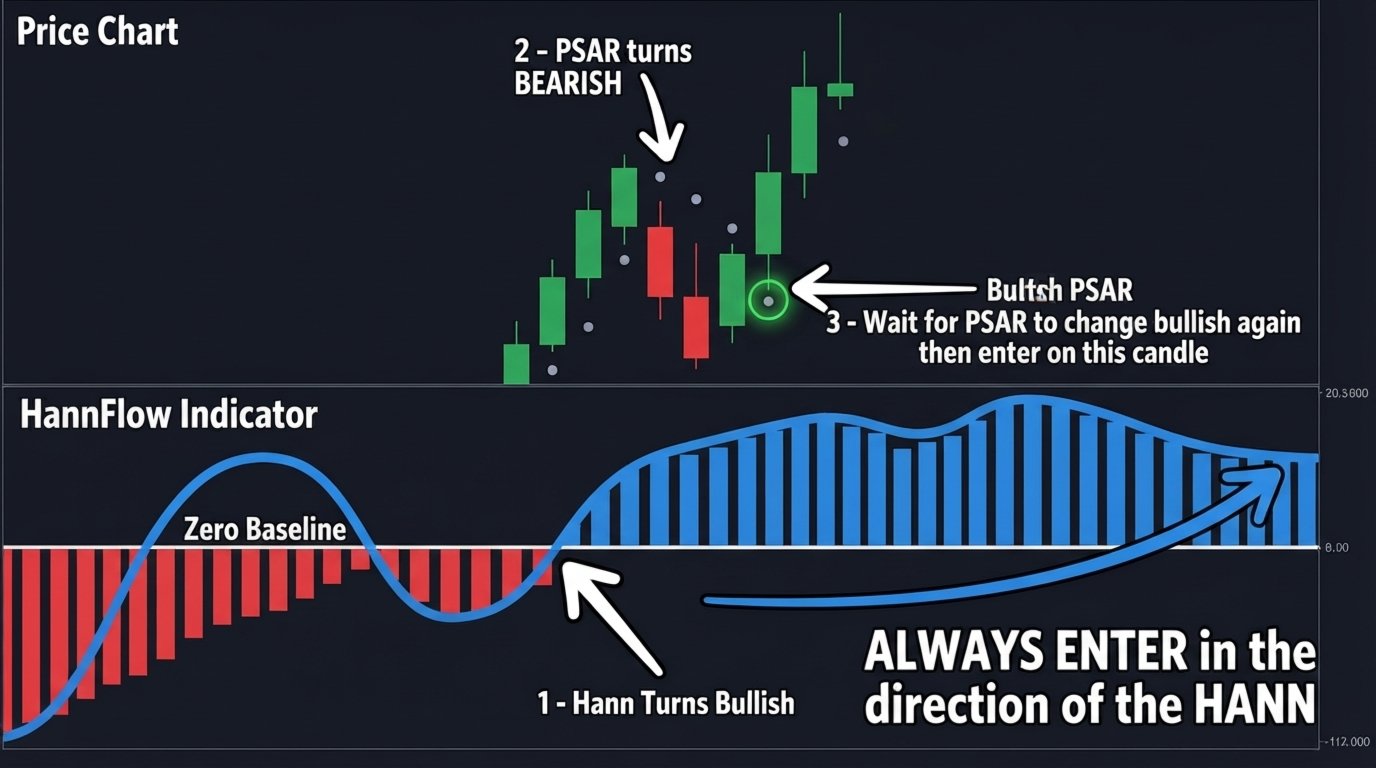
Strategy 1: Trend Continuation with HannFlow + Parabolic SAR (PSAR)
- Concept: Combines HannFlow's directional momentum with PSAR to capture entries following a temporary countertrend pullback in an established trend.
- Buy Setup Execution:
- Wait for HannFlow to change from Bearish (Red) to Bullish (Blue) to establish a bullish bias.
- Watch for PSAR to temporarily flip bearish (dots appearing above price) during a minor pullback.
- Wait for PSAR to flip bullish again (dots returning below price), and enter a BUY position on that confirmation candle
Strategy 2: HannFlow + Support/Resistance & Order Blocks (OB)
-
Concept: Combines HannFlow's directional shift with market structure and key technical levels to trade institutional retracements.
-
Buy Setup Execution:
-
Wait for HannFlow to change from Bearish (Red) to Bullish (Blue) to establish a bullish bias.
-
Wait for price to retrace toward a relevant technical area (such as a Support level, Bullish Order Block, or Fibonacci retracement zone).
-
Look for bullish price action (such as a first touch or an engulfing reaction) at the technical level and execute a BUY entry.
-
-
Sell Setup Execution:
-
Wait for HannFlow to change from Bullish (Blue) to Bearish (Red) to establish a bearish bias.
-
Wait for price to retrace toward a relevant technical zone (such as Resistance, Bearish Order Block, or key Fibonacci level).
-
Look for bearish price action confirmation at the zone and execute a SELL entry.
-
Strategy 2: Reversal Trading with HannFlow + Divergence + Price Action
- Concept: Combines an early reversal warning (Divergence) with key technical areas (Support/Resistance, Order Blocks, Fibonacci) and price action confirmation to time your entries near a trend change.
- Buy Setup Execution (Potential Reversal from a Downtrend):
- Detect Bullish Divergence (Price LL, Indicator HL) on HannFlow, signaling a potential end to the downtrend.
- Wait for price to retrace toward a relevant technical area, such as a Support level, a Bullish Order Block, or a key Fibonacci level.
- Look for bullish price action confirmation (e.g., a Bullish Engulfing bar, a "first touch" and rejection) at the technical level and execute a BUY entry.
⚠️ Professional tips
- Focus on the First 1–2 Entry Opportunities: After HannFlow changes direction (or after a confirmed divergence), focus exclusively on the first valid entry setup or a maximum of two opportunities. Avoid chasing late signals deep into an established move.
- Always Consider Higher-Timeframe Trend Context: Align your trades with broader market momentum (e.g., use H4 for macro direction, H1 for intermediate momentum, and M15 for precise execution entries). Divergence signals are more powerful when confirmed on higher timeframes.
- Prioritize Setups with a Favorable Risk-to-Reward Ratio (>1:1 RRR): Always target trade setups that offer a Risk-to-Reward Ratio greater than 1:1 (such as 1:2 or higher) before your stop-loss or next major opposing technical level. Filtering out low-reward setups ensures long-term mathematical edge and protects capital during inevitable losing streaks.