MTF Pult
- Индикаторы
- Версия: 1.0

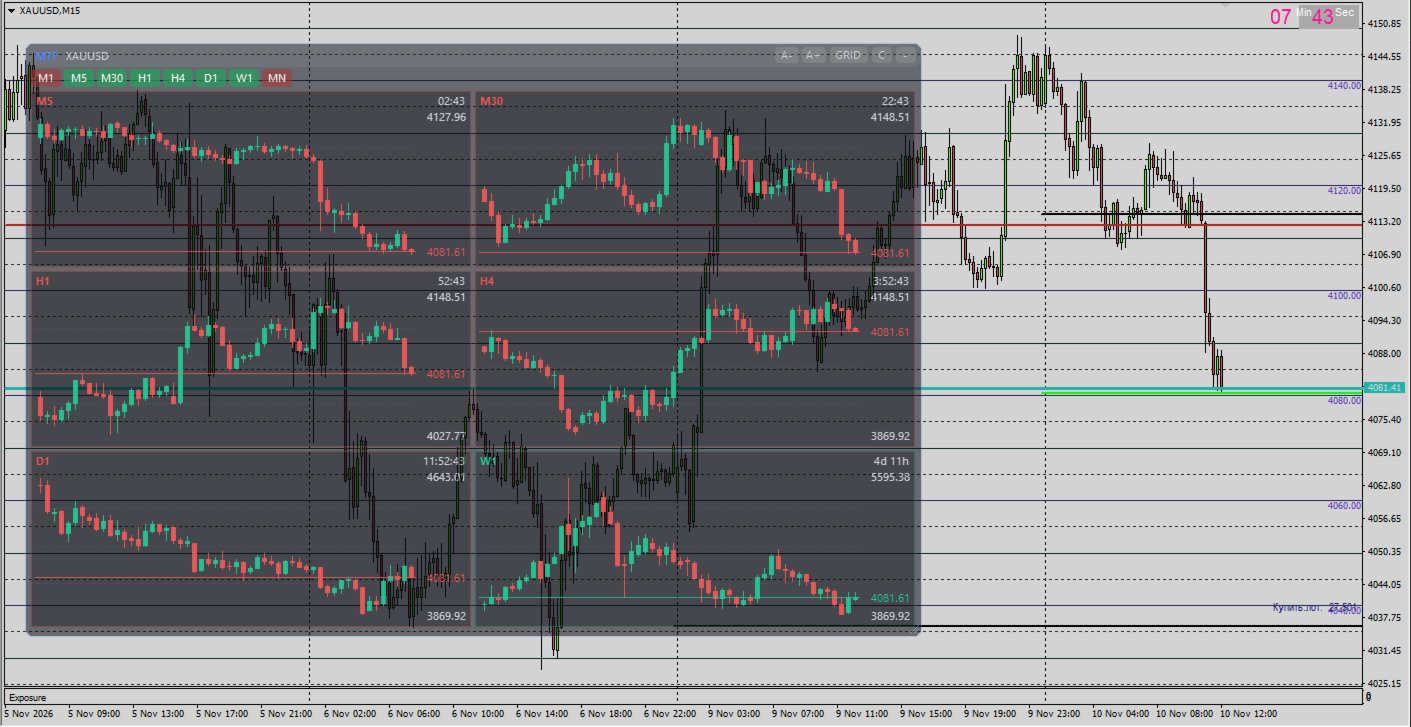
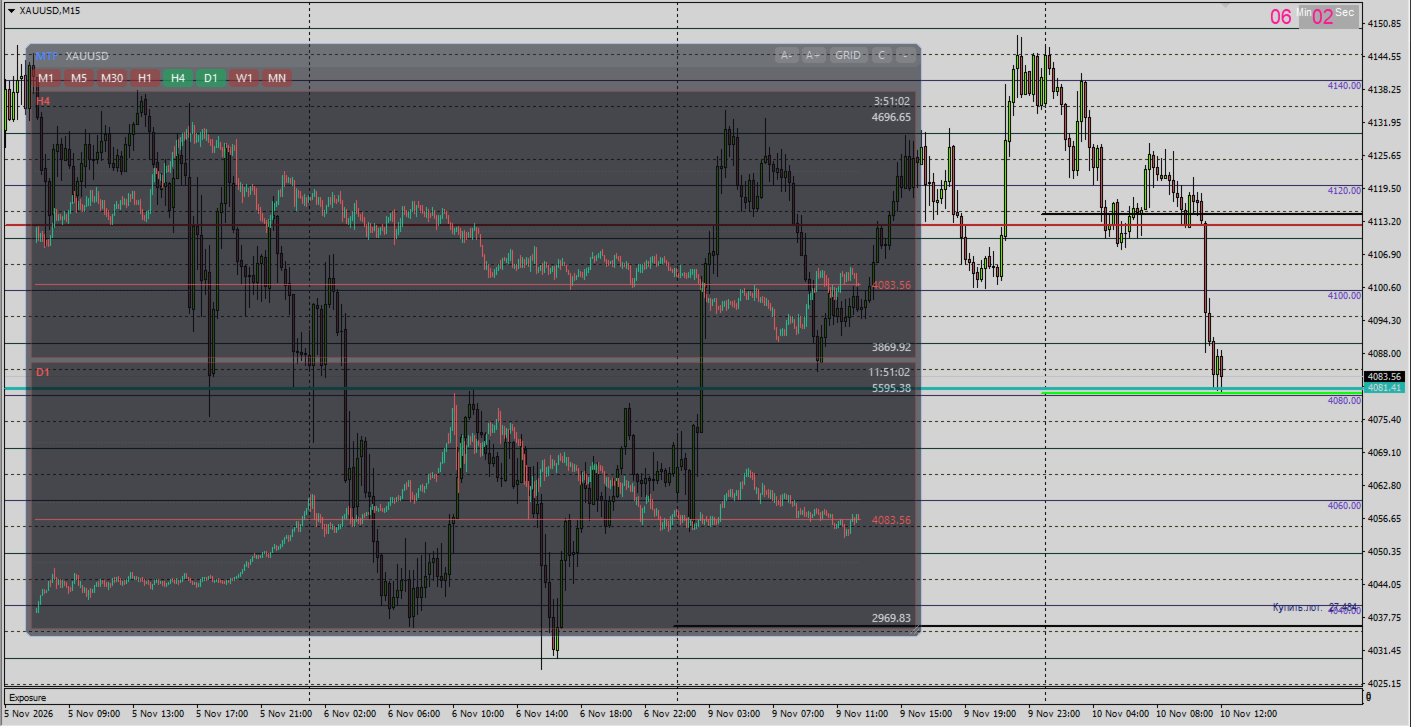
MTF Pult is a "timeframe remote control" for MetaTrader 4. A transparent panel with mini-charts of all other timeframes appears right on top of your chart. Trade on M15 and you instantly see M1, M5, M30, H1, H4, D1 and more, without switching the chart. Drag the panel anywhere, stretch it to any size, collapse it to a thin strip and switch between four view modes. The indicator never trades: it does not open, close or modify orders.
Who it's for
Traders who work with several timeframes at once and want to:
- see higher and lower timeframes at the same time, without constant switching;
- check an entry on the working timeframe against the higher-timeframe context and the lower-timeframe precision;
- watch how the current candle develops on every timeframe and how long is left until it closes;
- avoid cluttering the workspace with a dozen chart windows.
Features
- Mini-charts of the other timeframes. The chart's current timeframe is hidden automatically: on M15 the panel shows M1, M5, M30, H1, H4, D1, W1, MN (you choose which ones).
- Candle count follows panel size. Stretch the panel and every cell shows more candles. Candle size changes with the A−/A+ buttons (one common scale for all timeframes).
- Transparent panel. True background transparency (in percent), rounded corners, clean candles. The chart underneath stays visible.
- Draggable and resizable. Drag by the header, resize by the bottom-right corner or the edges. The panel never leaves the chart window, neither when moved nor when resized.
- Collapsible. A "–/+" button or a hotkey. When collapsed, colored timeframe tags remain (green/red — direction of the current candle).
- Timeframe buttons. Enabled = green button, disabled = red button. One click adds or removes a timeframe.
- 4 view modes (switched with a header button):
- GRID — grid, cell size is chosen automatically;
- COLS — timeframes stacked vertically, full-width cells;
- ROWS — timeframes in one row;
- ONE — a single timeframe, large; the timeframe buttons act as tabs.
- 3 chart types: candlesticks, bars, line (C / B / L button).
- Per-cell information: timeframe name, color by current candle direction, time left until the candle closes, last-price line and value, high and low of the visible range, an unobtrusive grid.
- Remembers its state. Position, size, mode, chart type, scale, selected timeframes and collapsed/expanded state are saved per chart.
How to use
- Drop the indicator on a chart.
- Drag the panel by its header, stretch it by the corner.
- The timeframe buttons under the header turn timeframes on and off: green = shown, red = hidden.
- GRID / COLS / ROWS / ONE — view mode. C / B / L — candles, bars, line. A− / A+ — candle scale.
- "–" collapses the panel, "+" expands it. The hotkey (default M ) does the same.
A full list of settings is in SETTINGS_EN.md .
Technical notes
- Platform: MetaTrader 4, build 600 or newer.
- The panel is drawn in the chart window as a single transparent image. No DLLs, no internet access.
- It does not trade or modify orders. It uses no indicator buffers — nothing is drawn on the chart except the panel.
- Data for each timeframe comes from the terminal's history. If a timeframe's history is not loaded yet, the cell shows "loading…" and fills in automatically.
- Redraw is timer-driven, at most ~15 times per second, so the load on the terminal is small.
- While the cursor is over the panel, mouse scrolling of the chart is temporarily locked (so dragging the panel does not move the chart).
- Time to candle close is calculated from the broker's server time.