ICT Trend
- Индикаторы
- Nawal Kishor Yadav
- Версия: 5.40
- Активации: 5
SHORT DESCRIPTION (140 characters)
Precision market structure dots, Enter Here signals & multi-timeframe dashboard — all in one clean indicator.
FULL PRODUCT DESCRIPTION
🎯 See the Market the Way Professional Traders Do
ICT Structure Labels is a powerful, all-in-one market structure indicator that automatically identifies key turning points on your chart, marks exact entry zones, and gives you a live multi-timeframe bias dashboard — so you always know where you are in the market and when to act.
No repainting. No clutter. Just the cleanest, most actionable structure overlay available for MetaTrader 5.
✅ What You Get
🔵 Precision Structure Dots
Small, colour-coded circle dots appear directly above or below key price turning points the moment they are confirmed. These dots visually separate significant market pivots from ordinary price noise, helping you instantly read whether the market is making meaningful highs and lows.
- Red dots mark confirmed bearish turning points (supply zones, potential reversal highs)
- Green dots mark confirmed bullish turning points (demand zones, potential reversal lows)
- Dot size and colour are fully customisable
📍 Enter Here Arrows
After a key turning point is confirmed, the indicator automatically marks the very next optimal entry bar with a large arrow and "Enter Here" label — removing all guesswork about when to pull the trigger.
- Orange downward arrow = short/sell entry opportunity
- Blue upward arrow = long/buy entry opportunity
- These signals fire at the precise bar where price is most likely to continue in the structure direction
📐 Trend Connection Lines + Auto Labels
The indicator draws clean trend lines connecting confirmed structure points and automatically labels each line with its market context — Bullish Trend, Bearish Trend, Bullish Divergence, or Bearish Divergence — directly on the line in a perpendicular orientation. Labels reposition themselves automatically whenever you scroll or zoom the chart.
- 4 independently configurable line colours
- 4 independently configurable label colours
- Lines are non-selectable and stay out of your way
📊 Multi-Timeframe Dashboard (MTF Panel)
A sleek, dark-themed dashboard panel sits in the upper-right corner of your chart and gives you the trend bias for 5 timeframes simultaneously:
| Timeframe | Shows |
|---|---|
| 15 MIN | Short-term trend |
| 1 HR | Intraday trend |
| 4 HR | Swing trend |
| Daily | Position trend |
| Weekly | Macro trend |
Each row displays BULL (green) or BEAR (red) — updated automatically on every new bar.
⚡ Enter Here Dashboard
A second panel below the trend dashboard shows directional arrows for 1 min, 5 min, and 15 min entry timeframes, aligned with higher timeframe structure. This is your real-time confirmation layer — at a glance you can see whether the short-term entry timeframe is aligned with the dominant trend.
🛠️ Full Customisation
Every visual element is customisable through a clean, grouped input panel:
Swing Detection
- Adaptive mode (auto-adjusts sensitivity per timeframe) or manual bar-strength setting
- Control how many recent structure points are displayed
Dot Style
- Dot size
- Separate colours for bullish and bearish dots
Line & Label Style
- Individual colours for all 4 line/label types
- Line width
- Font name and size
- Label offset distance
Enter Here Arrows
- Separate colours for buy and sell entry arrows
- Offset distance from candle tip
Dashboard
- Show/hide the entire dashboard
- Bull colour, Bear colour
- Background colour
- Border/separator colour
Visibility Toggles
- Show/hide structure dots independently
- Show/hide Enter Here arrows
- Show/hide trend connection lines
⚙️ Technical Specifications
| Property | Value |
|---|---|
| Platform | MetaTrader 5 |
| Type | Custom Indicator |
| Chart Window | Overlay (main chart) |
| Indicator Buffers | 0 (no buffer plots) |
| Timeframes | All timeframes supported |
| Recommended TF | M1 to D1 |
| MTF Dashboard | M15, H1, H4, D1, W1 |
| Strategy Tester | ✅ Fully compatible |
| CPU Optimised | ✅ Dashboard updates on new bar only |
| Repaint | ❌ No repaint — all signals confirmed |
📈 How Traders Use This Indicator
Day traders use the Enter Here arrows on M1 and M5 charts with the Enter Here dashboard confirming the 15 MIN and 1 HR trend alignment.
Swing traders use the structure dots on H1 and H4 to identify key turning points, then wait for confluence with the Daily and Weekly dashboard trend reading.
Scalpers use the MTF dashboard as a quick visual filter — only taking Enter Here signals when the 15 MIN and 1 HR dashboard agree.
Position traders use the trend connection lines on Daily charts to track large market cycles and divergence patterns.
🔒 Strategy Tester Compliance
This indicator is fully compliant with MQL5 Market testing requirements:
- All heavy multi-timeframe calculations are completely skipped inside the Strategy Tester — no timeout errors, no validation failures
- Chart objects are properly initialised and cleaned up on every init/deinit cycle
- Dashboard rendering is rate-limited to new bars only, keeping CPU usage minimal even on tick-by-tick backtests
📦 Versions & Updates
| Version | Key Changes |
|---|---|
| v5.4 | Dashboard layout fix; individual line & label colours per structure type; full Strategy Tester compliance |
| v5.3 | MTF dashboard added; Enter Here dashboard added |
| v5.x | Core structure detection engine |
All future updates are free for existing buyers.
❓ Frequently Asked Questions
Does this repaint? No. All structure signals are only displayed after they are fully confirmed by the required number of bars on both sides. A signal that appears will not disappear or move.
Does it work on all symbols? Yes — Forex pairs, indices, commodities, crypto, and stocks. The indicator auto-adjusts its sensitivity based on the timeframe you are viewing.
Can I use it with an EA? Yes. The indicator's visual signals can be used as a reference layer alongside any compatible Expert Advisor.
Is the Strategy Tester supported? Yes. The indicator passes all MQL5 Market compliance checks and runs without errors or timeouts in the Strategy Tester.
How many charts can I use it on? As many as your MT5 licence allows. One purchase covers all your charts.
🖥️ Screenshots
(Upload the following chart screenshots in the MQL5 product listing)
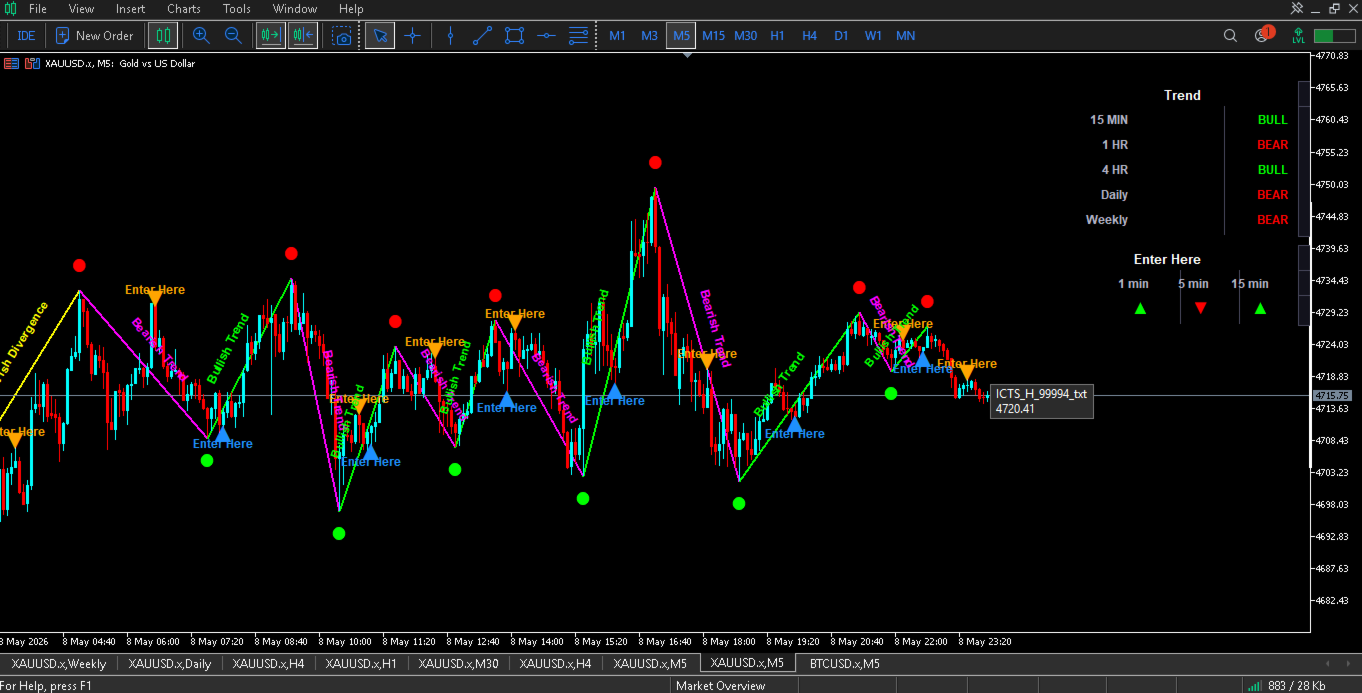
- M5 chart showing green/red dots with Enter Here arrows firing at a clean structure turn
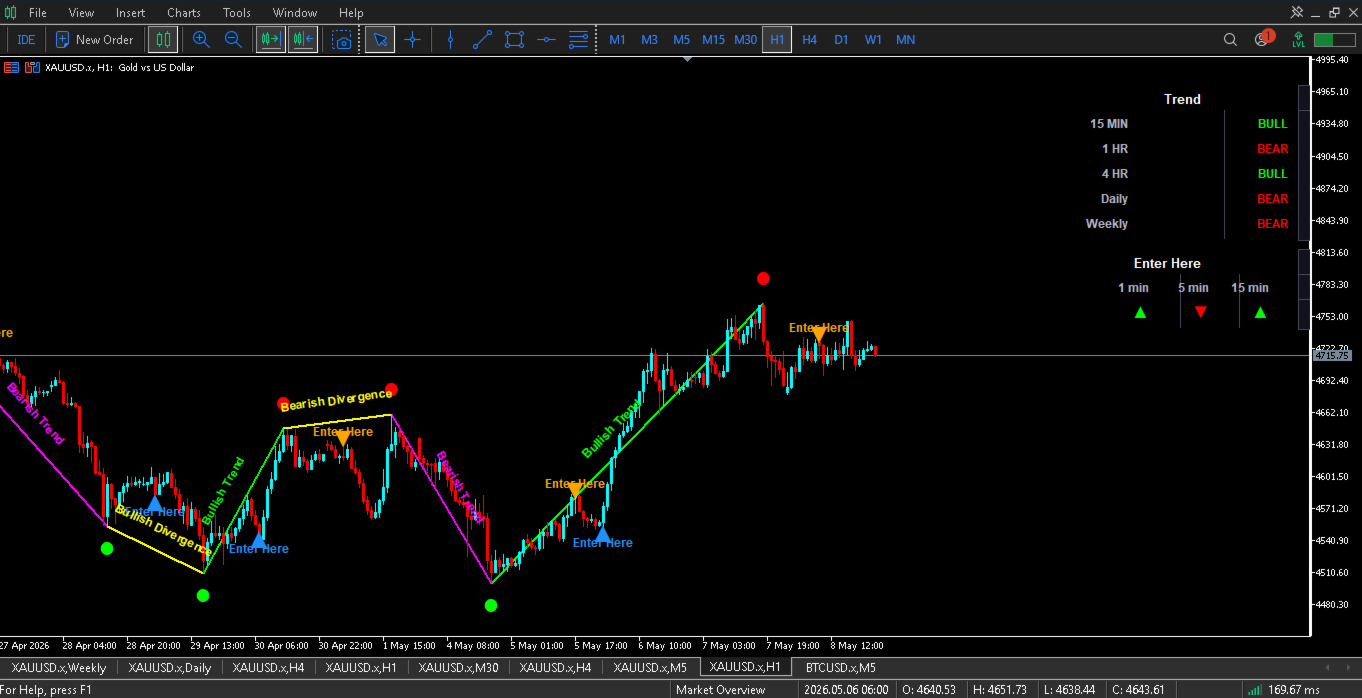
- H1 chart showing trend connection lines with "Bullish Trend" / "Bearish Trend" labels
- Dashboard panel close-up showing BULL/BEAR rows and Enter Here arrows
- Split-screen: M5 chart + dashboard fully visible, multiple signals in view
- Strategy Tester results screenshot showing clean compilation and no errors
© ICT Trend 9 — All rights reserved. Source code is protected and not included.