• Обзор
  • Отзывы
  • Обсуждение
  • Что нового

Grafico de Rompimento

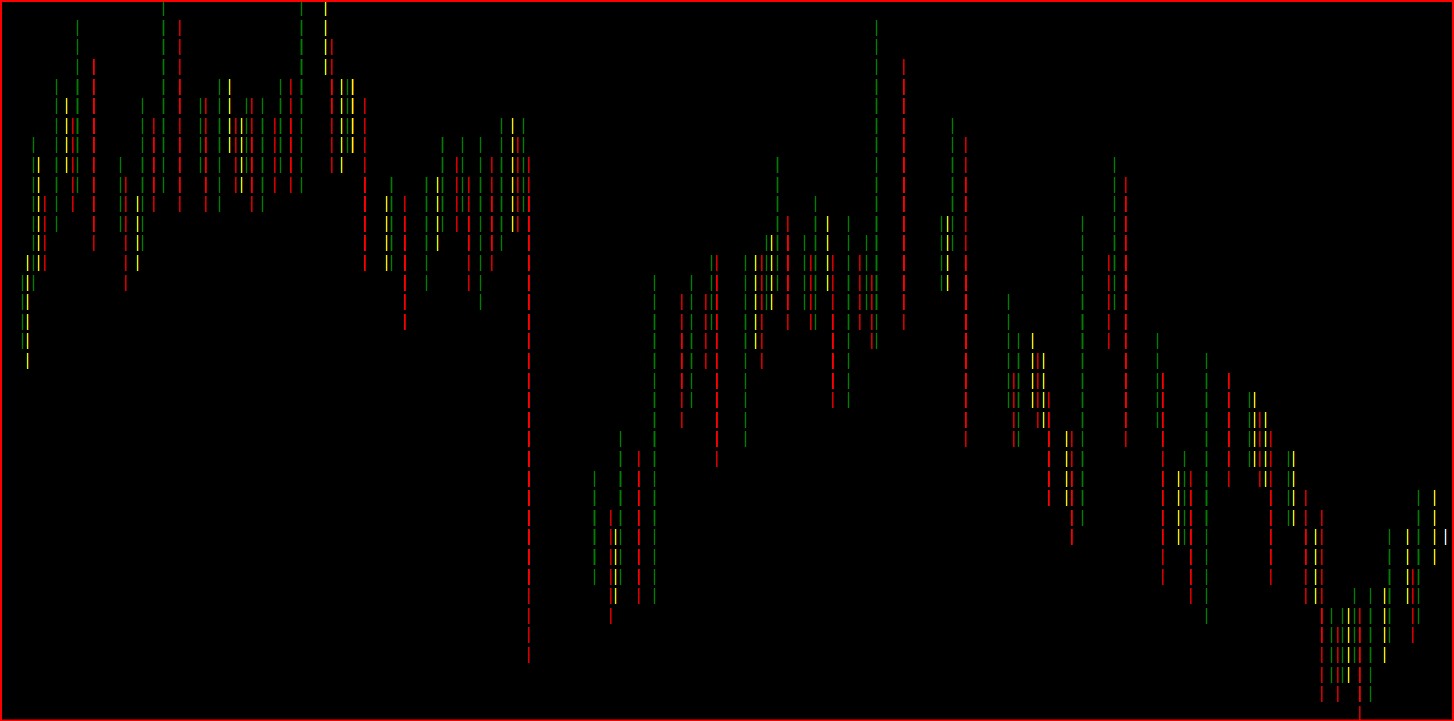
O indicador grafico de rompimento foi desenvolvido para elevar a precisão e confiabilidade na identificação de oportunidades de rompimento no mercado financeiro. Projetado com algoritmos avançados, este indicador destaca barras de rompimento com uma precisão notável, permitindo que traders identifiquem pontos de entrada e saída estratégicos.

Recursos Principais:

  1. Precisão Aprimorada: Utiliza algoritmos avançados para identificar barras de rompimento com uma precisão excepcional.
  2. Alertas em Tempo Real: Receba alertas instantâneos quando ocorrem rompimentos significativos, permitindo uma resposta rápida às condições do mercado.
  3. Interface Intuitiva: Design intuitivo e amigável, tornando o indicador acessível a traders de todos os níveis de experiência.
  4. Compatibilidade Total: Funciona perfeitamente em todos os pares de moedas e prazos, proporcionando versatilidade em diferentes estratégias de negociação.


Рекомендуем также
Volume Weighted Average Price or VWAP is an indicator wich shows different average prices on chart. This is very useful to find strong negotiation price areas and as trend following. Configurations: Day, Week and Month - Show different VWAPs according to the period. You can change each line style on "colors" tab. Any doubt or suggestion please contact us. Enjoy! This is a free indicator, but it took hours to develop. If you want to pay me a coffee, I appreciate a lot   <3 PayPal, Skrill, Ne
FREE
Weis Waves
Flavio Javier Jarabeck
3.15 (26)
The original author is David Weis, an expert in the Wyckoff Method. The Weis Wave is a modern adaptation of the 1930's Wyckoff Method, another expert in Tape Reading techniques and Chart Analysis. Weis Waves takes market volume and stacks it into waves according to price conditions giving the trader valuable insights about the market conditions. If you want to learn more about this subject you can find tons of videos in YouTube. Just look for "The Wickoff Method", "Weis Wave" and "Volume Spread
FREE
Donchian Channel is an indicator created by Richard Donchian. It is formed by taking the highest high and the lowest low of the last specified period in candles. The area between high and low is the channel for the chosen period. Its configuration is simple. It is possible to have the average between the upper and lower lines, plus you have alerts when price hits one side. If you have any questions or find any bugs, please contact me. Enjoy!
FREE
Value Chart Candlesticks
Flavio Javier Jarabeck
4.67 (9)
The idea of a Value Chart indicator was presented in the very good book I read back in 2020 , " Dynamic Trading Indicators: Winning with Value Charts and Price Action Profile ", from the authors Mark Helweg and David Stendahl. The idea is simple and the result is pure genius: Present candlestick Price analysis in a detrended way! HOW TO READ THIS INDICATOR Look for Overbought and Oversold levels. Of course, you will need to test the settings a lot to find the "correct" one for your approach.
FREE
Donchian Pro
Paulo Henrique Faquineli Garcia
5 (2)
The Donchian Channel Channels are among the most popular tools of technical analysis, as they visually convey to the analyst the limits within which most price movement tends to occur. Channel users know that valuable information can be obtained at any time, whether prices are in the central region of a band or close to one of the border lines. One of the best known techniques to explore these concepts is Bollinger Bands. However, John Bollinger was not the only one to research the applicatio
FREE
Add a watermark in the background of your charts, containing the Stock Symbol followed by the current Timeframe, and the Symbol Description below it. Have you ever seen videos or screenshots of other platforms, boasting those great looking watermarks, and wondered why your MetaTrader5 doesn't have one? Well, I did... so I tried the very few options available in the Market at the time, but I still wanted to tweak everything exactly to my taste. So I developed my own solution, and now I am proud
FREE
VWAP Indicator
LUC JACOBUS A VERHEECKE
4.19 (21)
Volume Weighted Average Price (VWAP) The volume weighted average price (VWAP) is a   trading   benchmark   used by traders that gives the average price a security has traded at throughout the day, based on both volume and price. It is important because it provides traders with insight into both the trend and value of a security. This indicator VWAP V2 is free and is the manual version of the extended Easy VWAP indicator (30 Euro), where the date and time properties are automatically entered. Wit
FREE
MIDAS Super VWAP
Flavio Javier Jarabeck
4.29 (14)
Imagine VWAP, MVWAP and MIDAS in one place... Well, you found it! Now you can track the movement of Big Players in various ways, as they in general pursue the benchmarks related to this measuring, gauging if they had good execution or poor execution on their orders. Traders and analysts use the VWAP to eliminate the noise that occurs throughout the day, so they can measure what prices buyers and sellers are really trading. VWAP gives traders insight into how a stock trades for that day and deter
FREE
Aggression Volume
Flavio Javier Jarabeck
3.8 (20)
Aggression Volume Indicator is the kind of indicator that is rarely found in the MQL5 community because it is not based on the standard Volume data provided by the Metatrader 5 platform. It requires the scrutiny of all traffic Ticks requested on the platform... That said, Aggression Volume indicator requests all Tick Data from your Broker and processes it to build a very special version of a Volume Indicator, where Buyers and Sellers aggressions are plotted in a form of Histogram. Additionally,
FREE
This is a buyer and seller aggression indicator that analyzes the shape of each candle and project this data in a histogram form. There are 4 histograms in one. On the front we have two: Upper - Buyer force. Lower - Seller force. At the background we also have two histogram, both with same color. They measure the combined strenght of buyers and sellers. This histograms can be turned off in Input Parameters. It is also possible to have the real or tick volume to help on this force measurement. IN
FREE
The Penta-O is a 6-point retracement harmonacci pattern which usually precedes big market movements. Penta-O patterns can expand and repaint quite a bit. To make things easier this indicator implements a twist: it waits for a donchian breakout in the right direction before signaling the trade. The end result is an otherwise repainting indicator with a very reliable trading signal. The donchian breakout period is entered as an input. [ Installation Guide | Update Guide | Troubleshooting | FAQ | A
FREE
Are you tired of drawing trendlines every time you're analyzing charts? Or perhaps you would like more consistency in your technical analysis. Then this is for you. This indicator will draw trend lines automatically when dropped on a chart. How it works Works similar to standard deviation channel found on mt4 and mt5. It has 2 parameters: 1. Starting Bar 2. Number of bars for calculation The   starting bar   is the bar which drawing of the trend lines will begin, while the   number of bars for c
FREE
Follow The Line MT5
Oliver Gideon Amofa Appiah
4.4 (30)
This indicator obeys the popular maxim that: "THE TREND IS YOUR FRIEND" It paints a GREEN line for BUY and also paints a RED line for SELL. (you can change the colors). It gives alarms and alerts of all kinds. IT DOES NOT REPAINT and can be used for all currency pairs and timeframes. Yes, as easy and simple as that. Even a newbie can use it to make great and reliable trades. NB: For best results, get my other premium indicators for more powerful and reliable signals. Get them here: https://www.m
FREE
Bar Color Trend
Germano Chagas
4.5 (10)
Combining the best of Price Action , Directional Movement , and Divergence/Convergence analysis, Candle Color Trend is a easy and reliable way to identify trend direction. The indicator automatically paints the candles according to the assumption that an uptrend is defined by prices that form a series of higher highs and higher lows. In contrast, a downtrend is defined by prices that form a series of lower highs and lower lows. Additionally, ADX Wilder indicator is used to measure trend weakness
FREE
White Weis Volume Ticks
Ricardo Almeida Branco
5 (3)
White Weis Volume This indicator shows the sum of the volume in each wave, bulish or bearish, as idealized by David Weis , but it brings an important addition , which is the marking of the bar with the highest volume of the wave (White Bar)! In coding the indicator, it was sought to optimize the code to require minimal processing during use and not to overload mt5. The indicator can be used for pre-trading analysis and study, where the trader analyzes possible points of support and resi
Indicator introduction: The indicator draws wave lines and histograms, It has small price lag, and the signal will not drift. The indicator can send emails, alerts and notifications to you when previous k line has an up arrow and it is under the histogram sections or it has a down arrow. you can choose whether or not to send the two kind of alerts, the alerts repetition times can also be changed. If the indicator appears red and green histograms, this is a buy zone. It can be used to analyze mar
FREE
Simple Weis Wave
Jean Jacques Huve Ribeiro
4.2 (5)
One of the best tools for analyzing volume, Weis Wave was idelized by David Weis, to facilitate the reading of directional flow. For the VSA method disciples it is an evolution of the practices created by Richard Wycoff, facilitating a predictive reading of the market, always seeking an accumulation and distribution of the negotiated contracts. Cumulative wave volume  Range of wave ( removed) Average Wave volume Ref "Tim Ord lectures" ( removed)
FREE
QuantumAlert RSI Navigator is a free indicator available for MT4/MT5 platforms, its work is to provide "alerts" when the market is inside "overbought and oversold" regions in the form of "buy or sell" signals. This indicator comes with many customization options mentioned in the parameter section below, user can customise these parameters as needful. Join our MQL5 group , where we share important news and updates. You are also welcome to join our private channel as well, contact me for the priva
FREE
MW Volume
Martin Bittencourt
4 (5)
The Martinware Volume indicator plots a colored moving average over volume bars. The coloring uses three colors and can be done in different ways choosable by the user and is applied both to the average as to the volume bars. Three types of coloring are possible: None: no coloring is done Increasing or decreasing: changes the color depending on the current value being bigger or lesser than the previous one Volume relative to average: colors vary if the current volume is bigger or lesser then
FREE
Free automatic Fibonacci is an indicator that automatically plots a Fibonacci retracement based on the number of bars you select on the BarsToScan setting in the indicator. The Fibonacci is automatically updated in real time as new highest and lowest values appears amongst the selected bars. You can select which level values to be displayed in the indicator settings. You can also select the color of the levels thus enabling the trader to be able to attach the indicator several times with differe
FREE
Индикатор Volume Weighted ATR - полезный инструмент для измерения рыночной активности. В его основе лежит идея индикатора Volume-Weighted ATR. Сочетание этих двух элементов помогает определить потенциальные поворотные точки или возможности для прорыва. Индикатор для классификации активности рынка использует скользящую среднюю и ее мультипликаторы. Соответственно, где находится бар VWATR (относительно скользящей средней), он маркируется как сверхнизкий, низкий, средний, высокий, очень высокий или
FREE
Cybertrade Keltner Channels - MT5 Created by Chester Keltner, this is a volatility indicator used by technical analysis. It is possible to follow the trend of financial asset prices and generate support and resistance patterns. In addition, envelopes are a way of tracking volatility in order to identify opportunities to buy and sell these assets. It works on periods longer than the period visible on the chart. All values ​​are available in the form of buffers to simplify possible automations.
FREE
ADX consolidado
OTAVIO AGUIAR CAMPOS Aguiar
4.75 (4)
Mostra a média móvel quando ADX > 20 e pinta de verde ou vermelho quando os valores de ADX estão subindo indicando tendência. Quando o ADX é menor que 20 indica movimento lateral consolidado. O indicador não define pontos de entrada, somente mostra a média colorida quando a tendência está se fortalecendo. Faz parte do grupo de indicadores do Indicador Tavim.
FREE
A countdown timer for the  Volume bar chart generator  and  Tick chart generator  products, which are available for download from the MQL5 Market: Tick chart generator: https://www.mql5.com/en/market/product/29215 Volume bar chart generator: https://www.mql5.com/en/market/product/47197 The counter conveniently displays the number of ticks or transactions (depending on the chart) that need to pass for a new bar to start printing. The user can set the following indicator inputs. Volume type
FREE
VWAP and MVWAP
Flavio Javier Jarabeck
4.17 (6)
Volume Weighted Average Price (VWAP) is a trading benchmark commonly used by Big Players that gives the average price a Symbol has traded throughout the day. It is based on both Volume and price. Additionally we put in this indicator the MVWAP (Moving Volume Weighted Average Price). For those who do not know the usage and the importance od this indicator I recommend a great article about this subject at Investopedia ( https://www.investopedia.com/articles/trading/11/trading-with-vwap-mvwap.asp )
FREE
Dual RSI
Paul Conrad Carlson
Indicator alerts for Dual Relative strength index rsi. Large rsi preset at 14 is below 30 small rsi preset at 4 is below 10 for buy bullish signals . Large rsi preset are 14 is above 70 small rsi preset at 4 is above 90 for sell bearish signals . Includes mobile and terminal alerts. draws lines when alerts. This indicator can help identify extremes and then the tops or bottoms of those extremes .
FREE
Atr Size Alert
Flavia Freitas Claro Dos Santos Claro
5 (2)
Indicador baseado no ATR (Avarage True Range) que exibe o tamanho em pips ou pontos do ativo. O indicador ATR SIZE ALERT dispara um alerta caso o preço atinja o numero de pips pre definido pelo usuário: Input: Periodo (periodo do indicador ATR) Pips (tamanho do movimento esperado) Alert (alerta sonoro) Além do alerta sonoro, o indicador também possui alerta visual.
FREE
Суть системы заключается в идентификации момента формирования "разворотной" композитной свечи с заданными характеристиками (размер свечи в пунктах, структура теней). В анализе японских свечей аналогами подобных разворотных моделей являются "Молот" (Hammer) и "Повешенный" (Hanging Man), но в данной системе тело свечи не обязательно должно быть маленьким, а результирующая свеча строится из нескольких свечей. Входные параметры системы: Range - задает максимальное количество баров, которые будут уча
FREE
It makes it easier to see where there have been consolidation zones for previous prices and allows you to highlight the histogram where there is the biggest consolidation zone. Input parameters Intervalo de preço Is the price between the histograms Periodo Number of candle sticks to be analyzed Porcentagem Highlights the histogram where there is minimal consolidation in relation to the analyzed period
FREE
Midas VWAP
Paulo Henrique Faquineli Garcia
4 (1)
Volume Weighted Average Price (VWAP) is a trading benchmark commonly used by Big Players that gives the average price a Symbol has traded throughout the day. It is based on both Volume and price. This indicator contains Daily VWAP and MIDAS' VWAP, which means you are able to anchor the beggining of MIDAS' calculations and, therefore you will be able to use this methodology to study price versus volume moves after anchor point. You will be able to anchor up to 3 HIGH MIDAS VWAP's and 3 LOW. Wis
FREE
С этим продуктом покупают
Прежде всего стоит подчеркнуть, что эта торговая система является индикатором без перерисовки, без повторной отрисовки и без задержки, что делает ее идеальной как для ручной, так и для роботизированной торговли. «Smart Trend Trading System MT5» - это комплексное торговое решение, созданное для новичков и опытных трейдеров. Он объединяет более 10 премиальных индикаторов и предлагает более 7 надежных торговых стратегий, что делает его универсальным выбором для разнообразных рыночных условий. Стр
Прежде всего стоит подчеркнуть, что этот торговый индикатор не перерисовывается, не перерисовывает и не отставает, что делает его идеальным как для ручной, так и для роботизированной торговли. Атомный аналитик - это индикатор ценового действия PA, который использует силу и импульс цены, чтобы найти лучший край на рынке. Оборудованный расширенными фильтрами, которые помогают убирать шумы и ложные сигналы, и повышают торговый потенциал. Используя несколько слоев сложных индикаторов, Атомный анали
FX Volume MT5
Daniel Stein
4.94 (17)
Получайте ежедневную информацию о рынке с подробностями и скриншотами в нашем утреннем брифинге здесь, на mql5 , и в Telegram ! FX Volume - это ПЕРВЫЙ и ЕДИНСТВЕННЫЙ индикатор объема, который дает РЕАЛЬНОЕ представление о настроении рынка с точки зрения брокера. Он дает потрясающее представление о том, как институциональные участники рынка, такие как брокеры, позиционируют себя на рынке Forex, гораздо быстрее, чем отчеты COT. Видеть эту информацию прямо на своем графике - это настоящий геймчей
Представляем       Индикатор Quantum Trend Sniper   , инновационный индикатор MQL5, который меняет способ определения разворотов тренда и торговли ими! Разработан командой опытных трейдеров со стажем торговли более 13 лет,       Снайперский индикатор Quantum Trend       разработан, чтобы вывести ваше торговое путешествие на новые высоты благодаря инновационному способу определения разворотов тренда с чрезвычайно высокой точностью. ***Купите индикатор Quantum Trend Sniper и получите индикатор
Раскройте силу торговли трендами с помощью индикатора Trend Screener: вашего идеального решения для торговли трендами, основанного на нечеткой логике и мультивалютной системе! Повысьте уровень своей торговли по тренду с помощью Trend Screener, революционного индикатора тренда, основанного на нечеткой логике. Это мощный индикатор отслеживания тренда, который сочетает в себе более 13 инструментов и функций премиум-класса и 3 торговые стратегии, что делает его универсальным выбором для превращения
Gold Stuff mt5
Vasiliy Strukov
4.89 (166)
Gold Stuff mt5 - трендовый индикатор, разработанный специально для золота, также может использоваться на любых финансовых инструментах. Индикатор не перерисовывается и не запаздывает. Рекомендуемый тайм-фрейм H1.  Свяжитесь со мной сразу после покупки для получения   персонального бонуса! Настройки и мануал  здесь ПАРАМЕТРЫ Draw Arrow -   вкл.выкл. отрисовку стрелок на графике. Alerts -   вкл.выкл.звуковые оповещения. E-mail notification -   вкл.выкл. уведомления на почту. Puch-notification -
Прежде всего стоит подчеркнуть, что этот Торговый Инструмент является Неперерисовывающимся Нерепейнтинговым Индикатором, что делает его идеальным для профессиональной торговли. Индикатор Концепций Умного Действия Цены - очень мощный инструмент как для новичков, так и для опытных трейдеров. Он объединяет более 20 полезных индикаторов в одном, комбинируя передовые торговые идеи, такие как анализ Inner Circle Trader и стратегии торговли концепциями умных денег. Этот индикатор сосредотачивается н
Топовый индикатор МТ5, дающий сигналы для входа в сделки без перерисовки! Идеальные точки входа в сделки для  валют, крипты, металлов, акций, индексов !  Смотрите  видео  (6:22) с примером отработки всего одного сигнала, окупившего индикатор. Версия индикатора для MT4 Преимущества индикатора Сигналы на вход без перерисовки Если сигнал появился, он никуда НЕ исчезает! В отличие от индикаторов с перерисовкой, которые ведут к потере депозита, потому что могут показать сигнал, а потом убрать его.
Получайте ежедневную информацию о рынке с подробностями и скриншотами через наш утренний брифинг здесь, на mql5 , и в Telegram ! FX Power MT5 NG - это новое поколение нашего популярного измерителя силы валют FX Power. Что же предлагает этот измеритель силы нового поколения? Все, что вы любили в оригинальном FX Power ПЛЮС Анализ силы GOLD/XAU Еще более точные результаты расчетов Индивидуально настраиваемые периоды анализа Настраиваемый предел расчета для еще более высокой производительности Спец
Сейчас 147 долл. США (увеличиваясь до 499 долл. США после нескольких обновлений) - неограниченные учетные записи (ПК или Mac) Руководство пользователя + Обучающие видео + Доступ к приватному Discord-каналу + VIP-статус и мобильная версия + Лицензия на 5 ПК с неограниченным количеством аккаунтов и терминалов MT4. Сколько раз вы покупали индикатор торговли с замечательными обратными тестами, доказательствами производительности на живых счетах и зашикарными цифрами и статистикой, но после испо
Auto Order Block with break of structure based on ICT and Smart Money Concepts Futures Break of Structure ( BoS )             Order block ( OB )            Higher time frame Order block / Point of Interest ( POI )    shown on current chart           Fair value Gap ( FVG ) / Imbalance   ,  MTF      ( Multi Time Frame )    Volume Imbalance     ,  MTF          vIMB Gap’s Equal High / Low’s     ,  MTF             EQH / EQL Liquidity               Current Day High / Low           HOD /
Step into the realm of Forex trading with confidence and precision using XQ, a cutting-edge Forex indicator designed to elevate your trading game to unprecedented heights. Whether you're a seasoned trader or just stepping into the world of currency exchange, XQ Forex Indicator empowers you with the insights and signals needed to make informed trading decisions. The signal conditions are a combination of three indicators, and XQ Forex Indicator only display  medium and long-term trends . The ind
Индикатор Supply Demand использует предыдущее ценовое действие для выявления потенциального дисбаланса между покупателями и продавцами. Ключевым является определение зон с лучшими возможностями, а не просто вероятностей. Индикатор Blahtech Supply Demand обеспечивает функционал, не доступный ни в одной платформе. Этот индикатор 4 в 1 не только выделяет зоны с более высокой вероятностью на основе механизма оценки силы по множественным критериям, но также комбинирует его с мульти-таймфреймовым ана
Этот индикатор является уникальным, качественным и доступным инструментом для торговли, включающим в себя наши собственные разработки и новую формулу. В обновленной версии появилась возможность отображать зоны двух таймфреймов. Это означает, что вам будут доступны зоны не только на старшем ТФ, а сразу с двух таймфреймов - таймфрейма графика и старшего: отображение вложенных зон. Обновление обязательно понравится всем трейдерам, торгующим по зонам спроса и предложения. Важная информация Для мак
ICT, SMC, SMART MONEY CONCEPTS, SMART MONEY, Smart Money Concept, Support and Resistance, Trend Analysis, Price Action, Market Structure, Order Blocks, BOS/CHoCH,   Breaker Blocks ,  Momentum Shift,   Supply&Demand Zone/Order Blocks , Strong Imbalance,   HH/LL/HL/LH,    Fair Value Gap, FVG,  Premium  &   Discount   Zones, Fibonacci Retracement, OTE, Buy Side Liquidity, Sell Side Liquidity, BSL/SSL Taken, Equal Highs & Lows, MTF Dashboard, Multiple Time Frame, BigBar, HTF OB, HTF Market Structure
Индикатор Gann Squares представляет собой мощный инструмент для анализа рынка, основанный на математических концепциях, представленных W.D. Gann в его статье "Математическая формула для прогнозирования рынка." Этот индикатор включает в себя техники Ганна, связанные с квадратными числами, такими как 144, 90 и 52, а также Квадрат 9. Кроме того, он включает метод по использованию Квадрата 9 в сочетании с каналами и паттерном звезды. Руководство пользователя и использование: Перед использованием это
AW Trend Predictor MT5
AW Trading Software Limited
4.76 (54)
Сочетание тренда и пробоя уровней в одной системе. Продвинутый алгоритм индикатора фильтрует рыночный шум, определяет тренд, точки входа, а также возможные уровни выхода из позиции. Сигналы индикатора записываются в статистический модуль, который позволяет выбирать наиболее подходящие инструменты, показывая эффективность истории сигналов. Индикатор рассчитывает отметки ТейкПрофитов и стоплосса. Руководство пользователя ->  ЗДЕСЬ  / MT4 версия ->  ЗДЕСЬ Как торговать с индикатором: Торговля с Tr
Станьте Breaker Trader и получайте прибыль от изменений структуры рынка по мере изменения цены. Индикатор выключателя блока ордеров определяет, когда тренд или движение цены приближаются к истощению и готовы развернуться. Он предупреждает вас об изменениях в структуре рынка, которые обычно происходят, когда произойдет разворот или серьезный откат. Индикатор использует собственный расчет, который определяет прорывы и ценовой импульс. Каждый раз, когда новый максимум формируется около возможн
The Volume by Price Indicator for MetaTrader 5 features Volume Profile and Market Profile TPO (Time Price Opportunity). Get valuable insights out of currencies, equities and commodities data. Gain an edge trading financial markets. Volume and TPO histogram bar and line charts. Volume Footprint charts. TPO letter and block marker charts including split structures. Versatile segmentation and compositing methods. Static, dynamic and flexible ranges with relative and/or absolute visualizations. Lay
Представляем       Quantum Breakout PRO   , новаторский индикатор MQL5, который меняет ваш способ торговли в зонах прорыва! Разработан командой опытных трейдеров со стажем торговли более 13 лет,       Квантовый прорыв PRO       разработан, чтобы поднять ваше торговое путешествие к новым высотам с его инновационной и динамичной стратегией зоны прорыва. Quantum Breakout Indicator покажет вам сигнальные стрелки на зонах прорыва с 5 целевыми зонами прибыли и предложением стоп-лосса на основе по
TrendLine PRO MT5
Evgenii Aksenov
4.78 (49)
Индикатор   Trend Line PRO   является самостоятельной торговой стратегией. Он показывает смену тренда, точку входа в сделку, а так же автоматически рассчитывает три уровня Take Profit и защиту от потери Stop Loss Trend Line PRO   идеально подходит для всех символов Meta Trader:  валют, металлов, криптовалют, акций и индексов   Преимущества Trend Line PRO: Никогда не перерисовывает свои сигналы Возможность использования  как самостоятельную стратегию Имеет три автоматических уровня Take Profi
Версия MT4   |   FAQ Индикатор Owl Smart Levels – это полноценная торговая система внутри одного индикатора, которая включает в себя такие популярные инструменты анализа рынка как усовершенствованные фракталы Билла Вильямса , Valable ZigZag, который строит правильную волновую структуру рынка, а также  уровни Фибоначчи, которые   отмечают точные уровни входа в рынок и места взятия прибыли. Подробное описание стратегии Инструкция по работе с индикатором Советник-помошник в торговле Owl Helper При
Gartley Hunter Multi - Индикатор для поиска гармонических моделей одовременно на десятках торговых инструментов и на всех классических ценовых диапазонах: (m1, m5, m15, m30, H1, H4, D1, Wk, Mn). Инструкция/Мануал ( Обязательно читайте перед приобретением ) | Версия для МТ4 Преимущества 1. Паттерны: Гартли, Бабочка, Акула, Краб. Летучая мышь, Альтернативная летучая мышь, Глубокий краб, Cypher 2. Одновременный поиск паттернов на десятках торговых инструментов и на всех классических таймфреймах
Индикатор Trend Line Map является дополнением к индикатору Trend Screener Indicator. Он работает как сканер всех сигналов, генерируемых скринером тренда (сигналы линии тренда). Это сканер линий тренда на основе индикатора Trend Screener. Если у вас нет индикатора Trend Screener Pro, программа Trend Line Map Pro работать не будет. It's a Trend Line Scanner based on Trend Screener Indicator. If you don't have Trend Screener Pro Indicator,     the Trend Line Map Pro will not work . Зайдя в н
TrendDecoder Premium MT5
Christophe, Pa Trouillas
5 (1)
Определите диапазоны и следующие вероятные движения  | Получите самые ранние сигналы и силу трендов    |  Получите четкие выходы перед разворотом  |  Определите уровни Фибо, которые будет тестировать цена   |  Индикатор без перерисовки и задержек - идеально подходит для ручной и автоматической торговли - подходит для всех активов и всех временных единиц $ 69   на старте - затем снова   $149 После покупки   пожалуйста, свяжитесь с моим каналом  для получения рекомендуемых настроек Версия МТ4 :  
MetaBands M5
Vahidreza Heidar Gholami
4.67 (3)
MetaBands использует мощные и уникальные алгоритмы для построения каналов и обнаружения тенденций, чтобы предоставлять трейдерам потенциальные точки для входа и выхода из сделок. Это индикатор канала плюс мощный индикатор тенденций. Он включает различные типы каналов, которые могут быть объединены для создания новых каналов, просто используя параметры ввода. MetaBands использует все типы оповещений, чтобы уведомлять пользователей о событиях на рынке. Особенности Поддерживает большинство алгоритм
TPSpro TRENDPRO   —  трендовый индикатор, который автоматически анализирует рынок и предоставляет информацию о тренде и каждой его смене а также дающий сигналы для входа в сделки без перерисовки! Индикатор использует каждую свечу, анализируя их отдельно. относя к разным импульсам – импульс вверх или вниз. Точные точки входа в сделки  для  валют, крипты, металлов, акций, индексов! -  Version MT4                ПОЛНОЕ ОПИСАНИЕ          /        СЕТАПЫ ДЛЯ ТОРГОВЛИ                        Рекоменд
Профиль Рынка (Market Profile) определяет ряд типов дней, которые помогают трейдеру распознать поведение рынка. Ключевая особенность - это область значений (Value Area), представляющая диапазон ценового действия, в котором произошло 70% торговли. Понимание области значений может помочь трейдерам вникнуть в направление рынка и установить торговлю с более высокими шансами на успех. Это отличное дополнение к любой системе, которую вы возможно используете. Blahtech Limited представляет сообществу Me
Автоматическое построение уровней поддержки и сопротивления ПЛЮС разрывы между свечами на вашем графике, чтобы вы могли видеть, куда цена, скорее всего, направится дальше и/или потенциально может развернуться. Этот индикатор разработан для использования в рамках методики позиционной торговли, которая преподается на моем сайте (The Market Structure Trader), и отображает ключевую информацию для таргетинга и потенциальных входов. MT4 Version:  https://www.mql5.com/en/market/product/97246/ В инди
Golden Spikes Detector This indicator is based on an advanced strategy primarily for trading spikes on Boom and Crash Indices. Complex algorithms were implemented to detect high probability entries only. It alerts on potential Buy and Sell entries. To trade spikes on the Deriv or Binary broker, only take Buy Boom and Sell Cash alerts. It was optimised to be loaded on 5-minute timeframe although multiple timeframe analysis is done in the background. Features ·             Desktop pop up and sound
Другие продукты этого автора
Analisa Segundo
Marcio Sales Santana
4 (1)
Analisador de Segundos, exibição de sinais e formação de padrões. Alteração a precisão do tempo em: Ferramentas --> Opções --> Aba Graficos --> item: Escola de Tempo Precisa. / --> indica uma compra \ --> indica uma venda "-" --> indica um movimento de indecisão. ^ --> indica um esforço dos compradores para manter e ou reverter a direção do mercado. _ -->  indica um esforço dos vendedores para manter e ou reverter a direção do mercado. As linhas de compra e venda tenta indicar o real spread do
FREE
Time Spread
Marcio Sales Santana
Indicador gerado a partir do tempo e da força da compra e da venda. Quanto maior o número do parâmetro spread menos entradas será padrões pode-se ver, use para menos trades, ideal para não tomar muitos stops. Quanto menor o número do parâmetro spread mais entradas com padrões, use para fazer scalp, operações curtas, maior probabilidade de stops. Observe o gráfico pelos menos uma semana antes de iniciar as operações. Quando começar faça somente uma operação por dia durante uma semana. vá aume
FREE
grafico de media os dados são exibidos pela media aritimetica dos negocios realizados, evitando as distorções dos outros graficos. A forma de operação e pela busca de padrões. o parametro e para reduzir as distorções, diminuindo as interferências, quanto menor for o valor mais alinhado o grafico fica. ativos mais lentos são o ideal, atualmente estou usando no dollar canadense.
FREE
Conjunto
Marcio Sales Santana
Indicador usa a teoria dos conjuntos marca os pontos importantes onde é possível o preço ir. Enquanto o indicador está ativo os dados ficam gravados na pasta files do MT5, sendo possível usar o replay quando o mercado estiver fechado, sendo necessário informar o nome do arquivo e setar a useReplay como true, depois e só ir clicando em próximo para ir carregando conjunto por conjunto. Quando o mercado estiver aberto deixe a opção useReplay como false e useTime como true. Gráfico atemporal de conj
FREE
Фильтр:
Нет отзывов
Ответ на отзыв
Версия 1.2 2024.01.12
Analise de dados de 6 segundos.