• Обзор
  • Отзывы (1)
  • Обсуждение

Ershov 38 parrots MT5

5

Индикатор предназначен для того, чтобы вовремя закрывать позиции по рынку.
Например: досрочно фиксировать прибыль, если цена не достигла TakeProfit, а рынок разворачивается.
Индикатор анализирует импульс, а не тренд. О тренде никакой информации он не дает.
Индикатор хорошо подходит для поиска дивергенции.
Индикатор Ershov 38 Parrots динамически подстраивается под рынок и выявляет импульсы движения цены средней и высокой амплитуды. На мелкие скачки цены почти не реагирует. 
Принципиальное отличие от классических осцилляторов - динамические уровни перекупленности и перепроданности, которые считаются независимо друг от друга.
Индикатор может предупредить о следующих событиях:
- входить в рынок уже поздно,
- если имеешь открытую сделку, то нужно еще удерживать ее какое-то время,
- если имеешь открытую сделку, то стоит ее закрыть прямо сейчас,
- если хочешь открыть сделку, то индикатор может запретить вход в сделку из-за высокого риска разворота.

Правила использования:
1) Не важно какой торговой системой вы пользуетесь. Если вы торгуете по тренду, то удобно входить в рынок когда линия 38 Parrots оказывается между DW и UP.
2) Если  38 Parrots > UP, то лучше удерживать покупки, если они уже сделаны. Скорее всего, рост скоро прекратится(в рамках одного импульса).
    Если  38 Parrots <  DW, то лучше удерживать продажи, если они уже сделаны. Скорее всего, падение скоро прекратится(в рамках одного импульса) .

3) Если  38 Parrots > UP, то лучше не совершать новые покупки. Скорее всего, рост скоро прекратится(в рамках одного импульса).
    Если  38 Parrots <  DW, то лучше не совершать новые продажи. Скорее всего, падение скоро прекратится(в рамках одного импульса) .

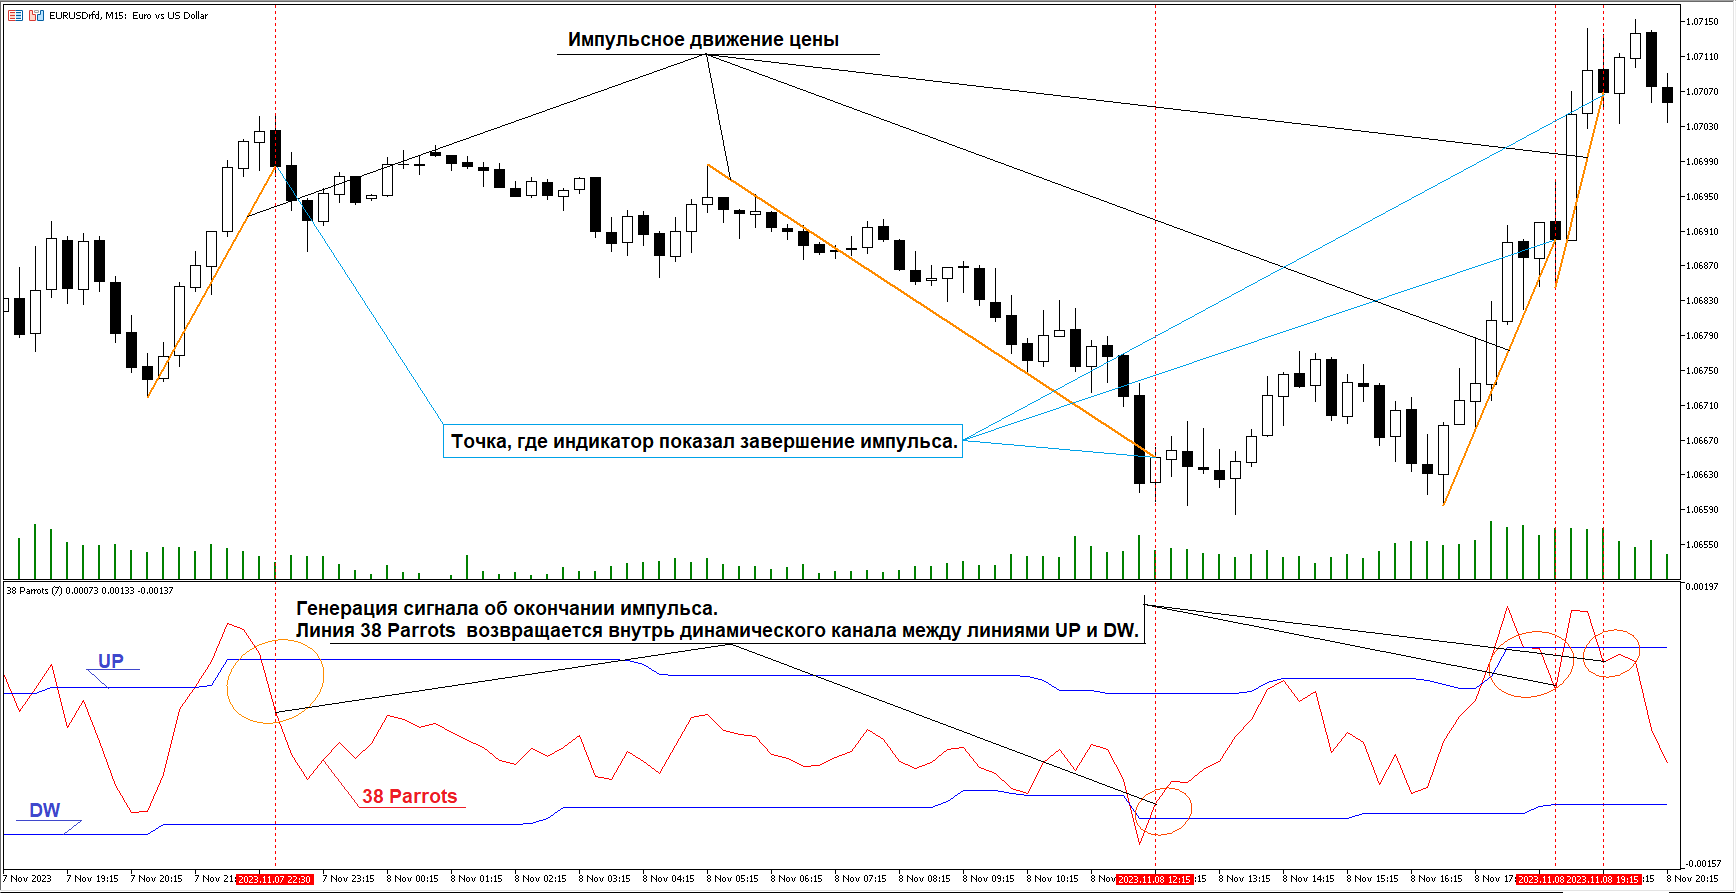
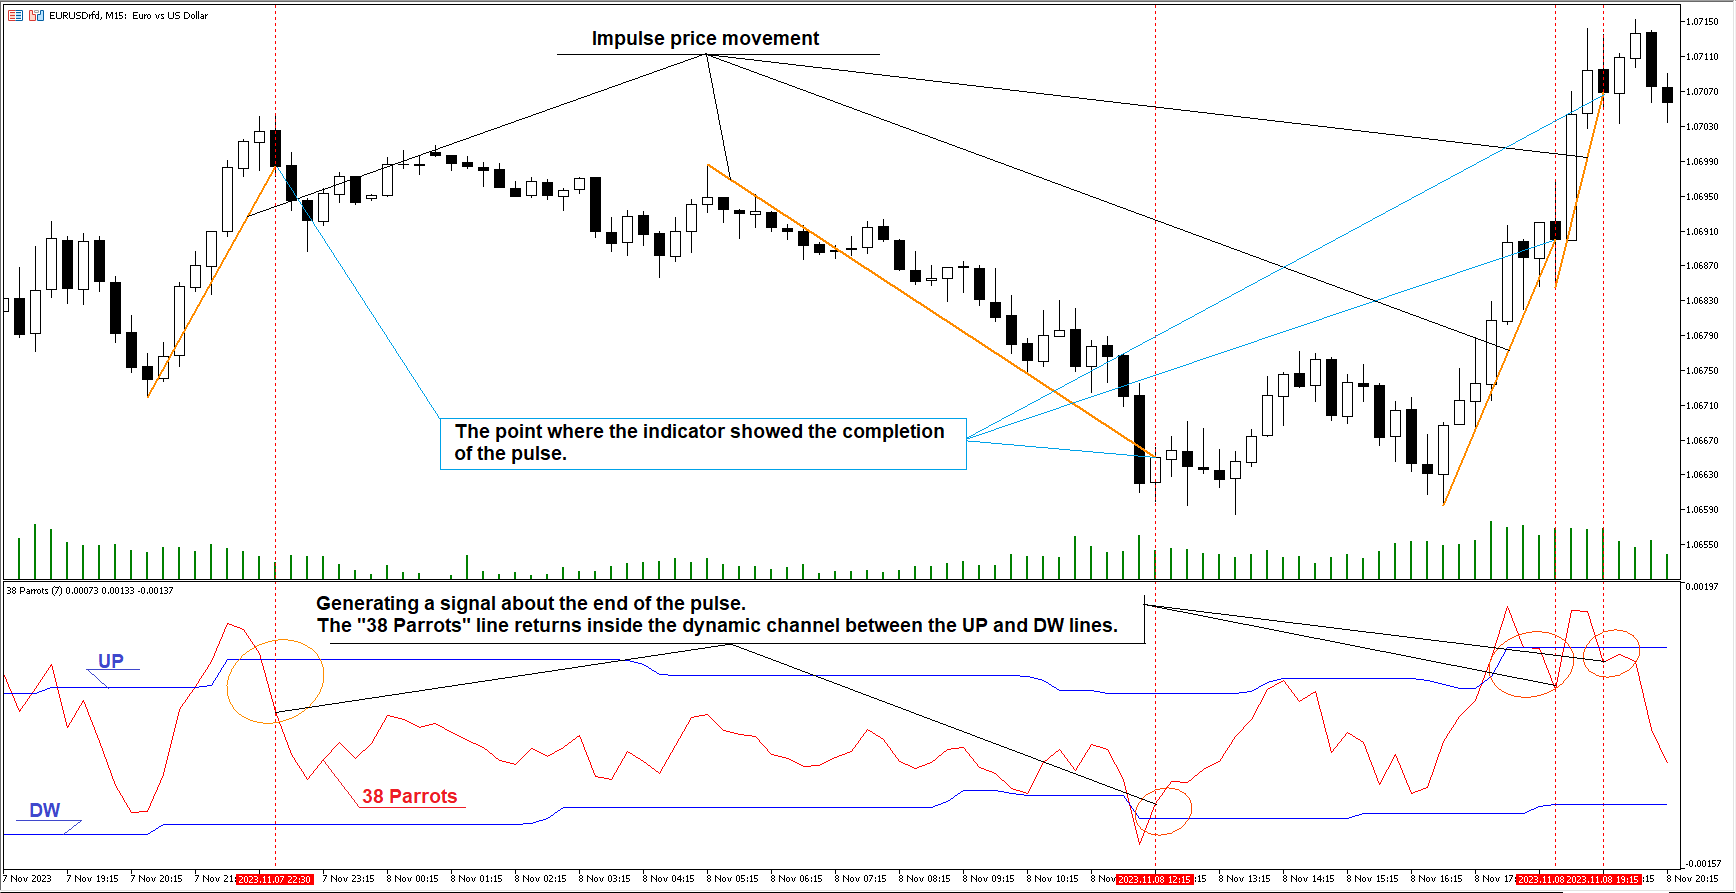
4) Если были открыты покупки. Спустя время вы увидели 38 Parrots > UP ,  это признак того, что скоро нужно будет закрыть позицию. При возврате линии  38 Parrots в промежуток между  DW и UP лучше закрыть покупки. Импульс, скорее всего, завершен.
     Если были открыты продажи. Спустя время вы увидели 38 Parrots < DW ,  это признак того, что скоро нужно будет закрыть позицию. При возврате линии  38 Parrots в промежуток между  DW и UP лучше закрыть продажи. Импульс, скорее всего, завершен.
Все вышесказанное наглядно показано на скриншоте.
Индикатор очень эффективен для того, чтобы вовремя выйти из открытых позиций. Имеет высокую вероятность отработки. Но, как и все индикаторы, не может дать стопроцентной гарантии.


Отзывы 1
Varreck
29
Varreck 2023.11.29 15:25 
 

Отличный индикатор, отрабатывает очень точно, рекомендую!!!

Рекомендуем также
ИНДИКАТОР, основанный на ИСКУССТВЕННОМ ИНТЕЛЛЕКТЕ, который генерирует возможные записи колл- и пут-опционов для бинарных опционов. Индикатор работает по 3 разным стратегиям: 1) считывая объемы, он посылает сигнал, когда цена должна развернуться 2) через расхождение между ценой и объемом он посылает сигнал, когда тренд должен продолжиться или развернуться. 3) благодаря сближению цены и объема он посылает сигнал о том, что тренд должен продолжиться. Индикатор работает на всех таймфр
Monk MT5
Nestor Alejandro Chiariello
Стратегия монаха, прочная и очень стабильная долгосрочная стратегия. моя стратегия имеет модели входа для безопасных и долгосрочных периодов, она постоянно консультируется с новостями и событиями, которые происходят во время живого рынка, имеет максимальную защиту от рисков, а также долгосрочное восстановление сетки, имеет различные интеллектуальные внутренние методы. , где его можно настроить в одной настройке графика, чтобы можно было установить удобную адаптивную конфигурацию для ИИ в 1 клик
ЭТОТ ИНДИКАТОР, ОСНОВАННЫЙ НА ИСКУССТВЕННОМ ИНТЕЛЛЕКТЕ, определяет возможные точки разворота рынка, считывая следы, и ЗАРАНЕЕ сигнализирует о небольших движениях рынка до того, как они произойдут. В отличие от индикаторов цены и объема, которые генерируют «поздние» входы, т. е. когда подтверждение цены или объема уже произошло при изменении направления и, следовательно, часто движение уже закончилось, этот индикатор сигнализирует, основываясь на том, что он читает в след, «КОГДА ДВИЖЕНИЕ ДОЛЖНО
Volume Profile Pro
Makarii Gubaydullin
5 (1)
Visualization of the trade deals, distributed by price levels. You can set any period for calculation: between 2 vertical lines, or set a fixed time interval. The histogram levels are relative: a wider bar means more trading volume. Distribution extremes can be used as a support and resistance levels. All styles, sizes and colors are customizable. My  #1 Utility : includes 65+ functions  |   Contact me  if you have any questions  |  MT4 version In the settings of the indicator, you can config
Limitless MT5  - это универсальный индикатор который подойдет каждому как начинающему так и опытному трейдеру работает на всех валютных парах криптовалютах сыре акциях Limitless MT5 - уже настроен и не требует дополнительной настройки   А теперь главное Почему  Limitless MT5 ? 1 полное отсутствие перерисовки  2 два года тестирования лучшими специалистами в трейдинге 3 точность правильных сигналов превышает 80% 4 хорошо показал себя в торговле во время выхода новостей Правила торговли  1 сигнал н
Our indicator will help you to make a decision whether to Buy or Sell , including where to set the Take Profit and Stop Loss . The Buy/Sell signal will not redraw nor repaint until new signal occurs. The Take Profit and Stop Loss will change following the market conditions. Our indicator will give alert to your mobile/handphone when new buy/sell signal arrive. For best result, combine this indicator with your knowledge on price action and support & resistance, also don't forget to watch for the
Данный индикатор создан для тех людей, которые хотят торговать и зарабатывать на любых инструментах и таймфреймах .Индикатор выдает очень хорошие точки,для входа в рынок,торговать очень просто,стрелки покажут,когда надо открывать сделки,установил и торгуй не о чем не думая,стоп-лосс и тейк-профит,устанавливайте каждый сам,все зависит от вашего стиля торговли,кто то скальпирует а кто то держит сделки по несколько дней.
- This is an implementation of OCC ==> open close cross - This indicator applies twelve different averaging methods to open and close prices separately to signal the trend switching. - All MA methods are set as input as well as period and different offsets applied to linear regression and ALMA averaging. - Buffers 16 and 17 can be used in EAs to detect trend direction. - You can message in private chat for further changes you need.
XFlow показывает расширяющийся ценовой канал помогающий определять тренд и моменты его разворота. Используется также при сопровождении сделок для установки тейк-профит/стоп-лосс и усреднений. Практически не имеет параметров и очень прост в использовании - просто укажите важный для вас момент истории и индикатор рассчитает ценовой канал. ОТОБРАЖАЕМЫЕ ЛИНИИ ROTATE - толстая сплошная линия. Центр общего вращения цены. Цена делает широкие циклические движения вокруг линии ROTATE. Положение цены око
Tomamos 5 medios móviles las unimos en una la cual suavizamos y volvemos a suavizar, resultando un mega suavizador de medios móviles suavizadas. Indicador de mql5 funciona en cualquier broker y para todos los tiempos, siendo el mas optimo el de 5, 15 a mas. Funciona mejor en grupo consigo misma osea poner uno de 14 y otro de 50 y 400,, así se observa mejor su desempeño.
Entry and exit signals from the Double 7's Strategy by Larry Connors in his book "Short Term Trading Strategies That Work". Larry claims this strategy predicted the market's direction over 80% of the time since 1995. Picking up the gains and being exposed in the market less than 25% of the time. Good for swing trading on Daily charts of SPY, Nasdaq, China's FXI, Brazil's EWZ and the majority of the equity ETFs and World Indices. How does it work? The indicator activates the buy signal when
Introduction to Fractal Pattern Scanner Fractal Indicator refers to the technical indicator that makes use of the fractal geometry found in the financial market. Fractal Pattern Scanner is the advanced Fractal Indicator that brings the latest trading technology after the extensive research and development work in the fractal geometry in the financial market. The most important feature in Fractal Pattern Scanner is the ability to measure the turning point probability as well as the trend probabil
Directional Volatility and Volume Oscillator for MetaTrader 5 - Master Market Dynamics Discover the power of precision trading with the "Directional Volatility and Volume Oscillator" meticulously designed for MetaTrader 5. This advanced tool combines the insights of directional analysis, volatility measurement, and volume tracking to provide you with unparalleled market understanding. Basic Details : Indicator Type : Directional Volatility and Volume Oscillator for MetaTrader 5 Key Metrics : Rea
KT Candlestick Patterns Scanner is a Multi-Symbol and Multi-Timeframe scanner that fetches and shows various candlestick patterns on 28 currency pairs and 9 time-frames concurrently . The scanner finds the candlestick patterns by loading the KT Candlestick Patterns indicator as a resource in the background. Features The scanner can find the candlestick patterns on 252* combinations of symbols and time-frames from a single chart. Open the signal's chart loaded with a predefined template with
Несмотря на всю видимую простоту индикатора, внутри у него сложные аналитические алгоритмы, при помощи которых система определяет моменты входов. Индикатор дает точные и своевременные сигналы на вход и на выход из сделки, которые появляются на текущей свече.  Основная цель данного индикатора это определение моментов входов и выходов из сделок, поэтому индикатор Trend Revers отображат только линию тренда и точки входа, тоесть отображает показывают места входа в рынок. Пользоваться индикаторо
PROMOTIONAL OFFER - RENT FOR 3 MONTHS $160.00 ( Promotional period ends 30th June 2024) *Chart Clarity Dashboard will be available for rent for 6 months and 12 months thereafter "If you know the Way broadly you will see it in everything" Miyamoto Musashi Precision Trading: Introducing Our MT5 Indicators for Optimal Market Insights We have set a premium price for our MT5 indicators, reflecting over two years of development, rigorous backtesting, and diligent bug fixing to ensure optimal function
Multiple Timeframe MACD indicator. This indicator was built for making multiple timeframe analysis possible in MT5 using MACD Indicator. MACD Indicator traditionally shows two lines and one histogram. MACD Line(Yellow) is calculated by subtracting 12period EMA(fast) from 26period EMA (slow). Signal Line(Blue) is created by a 9period EMA from MACD Line. Histogram is just the difference between MACD and Signal lines. Histogram is colored based on the difference between its value and the previous h
This is Gekko's Bollinger Bands indicator. It extends the use of the famous Bollinger Bands and calculates strong entry and exit signals using price action on the edge and on the middle bands. You can set it up in many different ways, eg: pullback, pullback against trend, middle band crossing and middle band crossing against trend. Inputs Number of Bars to Plot Indicator:  number of historical bars to plot the indicator, keep it low for better performance; Produces Signal Only When a Bar Closes:
Индикатор отслеживает тренд в 5 разных временах графика для одного и того же актива, основываясь на 6 сигналах для каждого времени графика. Основная цель индикатора - показать нам тенденцию большинства финансового актива, в котором он был размещен. Система передает информацию о тенденциях в несколько графических периодов, таким образом, пользователь может иметь широкое представление о движении актива, этот тип инструмента дает пользователю более высокую частоту обращений, помогая оператору в
ROC acceleration-deceleration is the manual system for medium-term scalping. Indicator based on custom ROC system which defines bullish/bearish market and especially  acceleration-deceleration of tendention in the market's main direction. Buy arrow is plotted during bearish market when current trend decelerates and sell  arrow is plotted during bullish market when current trend decelerates. Main Indicator's Features Signals are not repaint,non-late or disappear(exept cases when system recalculat
My PVSR
Ashok Kumar Singha
My PVSR   is based on All Type of Pivot Points. Use this Indicator to get proper Support / Resistance Zone and Trade accordingly.. Recommendation: Use this Indicator along with my another Indicator --->>> Dr. Trend   <<<--- Click Here ; To get the best output result feel free to contact me ; Best of Luck It can be used for: All Pairs: Forex, Cryptocurrencies, Metals, Stocks, Indices etc. All Timeframe All Brokers All type of Trading Style like Scalping, Swing, Intraday, Short-Term, Lon
Expert Amazo
Guilherme Geovanini Fraga
EXPERT AMAZO é um Expert Advisor projetado especificamente para negociar WIN (mini índice) e WDO (mini dólar). A operação é baseada na abertura de ordens utilizando alguns indicadores como Sars parabólicos, médias móveis, Bandas de Bollinger, Fibonacci, etc., trabalhando de acordo com 3 modalidades de estratégia, o AMAZO procura prever os movimentos do mercado com operações contra ea favor da tendência.        Entre em nosso Grupo de WhatsApp para receber as melhores configurações do Expert.
The TrendLinePro indicator for MetaTrader 5 creates a trend line based on the last candle highs and lows. The number of candles to be used to determine the direction can be selected yourself. The trend line can also be used to set an SL. Changes in trend directions can optionally be displayed with an arrow. Input Parameters: Number of Candles for Distance: 3 Display Direction Changes Arrows: false
С помощью алгоритма форекс индикатора Elephant, вы можете достаточно быстро понять, какая именно тенденция в данный момент развивается на рынке. Индикатор указывает на графике основную тенденцию в текущий момент на рынке. Смена направления, с точки зрения рыночного фундамента, означает смещение торгового интереса в сторону продавцов или покупателей. Если не учитывать спекулятивные броски, которые в результате не сказываются на общем тренде, то моменту реального «перелома» всегда предшествует
Please,put CycleDivergence in the same folder of TimingCycleWithLLV otherwise it does not run. As for the cycle discussion, I invite you to read the TimingCycleWithLLV indicator presentation ...please ask me if something is not clear. I think tha time is much more important than price;this is the reason for wich I trade only when one cycle finishes and the new one start. In order to use the CycleDivergence indicator follow these steps: 1) for example (see imagine number four) 1 minute chart,in t
Программное обеспечение для количественного анализа, этот индикатор прибыл из другой страны, и сегодня благодаря моей сети я могу поделиться этим программным обеспечением с вами! Russian Tool рисует стрелки на вашем активе, указывая тренд, в который войдет актив, простой в использовании и простой в установке индикатор. Работаем с роботами и индикаторами с 2018 года! Мы пришли к MQL5, чтобы иметь возможность приносить больше пользы при оплате нашими клиентами!, наш Instagram, где мы ежедне
The Rainbow Multiple Moving Average (MMA) is a technical analysis tool used to identify trends and potential reversal points in financial markets. It is based on a system of moving averages that are designed to be used together, with each moving average having a different time frame. The Rainbow MMA consists of multiple exponential moving averages (EMAs) of different lengths, with each EMA plotted in a different color. Typically, the Rainbow MMA includes EMAs of 2, 3, 4, 5, 6, 7, 8, 9, 10, 11, a
ToolBox 360 is the swiss knife of all indicators. It is full packed with useful tools to help you with your trading. It can be used to find best entry and exit points and help you to decide if you should open a trade or not. It shows market trends, candlestick formations outside / inside bars and you can sett time based allerts. Main features: Time based Fibonacci lines Choose a start and end time and the indicator shows you Fibonacci lines within the selected time range including range high
Channel Universal   умеет правильно строить форекс канал и формирует классическую стратегию торговли, прост в исполнении, поэтому доступен даже новичкам. Ценовые каналы одинаково хорошо работают на любых торговых активах и таймфреймах, могут использоваться как самостоятельно, так и с дополнительным подтверждением от осцилляторов и рыночных объемов.  Если взглянуть на цену и попытаться выявить самые простые визуальные закономерности вы тут же увидите, что цена практически никогда не движется п
This is a simple arrow system based on Engulfing Candlestick Pattern. It gives you alerts on your smartphone when there is an engulfing candlestick pattern happens. Which type of alerts available? 1. It paints on chart Up/Down Arrows. 2. Popup message and sound alert in trading terminal window. 3. Push notification or Alert on your Android and IOS mobile phones (requires MT4 or MT5 app installed!) *Note: Use it on higher timeframes like H4 (4 hours), D1 (1 Day) then find trade opportunities on s
С этим продуктом покупают
note: this indicator is for METATRADER4, if you want the version for METATRADER5 this is the link:  https://www.mql5.com/it/market/product/108106 TRENDMAESTRO recognizes a new TREND in the bud, he never makes mistakes. The certainty of identifying a new TREND is priceless. DESCRIPTION TRENDMAESTRO identifies a new TREND in the bud, this indicator examines the volatility, volumes and momentum to identify the moment in which there is an explosion of one or more of these data and therefore the mome
VTrende Pro
Andrii Diachenko
5 (1)
VTrende Pro - МТФ индикатор для трендовой торговли с панелью индикации для МТ5 !!! - Подробное описание на русском языке под видео (на Youtube) - !!! Хотя сигналы индикатора VTrende Pro можно использовать, как сигналы полноценной торговой системы, рекомендуется применять их в связке с ТС Билла Вильямса. VTrende Pro - это расширенная версия индикатора VTrende . Отличие Pro версии от VTrende: - Временные зоны - Сигнал V - сигнал 1-2 волн Основная задача индикатора - определить точки изм
IVISTscalp5
Vadym Zhukovskyi
5 (3)
Представляем вам индикатор iVISTscalp 5 , который не только уникален, но и эффективен в использовании при анализе торговых операциях. Этот индикатор основывается на временных данных и является результатом многолетнего опыта и глубокого анализа финансовых рынков. Индикатор iVISTscalp 5 отличный помощник для ручной торговли. Удобство, простота и визуализация. Все самое сложное спрятано внутри. Мы максимум упростили настройки и использование индикатора iVISTscalp 5 . Индикатор подходит для всех
Tatino Super Signals is Non Repaint Indicator for Binary Option trading and Forex trading. Recommendations: Timeframe: All timeframes. For best results we recommend using it on M1, M5 and M15 timeframes. Currency pairs: All Pairs Account type: All Type Broker time: Any Brokers : Alls Binary Trading : Expired 1 Candle Buffer Buy=1, Sell=0, Entry Next Candle Recommended Forex trading stop loss : 15 pips Recommended  Forex tradingTake profit levels : 15 pips Specifications: Does not repaint  
Технический индикатор Smooth Price (Гладкая цена) используется для построения гладкой линии максимально приближенной к цене торгового инструмента и служит для устранения ее шумовых составляющих. Индикатор является частью торговой системы Monarch, но здесь он представлен как самостоятельный инструмент технического анализа. Основой индикатора служит кластерный цифровой фильтр , который, в отличии от проекта ClusterSMA , применяется непосредственно к ценовой таймсерии. Smooth Price не перерисовывае
Recommended TimeFrame >= H1. 100% Non Repainted at any moment.  Use it carefully, only with Trend Direction. Trading Usage: 2 Variants: as Range System or as BreakOut System (Both Only With Trend Direction)::: (Always use StopLoss for minimise Risk); [1] as Range System: (Recommended) in UP TREND:  - BUY in Blue Line , then if price goes down by 50 points (on H1) open Second BUY.   Close in any Profit you wish: TrailingStop(45 points) or Close when Price touches upper Gold Line. in DOWN TR
Super Suavizador
Cesar Juan Flores Navarro
Indicador en MQL5 que obtiene el promedio de 10 EMAS que son alineadas y procesadas según Fibonacci luego el promedio es suavizado"  Se ingresa un número de 2 a N que multiplica los EMA-Fibonacci y por consiguiente aumenta los fibonacci, resultando un promedio.   Se ingresa un número que suaviza los EMA-Fibonacci. Considerando los números 1/1 seria la suavización minima. Considerando los números 3/5 seria la suavización media. Considerando los números 10/30 seria la suavización alta.....etc
Entry Pro
Bartlomiej Tadeusz Tomaja
Entry Pro Indicator is a powerful multi-functional trading tool designed to increase your market entry accuracy. It combines the power of several key market trend indicators, including ATR Trailing Stop and both fast and slow EMA, to provide comprehensive market insight. It offers easy-to-interpret market entry signals represented by colored arrows. Also, it's fully customizable, allowing you to adjust ATR and EMA periods to suit your trading strategy. Trend filters and alerts can be toggled on
WanaScalper
Isaac Wanasolo
1 (1)
A scalping indicator based on mathematical patterns, which on average gives signals with relatively small SL, and also occasionally helps to catch big moves in the markets (more information in the video) This indicator has three main types of notifications: The first type warns of a possible/upcoming signal on the next bar The second type indicates the presence of a ready signal to enter the market/open a position The third type is for SL and TP levels - you will be notified every time price r
Классификатор силы тренда. Показания на истории не меняет. Изменяется классификация только незакрытого бара. По идее подобен полной системе ASCTrend, сигнальный модуль которой, точнее его аппроксимация в несколько "урезанном" виде, есть в свободном доступе, а также в терминале как сигнальный индикатор SilverTrend . Точной копией системы ASCTrend не является. Работает на всех инструментах и всех временных диапазонах. Индикатор использует несколько некоррелируемых между собой алгоритмов для класси
Premium level - это уникальный индикатор с точностью правильных прогнозов  более 80%!  Данный индикатор тестировался более двух месяцев лучшими Специалистами в области Трейдинга!  Индикатор авторский такого вы больше не где не найдете!  По скриншотах можете сами увидеть точностью данного инструмента!  1 отлично подходит для торговли бинарными опционами со временем экспирации на 1 свечу. 2 работает на всех валютных парах, акциях, сырье, криптовалютах Инструкция: Как только появляется красная стре
Indicador en base a la pendiente de la linea de precio, dibuja una línea de color cuando sube a base de los precios que previamente has sido procesados o linealizados, y cuando baja la pendiente la linea linealizada toma otro color. En este caso se a considerado 6 lineas de diferentes procesos desde pendientes largas hacia las cortas, observándose que cuando coincidan las pendientes se produce un máximo o mínimo, lo que a simple vista nos permitirá hacer una COMPRA O VENTA.
Fibonacci Múltiple 12, utiliza la serie fibonacci plasmado en el indicador fibonacci, aumentadolo 12 veces según su secuencia. El indicador fibonacci normalmente muestra una vez, el presente indicador se mostrara 12 veces empezando el numero que le indique siguiendo la secuencia. Se puede utilizar para ver la tendencia en periodos cortos y largos, de minutos a meses, solo aumentado el numero MULTIPLICA.
En base a cálculos matemáticos de determino una linea Horizontal que cruza a todas las señales de trading, mostrando los máximos y mínimos. La linea horizontal parte en dos las subidas y bajadas de las señales de trading, de tan manera que es fácil identificar los máximos y mínimos, y es inteligente por que es sensible a las subidas y bajadas, afín de no quedarse en un solo lado por siempre, trabaja excelentemente con otros indicadores suavizadores ya que les garantiza que en un intervalo de tie
этот индикатор является индикатором детектора спайков, он специально разработан для обмена на Boom 1000, Boom 500, Crash 1000 и Crash 500 Мы рекомендуем использовать его только для индексов Deriv Boom и Crash. Его настройки интуитивно понятны, знакомы, просты в использовании имеет функции уведомления; звуковые уведомления и push-уведомления. этот инструмент прост в использовании, прост в обращении Это обновление основано на разных стратегиях для шипов.
Indicador en MQL5, recibe la información del precio SUAVIZADO, lo procesa anulando los picos inteligentemente, y el resultado lo envía al desarrollo de la escalera que iniciara y subirá o bajara según el peldaño o INTERVALO ingresado Ingreso PERIODO = 50 (variar segun uso) Ingreso MULTIPLICA AL PERIODO = 1 (variar segun uso) Segun la configuración la escalera puede pegarse o separarse de los precios,, Se aplica toda la linea de tiempo, y a todas las divisas, etc.  
Indicador en MQL5, que obtiene el promedio de 10 EMAS, que son alineadas según Fibonacci, obteniendo un promedio, que sera suavizado.  Se puede ingresar un numero desde 2 a N, que multiplica a los EMA-Fibonacci. Funciona en cualquier criptomoneda, etc. etc... pudiendo calcular el futuro segun la tendencia de las EMAS. Funciona excelentemente en tramos largos, determinando exactamente el mejor inicio/salida. El precio inicial por apertura sera por un periodo de tiempo, luego aumentará.
Micro  ******************* Секундные графики MT5 ********************** Более точного инструмента для входа в сделку вы не найдёте. Входные параметры: Timeframe, sek - период построения графика, секунды Displayed bars - отображаемые бары Step of price levels, pp, 0-off - шаг отрисовки ценовых уровней, пункты Scale points per bar, 0-off - масштаб в пунктах на бар Show lines - отображение текущих уровней Show comment - отображение комментария Standard color scheme - стандартная цветовая сх
QuantXSTocks Trading Range Indicator for MT5: INSTRUCTIONS TO USE OUR INDICATOR:- User needs to take trade on Arrow or after an Arrow CandleStick, You can achieve up-to 35-125 pips target by this Indicator. Best Timeframes for Stocks and Indices are M30 and H1: AMAZON M30 (50 pips) TESLA M30 (50 pips) APPLE M30 (50 pips) ADOBE M30 (50 pips) NASDAQ100 H1 (125 pips) The above are the approximate amount of pips you can achieve by this Indicator, Green arrow appears to be buy arrow while the Red a
Trend and Signals MT5  indicator scans  30 trading Instruments (Forex, Metals and Indices).     It uses special algorithm on the  current market   based on   Pure Price Action   and display the overall trend and signal on the dashboard. When signals are produced the indicator sends alert and notification. Strategy for Signals This indicator uses the daily timeframe to determine the direction of the trend. The hourly timeframe is used to identify possible entries. Main trend and is determined by
This indicator is based on a mathematical formula and an ANN combined, designed to make a model(using previous prices) of the most recent market condition (any chart*) in order to use the model as a forecasting tool. *This indicator can operate on any chart/timeframe, but it's suggested you use multiple timeframes for each trade because this method relies solely on the time factor, you can not use this indicator to predict price volatility, but if it's fit correctly it will show you when the nex
Big promotion on the Robos, Get yours now Robos Indicator The   ROBOS   indicator is a multi timeframe oscillator that targets the   overbought   and   oversold  regions of a price chart, a signal is indicated by the two lines crossing, compatible with all tradable instruments Latest Release The latest release is the version 4.0 #What's new in version 4.0 ? Features Extreme oversold and overbought levels ROBOS version  4.0  comes with cool new feature , the ability to target on
This indicator is based on the crossing of two Moving Average with the RSI It is intended for scalpers Specially designed for Boom and Crash syhtetic indices from Binary.com/Deriv.com It is easy to use and intuitive. We recommend its use on M1 and is equipped with three types of notification Email alert Sound notification Push notification these parameters can be activated and deactivated.
Этот индикатор предлагает солидный метод анализа рынка, основанный на концепции 'Инструмента регрессионного канала'. Путем использования этого инструмента трейдеры могут получить исключительный контроль над регрессионным каналом своего графика, что позволяет принимать более обоснованные торговые решения. Инструмент регрессионного канала является мощным инструментом в арсенале трейдера. Он разработан для предоставления ценной информации о тенденциях цен и потенциальных уровнях поддержки и сопроти
Use with JUMP 25. However it can can with the volatility indices as well because it is a modified version. It is advisable to use create a healthy account management. Measure your risk and happy trading. Other experts to be loaded soon. These are modified in order to optimise profits. Ideal candidates are high risk, high returns individuals who hold trades at a maximum of 1 - 2 hours
This indicator is a scalping indicator intended solely for the Boom and Crash indices of the Deriv Limited market It supports Boom 500, Boom 1000, Crash 500 and Crash 1000 Not repaint and no bug The settings are intuitive and easy to use The product activation number is 20 The Time Frame used depends on the user If you are an aggressive scalper then just use M1 For long trades use M15 If you are conservative use M5 Please contact me for more details of its use
RadioMedia
Cesar Juan Flores Navarro
Indicador de MQL5 basado en 3 EMAs, en función del precio. El precio influye en las EMAs, de tal forma que los Máximos y Mínimos solo la alteran minimamente, este influjo lo llame radio. Considerando la influencia del radio como constante, por lo que no tiene valores de entrada. Ideal para todas las criptomonedas. Funciona en todos los tiempos. Se sugiere operar cuando el precio este abajo y en bajada.... o cuando el precio este encima y en subida.
El Super Suavizador Inteligente es la culminación de la evolución de los suavizadores en funcion del precio, funciona en todos los pares de divisas, es fácil de usar, y puedes usarlo varias veces en un mismo par, afin de darte una idea de hacia donde va el precio, muy util para ver la tendencia a largo plazo. El SSI trata siempre de formar ondas de subidas y bajadas a fin de poder mostrar el máximo y/o mínimo de la tendencia del precio.
EQ Cutrim Theory
Marco Aurelio Santos Costa
Ронал Кутрим в течение 14 лет был увлеченным математиком с более чем 10-летним опытом работы на финансовом рынке. Концепция теории проста - найти дисбаланс между покупателями и продавцами. В этом есть большой смысл, потому что ничто не растет вечно, ничто не падает вечно.   Когда вы находите актив с математической вероятностью неравновесного равновесия, это отличный способ заняться трейдингом:  Включите субтитры, видео сопровождается субтитрами
Двенадцать искуственных нейронных сетей поделенных на четыре ансамбля пытаются предсказать направление движения цены в будущем: маленькая: 1 минута, средняя: 5 минут, большая: 30 минут, королевская: 15 минут. Этот индикатор для активной высокочастотной торговли готов к работе с советником, запускаемым отдельно и получающим сигналы от индикатора в виде публикуемых индикатором глобальных переменных. Этот индикатор не работает в тестере стратегий, поэтому смотрите видео или, напишите запрос мне на
Фильтр:
Varreck
29
Varreck 2023.11.29 15:25 
 

Отличный индикатор, отрабатывает очень точно, рекомендую!!!

Ответ на отзыв