• Обзор
  • Отзывы
  • Обсуждение

Squeeze Momentum Indicator MT5

Squeeze Momentum Indicator for MetaTrader 5 - Unleash the Power of Market Momentum

Introducing the "Squeeze Momentum Indicator" for MetaTrader 5, your gateway to mastering market momentum. This advanced tool is meticulously crafted to provide you with actionable insights into market dynamics, helping you make well-informed trading decisions.

Basic Details:

  • Indicator Type: Squeeze Momentum Indicator for MetaTrader 5
  • Key Metrics: Real-time analysis of market momentum and volatility.
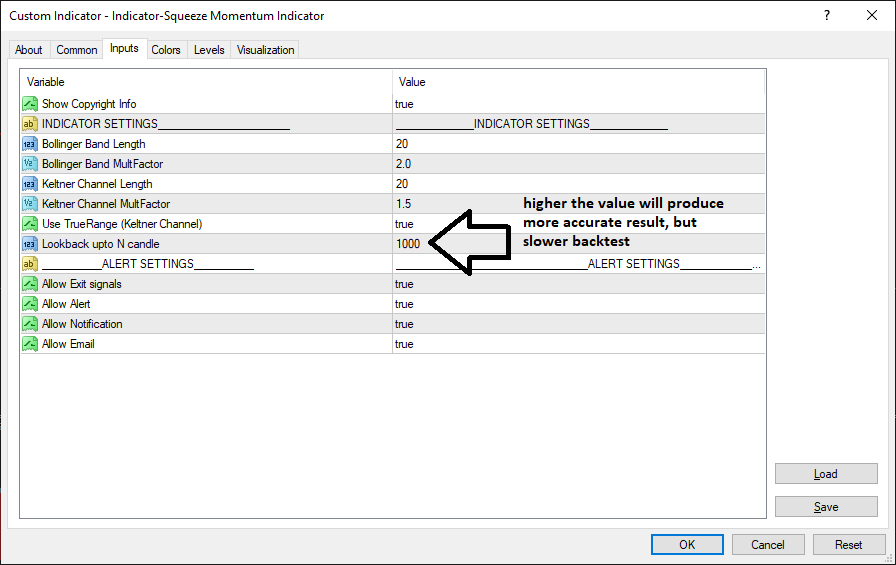
  • Customization: Fully customizable settings to align with your unique trading strategy.
  • Asset Compatibility: Ideal for trading various markets, including Forex, stocks, commodities, and cryptocurrencies.

How the Squeeze Momentum Indicator Works:

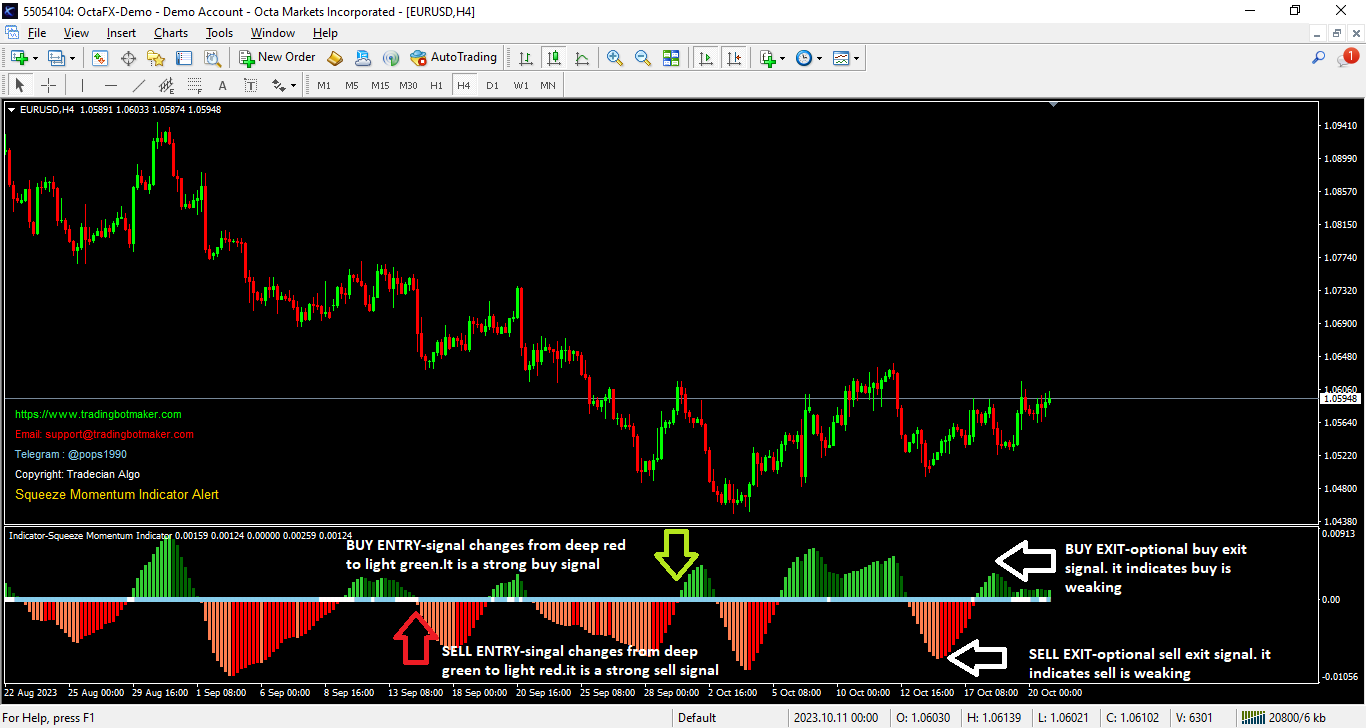
The Squeeze Momentum Indicator is founded on the principle of momentum analysis, aiming to identify periods of consolidation and potential breakouts. It combines various technical indicators to provide you with a comprehensive view of the market's directional bias and potential momentum shifts.

This indicator is your compass in the world of trading, helping you pinpoint opportune moments to enter or exit trades by capitalizing on market momentum.

Key Features:

  1. Precision Momentum Analysis: The Squeeze Momentum Indicator excels at providing accurate insights into market momentum, allowing you to make well-timed trading decisions.

  2. Real-time Alerts: Stay ahead of market moves with real-time alerts based on momentum shifts and Squeeze breakout conditions, ensuring you never miss trading opportunities.

  3. User-friendly Interface: The user-friendly interface ensures traders of all levels can access and utilize this advanced tool with ease.

  4. Customization: Tailor the Squeeze Momentum Indicator to your unique trading preferences, offering adaptability to evolving market conditions.

Why Choose Squeeze Momentum Indicator for MetaTrader 5:

  • Maximize Profit Potential: Leverage precise momentum insights to enhance your trading profitability and risk management.

  • Efficiency: Save valuable time with real-time alerts and comprehensive momentum analysis, streamlining your trading process.

  • Stay Informed: The real-time alerts and data provided by this indicator empower you to make well-informed trading decisions in dynamic market conditions.

  • Dedicated Support: Our support team is readily available to assist you with any inquiries, ensuring a seamless and rewarding trading experience.

Get Started Today:

Elevate your trading experience with the Squeeze Momentum Indicator for MetaTrader 5. Gain a deep understanding of market momentum, make profitable decisions, and stay ahead of potential breakouts and shifts.

Don't miss out on your next trading success!


Рекомендуем также
The Beta index, also known as the Beta indicator, is one of the key reference indicators for hedging institutions. It allows you to measure the relative risk of individual assets, such as currencies and commodities, in comparison to market portfolios, cross-currency pairs, the U.S. dollar index, and stock indices. By understanding how your assets perform in relation to market benchmarks, you will have a clearer understanding of your investment risk. Key Features: Accurate Risk Assessment: The Be
Индикатор Market Structures Pro находит и показывает на графике 5 (пять) паттернов системы Smart Money Concepts (SMC) , а именно: Break Of Structures (BoS) Change of character (CHoCH) Equal Highs & Lows Premium, Equilibrium and Discount зоны с сеткой Фибо High-high, Low-low, High-low and Low-high экстремумы   Паттерны отображаются для двух режимов - Swing   и  Internal  и легко различаются цветом на график. Для режима Internal выбраны более контрастные цвета, более тонкие линии и меньший размер
--- StudentK Sync Chart --- 1. Move charts at the same time 2. Cross check among different Symbols and Timeframes 3. Plan your own trading strategies --- Context --- StudentK is not indicated as a master or K Sir for knowledgeable person who claims for winning all the time. (But lots of traders should know the fact that it is rarely truth, especially in fluctuated period of time) StudentK is a group of years-experienced traders who want to share amazing tools in Free and Paid versions. Aimi
1. Why did I develop this series of indicators I found that most traders need to use multiple time frame indicators. They usually switch time frame to see indicators. However, once the timeframe is switched, you cannot see the  corresponding relationship  between  the price in the smaller timeframe  and  the indicator in the larger timeframe . For example: if your price chart is in H1 timeframe, you can see H4, D1 and W1 indicators in H1 timeframe Chart. This is more helpful for you to find t
Utilities
Douglas Lucio De Araujo
Indicator with 3 features - Clock : Clock independent of the chart, counting continues even when the market is closed. - Template : After setting up a configuration in any graphic, be it color patterns, indicators, zoom ... The configuration will be copied to all active graphics. - TimeFrame : Set the TimeFrame on a chart, and with just one click all the active charts will be changed to the same TimeFrame.
Представляем RSIScalperPro - революционный индикатор на основе RSI для MetaTrader 5, специально разработанный для скальпинга на графике одной минуты. С RSIScalperPro у вас будет мощный инструментарий для точных сигналов входа и выхода, чтобы повысить вашу торговую эффективность. RSIScalperPro использует два различных индикатора RSI, которые предоставляют четкие сигналы для уровней перекупленности и перепроданности. Вы можете настроить временные периоды и ограничительные значения двух RSI в соот
** All Symbols x All Timeframes scan just by pressing scanner button ** *** Contact me after the purchase to send you instructions and add you in "ABCD scanner group" for sharing or seeing experiences with other users. Introduction This indicator scans AB=CD retracement patterns in all charts. The ABCD is the basic foundation for all harmonic patterns and highly repetitive with a high success rate . The ABCD Scanner indicator is a scanner reversal ABCD pattern that helps you identify when the pr
Индикатор Magneto Weekly Pro отображает: Недельные важные линии поддержки и сопротивления (выделены желтым, красным и синим цветами). Основные недельные цели (выделены белым цветом). Недельные паттерны возврата цены (обозначаются красными флажками). Применение индикатора Magneto Pro можно использовать и как дополнение к существующей стратегии, и как самодостаточную торговую стратегию. Данный продукт состоит из двух индикаторов, работающих на разных временных промежутках, и предназначен для скал
1. Why did I develop this series of indicators I found that most traders need to use multiple time frame indicators. They usually switch time frame to see indicators. However, once the timeframe is switched, you cannot see the  corresponding relationship  between  the price in the smaller timeframe  and  the indicator in the larger timeframe . For example: if your price chart is in H1 timeframe, you can see H4, D1 and W1 indicators in H1 timeframe Chart. This is more helpful for you to find t
This is a simple arrow system based on Engulfing Candlestick Pattern. It gives you alerts on your smartphone when there is an engulfing candlestick pattern happens. Which type of alerts available? 1. It paints on chart Up/Down Arrows. 2. Popup message and sound alert in trading terminal window. 3. Push notification or Alert on your Android and IOS mobile phones (requires MT4 or MT5 app installed!) *Note: Use it on higher timeframes like H4 (4 hours), D1 (1 Day) then find trade opportunities on s
1. Why did I develop this series of indicators I found that most traders need to use multiple time frame indicators. They usually switch time frame to see indicators. However, once the timeframe is switched, you cannot see the  corresponding relationship  between  the price in the smaller timeframe  and  the indicator in the larger timeframe . For example: if your price chart is in H1 timeframe, you can see H4, D1 and W1 indicators in H1 timeframe Chart. This is more helpful for you to find t
- This is an implementation of OCC ==> open close cross - This indicator applies twelve different averaging methods to open and close prices separately to signal the trend switching. - All MA methods are set as input as well as period and different offsets applied to linear regression and ALMA averaging. - Buffers 16 and 17 can be used in EAs to detect trend direction. - You can message in private chat for further changes you need.
1. Why did I develop this series of indicators I found that most traders need to use multiple time frame indicators. They usually switch time frame to see indicators. However, once the timeframe is switched, you cannot see the  corresponding relationship  between  the price in the smaller timeframe  and  the indicator in the larger timeframe . For example: if your price chart is in H1 timeframe, you can see H4, D1 and W1 indicators in H1 timeframe Chart. This is more helpful for you to find t
The best quality application of the famous Super Trend indicator that requires no introduction. It is completely faithful to the original algorithm and powered by the CCI indicator. - easy to trade - It implements all kinds of warnings. - It implements a multi-timezone dashboard. - It cannot be repainted or backpainted. Input parameters - ATR Period – This is the average true range period. - ATR Multiplier - The ATR multiplier that defines the trend. - CCI - Makes trend following powerful. -
!! FLASH SALE !!   Over 80% off !!     For ONE week only. Now only $47 - normally $297! >>>      Ends on 30 June 2023 - Don't miss it! Buy and Sell Arrows when price breaks away from mean price. Sends Alerts – On MT5 To Your Phone To Your Email Does not repaint . Works on any Forex pair, any timeframe. 10 Activations allowed so you are free from limitations >> MT4 Version Here For spreads from a tiny 0.1 pips RAW/ECN Accounts,  click here . Check out my Waka Esque EA signal here: >>
Индикатор предназначен для того, чтобы вовремя закрывать позиции по рынку. Например: досрочно фиксировать прибыль, если цена не достигла TakeProfit, а рынок разворачивается. Индикатор анализирует импульс, а не тренд. О тренде никакой информации он не дает. Индикатор хорошо подходит для поиска дивергенции. Индикатор Ershov 38 Parrots динамически подстраивается под рынок и выявляет импульсы движения цены средней и высокой амплитуды. На мелкие скачки цены почти не реагирует.  Принципиальное о
KT Psar Arrows MT5
KEENBASE SOFTWARE SOLUTIONS
KT Psar Arrows plots the arrows on chart using the standard Parabolic SAR indicator. A bullish arrow is plotted when the candle's high touch the SAR. A bearish arrow is plotted when the candle's low touch the SAR. The signals are generated in the real-time without waiting for the bar close.  Features A beneficial tool for traders who want to experiment with the trading strategies that include the use of Parabolic Sar indicator.  Can be used to find turning points in the market. Use custom PSA
Индикатор Rocket Trend трендовый. Индикатор рисует вдоль графика двухцветные точки соединенные между собой линиями. Это трендовый индикатор, представляет из себя алгоритмический индикатор. Прост в работе и понимании при появлении синего кружка необходимо покупать, при появлении красного - продавать. Индикатор используется для скальпинга и пипсовки, не плохо себя зарекомендовал. Rocket Trend доступный для анализа направления тренда за конкретный отрезок времени. Идеально подходит для начинающих
1. Why did I develop this series of indicators I found that most traders need to use multiple time frame indicators. They usually switch time frame to see indicators. However, once the timeframe is switched, you cannot see the  corresponding relationship  between  the price in the smaller timeframe  and  the indicator in the larger timeframe . For example: if your price chart is in H1 timeframe, you can see H4, D1 and W1 indicators in H1 timeframe Chart. This is more helpful for you to find t
I do not have the exact indicator for MT4 but the nearest possible look alike can be downloaded from here . Also you may check this link . This is the exact conversion from TradingView: "Donchian Trend Ribbon" By "LonesomeTheBlue". One of the coolest indicators out there to detect trend direction and strength. As a trader you always need such indicator to avoid getting chopped in range markets. There are ten buffers as colors to use in EAs also. The indicator is loaded light and non-repaint. Not
1. Why did I develop this series of indicators I found that most traders need to use multiple time frame indicators. They usually switch time frame to see indicators. However, once the timeframe is switched, you cannot see the  corresponding relationship  between  the price in the smaller timeframe  and  the indicator in the larger timeframe . For example: if your price chart is in H1 timeframe, you can see H4, D1 and W1 indicators in H1 timeframe Chart. This is more helpful for you to find t
С этим продуктом покупают
Прежде всего стоит подчеркнуть, что эта торговая система является индикатором без перерисовки, без повторной отрисовки и без задержки, что делает ее идеальной как для ручной, так и для роботизированной торговли. «Smart Trend Trading System MT5» - это комплексное торговое решение, созданное для новичков и опытных трейдеров. Он объединяет более 10 премиальных индикаторов и предлагает более 7 надежных торговых стратегий, что делает его универсальным выбором для разнообразных рыночных условий. Стр
Прежде всего стоит подчеркнуть, что этот торговый индикатор не перерисовывается, не перерисовывает и не отставает, что делает его идеальным как для ручной, так и для роботизированной торговли. Атомный аналитик - это индикатор ценового действия PA, который использует силу и импульс цены, чтобы найти лучший край на рынке. Оборудованный расширенными фильтрами, которые помогают убирать шумы и ложные сигналы, и повышают торговый потенциал. Используя несколько слоев сложных индикаторов, Атомный анали
Представляем       Индикатор Quantum Trend Sniper   , инновационный индикатор MQL5, который меняет способ определения разворотов тренда и торговли ими! Разработан командой опытных трейдеров со стажем торговли более 13 лет,       Снайперский индикатор Quantum Trend       разработан, чтобы вывести ваше торговое путешествие на новые высоты благодаря инновационному способу определения разворотов тренда с чрезвычайно высокой точностью. ***Купите индикатор Quantum Trend Sniper и получите индикатор
FX Volume MT5
Daniel Stein
4.94 (17)
Получайте ежедневную информацию о рынке с подробностями и скриншотами в нашем утреннем брифинге здесь, на mql5 , и в Telegram ! FX Volume - это ПЕРВЫЙ и ЕДИНСТВЕННЫЙ индикатор объема, который дает РЕАЛЬНОЕ представление о настроении рынка с точки зрения брокера. Он дает потрясающее представление о том, как институциональные участники рынка, такие как брокеры, позиционируют себя на рынке Forex, гораздо быстрее, чем отчеты COT. Видеть эту информацию прямо на своем графике - это настоящий геймчей
Раскройте силу торговли трендами с помощью индикатора Trend Screener: вашего идеального решения для торговли трендами, основанного на нечеткой логике и мультивалютной системе! Повысьте уровень своей торговли по тренду с помощью Trend Screener, революционного индикатора тренда, основанного на нечеткой логике. Это мощный индикатор отслеживания тренда, который сочетает в себе более 13 инструментов и функций премиум-класса и 3 торговые стратегии, что делает его универсальным выбором для превращения
Получайте ежедневную информацию о рынке с подробностями и скриншотами через наш утренний брифинг здесь, на mql5 , и в Telegram ! FX Power MT5 NG - это новое поколение нашего популярного измерителя силы валют FX Power. Что же предлагает этот измеритель силы нового поколения? Все, что вы любили в оригинальном FX Power ПЛЮС Анализ силы GOLD/XAU Еще более точные результаты расчетов Индивидуально настраиваемые периоды анализа Настраиваемый предел расчета для еще более высокой производительности Спец
Топовый индикатор МТ5, дающий сигналы для входа в сделки без перерисовки! Идеальные точки входа в сделки для  валют, крипты, металлов, акций, индексов !  Смотрите  видео  (6:22) с примером отработки всего одного сигнала, окупившего индикатор. Версия индикатора для MT4 Преимущества индикатора Сигналы на вход без перерисовки Если сигнал появился, он никуда НЕ исчезает! В отличие от индикаторов с перерисовкой, которые ведут к потере депозита, потому что могут показать сигнал, а потом убрать его.
Прежде всего стоит подчеркнуть, что этот Торговый Инструмент является Неперерисовывающимся Нерепейнтинговым Индикатором, что делает его идеальным для профессиональной торговли. Индикатор Концепций Умного Действия Цены - очень мощный инструмент как для новичков, так и для опытных трейдеров. Он объединяет более 20 полезных индикаторов в одном, комбинируя передовые торговые идеи, такие как анализ Inner Circle Trader и стратегии торговли концепциями умных денег. Этот индикатор сосредотачивается н
Сейчас 147 долл. США (увеличиваясь до 499 долл. США после нескольких обновлений) - неограниченные учетные записи (ПК или Mac) Руководство пользователя + Обучающие видео + Доступ к приватному Discord-каналу + VIP-статус и мобильная версия + Лицензия на 5 ПК с неограниченным количеством аккаунтов и терминалов MT4. Сколько раз вы покупали индикатор торговли с замечательными обратными тестами, доказательствами производительности на живых счетах и зашикарными цифрами и статистикой, но после испо
Auto Order Block with break of structure based on ICT and Smart Money Concepts Futures Break of Structure ( BoS )             Order block ( OB )            Higher time frame Order block / Point of Interest ( POI )    shown on current chart           Fair value Gap ( FVG ) / Imbalance   ,  MTF      ( Multi Time Frame )    Volume Imbalance     ,  MTF          vIMB Gap’s Equal High / Low’s     ,  MTF             EQH / EQL Liquidity               Current Day High / Low           HOD /
AW Trend Predictor MT5
AW Trading Software Limited
4.76 (55)
Сочетание тренда и пробоя уровней в одной системе. Продвинутый алгоритм индикатора фильтрует рыночный шум, определяет тренд, точки входа, а также возможные уровни выхода из позиции. Сигналы индикатора записываются в статистический модуль, который позволяет выбирать наиболее подходящие инструменты, показывая эффективность истории сигналов. Индикатор рассчитывает отметки ТейкПрофитов и стоплосса. Руководство пользователя ->  ЗДЕСЬ  / MT4 версия ->  ЗДЕСЬ Как торговать с индикатором: Торговля с Tr
Индикатор Supply Demand использует предыдущее ценовое действие для выявления потенциального дисбаланса между покупателями и продавцами. Ключевым является определение зон с лучшими возможностями, а не просто вероятностей. Индикатор Blahtech Supply Demand обеспечивает функционал, не доступный ни в одной платформе. Этот индикатор 4 в 1 не только выделяет зоны с более высокой вероятностью на основе механизма оценки силы по множественным критериям, но также комбинирует его с мульти-таймфреймовым ана
ICT, SMC, SMART MONEY CONCEPTS, SMART MONEY, Smart Money Concept, Support and Resistance, Trend Analysis, Price Action, Market Structure, Order Blocks, BOS/CHoCH,   Breaker Blocks ,  Momentum Shift,   Supply&Demand Zone/Order Blocks , Strong Imbalance,   HH/LL/HL/LH,    Fair Value Gap, FVG,  Premium  &   Discount   Zones, Fibonacci Retracement, OTE, Buy Side Liquidity, Sell Side Liquidity, BSL/SSL Taken, Equal Highs & Lows, MTF Dashboard, Multiple Time Frame, BigBar, HTF OB, HTF Market Structure
Индикатор Gann Squares представляет собой мощный инструмент для анализа рынка, основанный на математических концепциях, представленных W.D. Gann в его статье "Математическая формула для прогнозирования рынка." Этот индикатор включает в себя техники Ганна, связанные с квадратными числами, такими как 144, 90 и 52, а также Квадрат 9. Кроме того, он включает метод по использованию Квадрата 9 в сочетании с каналами и паттерном звезды. Руководство пользователя и использование: Перед использованием это
TPSpro TRENDPRO   —  трендовый индикатор, который автоматически анализирует рынок и предоставляет информацию о тренде и каждой его смене а также дающий сигналы для входа в сделки без перерисовки! Индикатор использует каждую свечу, анализируя их отдельно. относя к разным импульсам – импульс вверх или вниз. Точные точки входа в сделки  для  валют, крипты, металлов, акций, индексов! -  Version MT4                ПОЛНОЕ ОПИСАНИЕ          /        СЕТАПЫ ДЛЯ ТОРГОВЛИ                        Рекоменд
Этот индикатор является уникальным, качественным и доступным инструментом для торговли, включающим в себя наши собственные разработки и новую формулу. В обновленной версии появилась возможность отображать зоны двух таймфреймов. Это означает, что вам будут доступны зоны не только на старшем ТФ, а сразу с двух таймфреймов - таймфрейма графика и старшего: отображение вложенных зон. Обновление обязательно понравится всем трейдерам, торгующим по зонам спроса и предложения. Важная информация Для мак
Автоматическое построение уровней поддержки и сопротивления ПЛЮС разрывы между свечами на вашем графике, чтобы вы могли видеть, куда цена, скорее всего, направится дальше и/или потенциально может развернуться. Этот индикатор разработан для использования в рамках методики позиционной торговли, которая преподается на моем сайте (The Market Structure Trader), и отображает ключевую информацию для таргетинга и потенциальных входов. MT4 Version:  https://www.mql5.com/en/market/product/97246/ В инди
Важным ключевым элементом в трейдинге являетсязоны или уровни, от которых принимаются решения о покупке или продаже торгового инструмента. Несмотря на попытки крупных игроков скрыть свое присутствие на рынке, они неизбежно оставляют следы. Наша задача заключалась в том, чтобы научиться находить эти следы и правильно их интерпретировать. Первые Импульсные Уровни (ПИУ)     -      Reversal First Impulse levels (RFI)   -  Version MT4                INSTRUCTIONS                 RUS                 E
Станьте Breaker Trader и получайте прибыль от изменений структуры рынка по мере изменения цены. Индикатор выключателя блока ордеров определяет, когда тренд или движение цены приближаются к истощению и готовы развернуться. Он предупреждает вас об изменениях в структуре рынка, которые обычно происходят, когда произойдет разворот или серьезный откат. Индикатор использует собственный расчет, который определяет прорывы и ценовой импульс. Каждый раз, когда новый максимум формируется около возможн
Представляем       Quantum Breakout PRO   , новаторский индикатор MQL5, который меняет ваш способ торговли в зонах прорыва! Разработан командой опытных трейдеров со стажем торговли более 13 лет,       Квантовый прорыв PRO       разработан, чтобы поднять ваше торговое путешествие к новым высотам с его инновационной и динамичной стратегией зоны прорыва. Quantum Breakout Indicator покажет вам сигнальные стрелки на зонах прорыва с 5 целевыми зонами прибыли и предложением стоп-лосса на основе по
TrendLine PRO MT5
Evgenii Aksenov
4.78 (49)
Индикатор   Trend Line PRO   является самостоятельной торговой стратегией. Он показывает смену тренда, точку входа в сделку, а так же автоматически рассчитывает три уровня Take Profit и защиту от потери Stop Loss Trend Line PRO   идеально подходит для всех символов Meta Trader:  валют, металлов, криптовалют, акций и индексов   Преимущества Trend Line PRO: Никогда не перерисовывает свои сигналы Возможность использования  как самостоятельную стратегию Имеет три автоматических уровня Take Profi
Step into the realm of Forex trading with confidence and precision using XQ, a cutting-edge Forex indicator designed to elevate your trading game to unprecedented heights. Whether you're a seasoned trader or just stepping into the world of currency exchange, XQ Forex Indicator empowers you with the insights and signals needed to make informed trading decisions. The signal conditions are a combination of three indicators, and XQ Forex Indicator only display  medium and long-term trends . The ind
Индикатор Trend Line Map является дополнением к индикатору Trend Screener Indicator. Он работает как сканер всех сигналов, генерируемых скринером тренда (сигналы линии тренда). Это сканер линий тренда на основе индикатора Trend Screener. Если у вас нет индикатора Trend Screener Pro, программа Trend Line Map Pro работать не будет. It's a Trend Line Scanner based on Trend Screener Indicator. If you don't have Trend Screener Pro Indicator,     the Trend Line Map Pro will not work . Зайдя в н
TrendDecoder Premium MT5
Christophe, Pa Trouillas
5 (1)
Определите диапазоны и следующие вероятные движения  | Получите самые ранние сигналы и силу трендов    |  Получите четкие выходы перед разворотом  |  Определите уровни Фибо, которые будет тестировать цена   |  Индикатор без перерисовки и задержек - идеально подходит для ручной и автоматической торговли - подходит для всех активов и всех временных единиц $ 69   на старте - затем снова   $149 После покупки   пожалуйста, свяжитесь с моим каналом  для получения рекомендуемых настроек Версия МТ4 :  
MetaBands M5
Vahidreza Heidar Gholami
4.67 (3)
MetaBands использует мощные и уникальные алгоритмы для построения каналов и обнаружения тенденций, чтобы предоставлять трейдерам потенциальные точки для входа и выхода из сделок. Это индикатор канала плюс мощный индикатор тенденций. Он включает различные типы каналов, которые могут быть объединены для создания новых каналов, просто используя параметры ввода. MetaBands использует все типы оповещений, чтобы уведомлять пользователей о событиях на рынке. Особенности Поддерживает большинство алгоритм
Профиль Рынка (Market Profile) определяет ряд типов дней, которые помогают трейдеру распознать поведение рынка. Ключевая особенность - это область значений (Value Area), представляющая диапазон ценового действия, в котором произошло 70% торговли. Понимание области значений может помочь трейдерам вникнуть в направление рынка и установить торговлю с более высокими шансами на успех. Это отличное дополнение к любой системе, которую вы возможно используете. Blahtech Limited представляет сообществу Me
This indicator can be used to display Support and Resistance levels according to  the  Malaysian SNR concept , in which Support and Resistance are exact levels of a line chart. Malaysian SNR There are 3 different horizontal levels in Malaysian SNR: A-Level : This level is located at the peak of this line chart. (shape looks like the letter A) V-Level : Level at the valley of a line chart, (shape looks like the letter V) Gap-Leve l: This level is located at the Close/Open gap between two cand
The Volume by Price Indicator for MetaTrader 5 features Volume Profile and Market Profile TPO (Time Price Opportunity). Get valuable insights out of currencies, equities and commodities data. Gain an edge trading financial markets. Volume and TPO histogram bar and line charts. Volume Footprint charts. TPO letter and block marker charts including split structures. Versatile segmentation and compositing methods. Static, dynamic and flexible ranges with relative and/or absolute visualizations. Lay
ICT Silver Bullet MT5
Haidar, Lionel Haj Ali
5 (19)
ICT Silver Bullet If you are searching for a reliable indicator to trade the ICT Silver Bullet concept, or ICT concepts, Smart Money Concepts, or SMC, this indicator will respond to your need!  Before version 2.2, this indicator was focused only on ICT Silver Bullet, but moving forward, we will include the different elements for smart money concept trading. This indicator will help you identify the following: FVG - fair value gaps Market structure: BOS and CHOCH. It is based on ZIGZAG as it is
Account Graph MT5
Kyra Nickaline Watson-gordon
5 (1)
An indicator to draw a graph of account current and historical state such as Balance, Equity, Margin, Free Margin, Margin Level, Drawdown, Account Profit, Deposit and Withdrawals. Indicator Inputs : Draw Balance Graph Draw Equity Graph Draw Margin Graph Draw Free Margin Graph Draw Margin Level Graph Draw Drawdown Graph Draw Account Profit Graph Hide Data on Chart and Buffers Connect Gaps by Lines Sign of DDs on Profit Sign of DDs on Loss Tips : The Indicator will draw historical balance gra
Другие продукты этого автора
The Nadaraya Watson Envelope is a technical indicator available in the MetaTrader 4 (MT4) platform. It uses a non-parametric method to estimate the underlying trend of a financial asset based on its past price movements. The envelope is created by calculating a weighted average of the asset's past prices, with more recent prices being given greater weight. This produces a smooth curve that represents the estimated trend of the asset. The envelope is then drawn around this curve, with upper and l
MT4 Local Trade Copier Pro
Biswarup Banerjee
3.77 (13)
About The Product This is an mt4 expert advisor which will let the end user to copy trades from a source mt4 account to N different mt4/mt5 account in the same pc. It is specially useful when you want to copy your trades from an account to several client account or accounts which will have different parameter for those trades. This product provides options to copy trades with different options as well as copy them in reverse. you can find the MT5 version   here . You can try the free trial demo
The Nadaraya Watson Envelop indicator for MT5 is a popular tool used by traders to identify trends and potential buy/sell signals. The indicator is based on a non-parametric regression model that uses kernel smoothing to estimate the underlying trend of the market. The resulting envelopes are then plotted around the trend line, providing traders with an indication of where prices are likely to fluctuate. One of the key features of this indicator is its ability to send alerts, emails, and notific
Whether you're a seasoned forex trader or just starting, Telegram Signal Sender is a must-have tool for anyone looking to start their telegram channel as a forex signal provider. With its user-friendly interface and advanced features, you can easily set up your signals and watch as your followers start to grow. So, what are you waiting for?  Features:  Highly customizable panel for calculating stop loss and take profit values  User-friendly interface for easy setup of forex signals Ability to se
Product Name: Grid Trade Manager MT5 Description: The Grid Trade Manager EA for MetaTrader 5 is meticulously crafted to oversee trades employing a grid trading strategy. It strategically places a sequence of pending buy and sell orders at predefined intervals, forming a grid pattern. This EA vigilantly monitors market fluctuations, dynamically adjusting the grid to optimize potential profits. Additionally, it incorporates robust risk management features to control grid size and curtail potential
FREE
Product Name: Trailing Stop and Breakeven Management EA Description: This EA (Expert Advisor) is designed to set trailing stops and breakeven levels for trades based on input parameters and a magic number in MT5. It can be used to manage trades placed manually or by any other EA. The EA allows customization of various settings to suit your trading strategy. General Settings: Enable Magic Number (ENABLE_MAGIC_NUMBER): Enable to use a magic number for trades. Set to false for manual trades. Magic
FREE
Product Name: Hedge Trade Manager MT5 Description: The "Hedge Trade Manager" EA for MetaTrader 5 is a sophisticated solution designed to adeptly manage trades through a hedge trading strategy. With a range of configurable settings, this EA provides comprehensive control over hedge trades. The documentation below outlines the various inputs and parameters to assist you in customizing the EA to suit your trading preferences. Overall Settings/Input Guide Name Setting Description General Settings Ma
FREE
GG TrendBar Indicator - Your Multitimeframe ADX Trading Solution Experience the power of multi-timeframe trading with the "GG TrendBar MT5 Indicator." This versatile tool, built upon the ADX indicator, offers precise insights by considering multiple timeframes, ensuring you make well-informed trading decisions. Basic Details : Indicator Type : GG TrendBar Indicator (Multi-Timeframe ADX) Key Metrics : Real-time ADX analysis across multiple timeframes. Customization : Enable or disable specific ti
Brilliant Reversal Indicator for MetaTrader 5 - Your Ultimate Alert-Driven Trading Solution Unlock unparalleled trading success with the "Brilliant Reversal Indicator" tailored for MetaTrader 5. This powerful tool has been meticulously designed to empower traders by identifying critical reversal opportunities with lightning-fast alerts. Key Features: Precise Reversal Detection: The Brilliant Reversal Indicator for MT5 specializes in pinpointing potential trend reversals, providing you with a str
Close Manager EA for MetaTrader 5 Introduction: Welcome to the Close Manager EA, an essential tool designed exclusively for MetaTrader 5. This expert advisor has been meticulously crafted to streamline and enhance the trade closure process. Whether trades are initiated manually or by other EAs, this tool offers a diverse range of customizable criteria, empowering traders with enhanced control over their trade exits. You can find the MT4 version here Key Features: Logs Capture (SHOW_LOGS): Enable
FREE
RSI Trader Expert Advisor for MetaTrader 5 Introduction: Welcome to the RSI Trader EA, an advanced tool designed exclusively for MetaTrader 5. This expert advisor streamlines trading activities by harnessing the power of the Relative Strength Index (RSI) indicator, automating trade entries and exits based on overbought and oversold conditions. The EA also facilitates reverse trading setups within these zones, offering a versatile approach to managing trades. You can find MT4 version here For det
About The Product This is an MT5 expert advisor which will let the end user to copy trades from a source mt5 account to N different mt5/mt4 account in the same pc. It is specially useful when you want to copy your trades from an account to several client account or accounts which will have different parameter for those trades. This product provides options to copy trades with different options as well as copy them in reverse. You can try the free trial demo on the link below. Complete User Gu
The MT4 indicator that we are describing is designed to provide traders with an alert, notification, and email when Fibonacci levels are crossed. The Fibonacci levels are calculated based on the zigzag indicator, which helps to identify potential trend reversals in the market. When the indicator detects that a price has crossed a Fibonacci level, it will trigger an alert and send a notification to the trader's MT4 mobile app. Additionally, the indicator can be configured to send an email to the
FREE
Inventory Retracement Trade it is designed based on one of the most popular tradingview indicator.  This is mostly combined with other popurlar trend indicator to confirm the strength of the movement. Definition Inventory Retracement Trade is quickly becoming one of the most popular ways to identify where short-term counter trend institutional inventory has subsided and when it’s time to re-enter into a trade’s original trend direction.
Super Trend Indicator for MetaTrader 5 - Elevate Your Trading Precision Experience the future of trading with the "Super Trend Indicator" designed for MetaTrader 5. This versatile tool is your key to precise market analysis, providing insights into potential trend directions that enhance your trading decisions. Basic Details : Indicator Type : Super Trend Indicator for MetaTrader 5 Key Metrics : Real-time analysis of market trends using a proprietary algorithm. Customization : Fully customizable
Volume Oscilator is a popular indicator available in trading view which is very popular among traders Definition The Volume Oscillator is an indicator made up of two Moving Averages (MA) surrounding volume, one being fast and the other slow. The slow volume MA value is then subtracted from the value of the fastlow Moving Average. The Volume Oscillator measures volume by analyzing the relationship between the two Moving Averages mentioned. When combined with other indicators it provides a very st
FREE
Introducing the Ultimate Trade Panel MT5 - Your All-in-One Trade Manager for MQL5 Trading Are you a trader looking to streamline your trading activities and gain a competitive edge in the market? Look no further! The Ultimate Trade Panel MT5 is here to revolutionize your trading experience on the MQL5 platform. With a plethora of unique and time-saving features, this expert advisor is designed to be your reliable companion for day-to-day trading activities. Key Features: Indicator Manager: Say g
Account Trailing Stop Manager MT5 Description: The "Account Trailing Stop Manager MT5" EA is designed to automatically calculate and remember the profit of the entire account or specific magic number, and trail it like a trailing stop loss. When the current profit becomes lower than the last saved profit, it will close all trades. This EA provides a convenient way to manage trailing stops for your account. For detailed documentation  Overall Settings/Input Guide   High Level Overview of Featu
FREE
Angle Of Price
Biswarup Banerjee
1 (1)
Angle of Price It is a trend following indicator. The idea behind this indicator is very simple. it calculates the angle of certain price type with its N candle back price type. When the price is moving toward upward direction positive angle histograms will be created and vice versa for downward direction. There are couple of price type supported in this indicator. Which is as follows Close Open High Low Median Typical Weighted When combined with other indicators it could be used as a very power
FREE
Risk Management Panel is unique to tool calculate your risk quickly and place trades based on your account money. There are two options for the user  Account Equity Account Balance Tools like these is specially useful when you have to take a quickly decision about your trade but dont have the time to calculate the risk. It works with magic number. So the advantage is a trade placed by this panel could be manipulated by the other expert advisors as well
FREE
Angle of Moving Averages This indicator is very simple yet powerful concept which constantly calculate the slope of the current bar moving average with respect to the N bar before moving average value. This no only give a good entry and exit signal but also it shows traders the strength of the signal. It shows positive green histogram when market is moving toward upward direction and red histograms for downtrend. When large histograms found means market has  very strong trend. Inputs Available
Description This Expert Advisor mainly works on range breakout on a particular timeframe. The logic behind the this pretty simple. When a range is formed in any time frame (e.g. the range should be less than 20 pips and there must be atleast 30 candle in that range), this ea will wait for the range to be broken out on any direction. If the range is broken on the upper side it will enter into the buy position and hedge the lower ragne with sell position(Could be martingale multiplied lots). If
This is very simple strategy based on martingale and reverse martingale strategy. When Ea keeps on winning it multiplies with winning multiplier ,when it has a loosing streak it multiplies with loosing multiplier. Whenever cycle goes from winning to loosing or vice versa the lot size will be reset to default one. This will keep the risk minimized as we are using it for both side. Also when we are in loosing streak we keep on changing the order type from its previous example for example if we hav
Confluence Indicator is unique indicator which collects differnt popular indicators and analyzes their data. It decides an overall trend with its strength. It is not only helpful for identifying the the current picture of the market but also helps traders to stay away from non trending market. It maximize the chance of winning by giving an aggregate picuture of markets best reliable technical indicator settings There are total 7 types of signal which this indicator provides. Each candle will sho
Simple trade manager panel is a very usefull utility which gives the trader a flexibility to place orders and close them by profit and loss amount . It also helps in trailing the profit with amount.  It works seamlessly on mt4 terminal. It has features to close specific order type or close all trades Features in nutshell Stoploss ,Takeprofit and Lot size control Book Profit based on amount Cut Loss based on amount Trail Profit after some time Close specific order Type Close all orders
Hercules is a trend indicator which is a very powerfull tool to enter into the position at right time. it also indicates the the rangebound areas very easyly. Its visual representation is same like supertrend . But it is more advanced then super trend . If you combine the entry signal of multiple time frame it would give 98% accuracy in most of the symbols. Additional Features Notification  Alerts Email Arrow for buy and sell signals Easyly accesible buffers for EA development
This is  a combination of utility and trend scalping EA. User can utilize features of many ea within this single ea. you can say it can be configured in such a way that it will act as a different ea based on each setup. There could many permutations combinations of the available indicaotrs , based on which buy and sell signals could be generated. If anyone wants to use it just for alert then also it can be done. It supports all currency pairs and all time frames. List of Indicators Avaialble Rsi
Description Rich dad is scalping bot which works based on multiple trend following indicators settings which is used by many professional traders. It works on the principle of trade accumulation and profit banking system.Once Ea gets the singal for buy and sells it keep on accumulating them bases on some risk calculation. Once the stoploss or profit hits based on risk calculation it will bank profit or cut the losses. It uses the the martingale principle but it is upto the trade if he want to us
Double top and bottom indicator is a pattern scanning indicator which scans the tops and bottoms using zig zag pattern. When it find price bouncing back from the same point twice after a long trend then it generate arrow signals whenever the last resistance points is broken for double bottom and last support price broken for double top. Unlike other top bottom scanner it does not give only 1 signal. it alerts user when ever the last support /resistance is broker from double top/bottom pattern un
This is a pure grid strategy which completely works on pricelevel. So the idea behind this simple algo is when it starts it places 6 orders.  Buy- Current price Sell- Current price BuyStop-  Current price+ Some Pip Configurable distance Sell Limit -   Current price+ Some Pip Configurable distance BuyLimit-    Current price- Some Pip Configurable distance SellStop -     Current price- Some Pip Configurable distance When any order hits its take profit it fill the gap with pending order. and Wh
Фильтр:
Нет отзывов
Ответ на отзыв