• Обзор
  • Отзывы
  • Обсуждение

Historical Spread Indicator

Hello! My name is Saullo and I am an MQL5/4 programmer specializing in custom services for Metatrader.

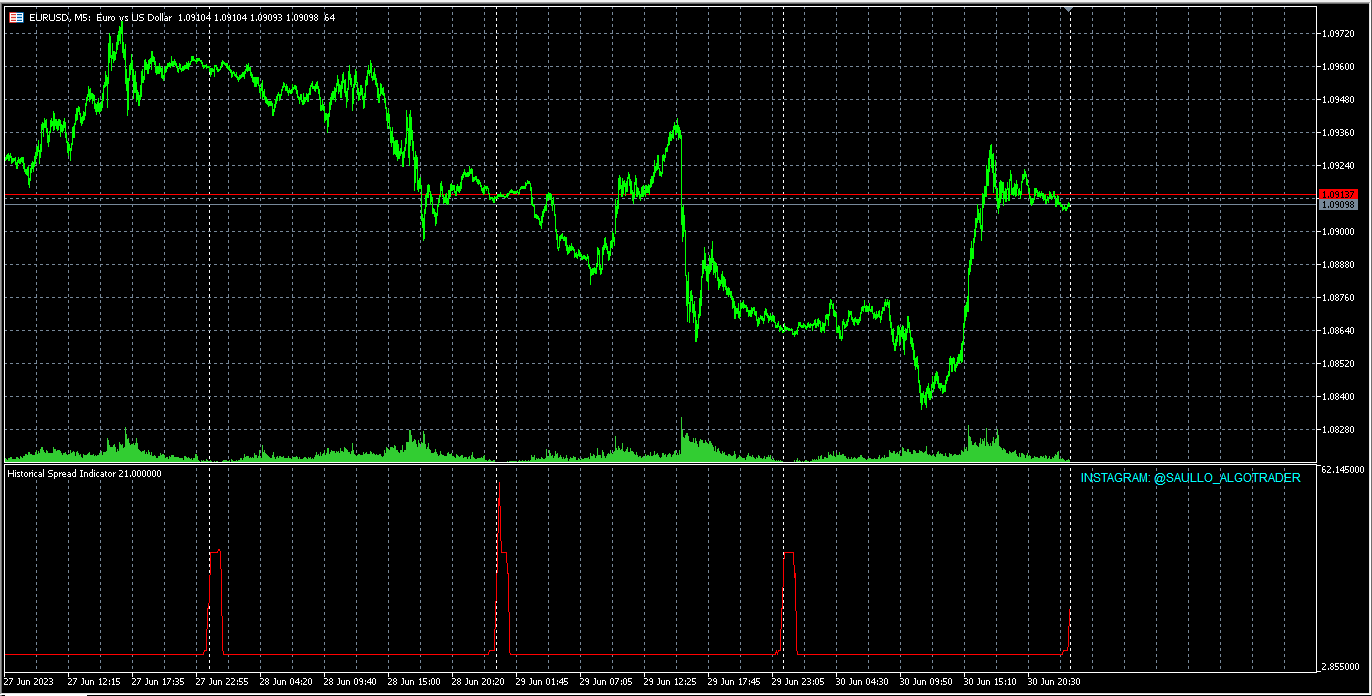
This is a very simple indicator that shows on the chart the history of the spread of each candle of the chart's asset.

Follow me on instagram: @saullo_algotrader

If you need custom development services for metatrader contact me on instagram.

Thank you very much!


Рекомендуем также
This indicator shows external bars ("Aussenstäbe") in the chart in candle form. The colors of the candles can be set individually. Also different colors for bearish and bullish bars are possible. In addition, the color of the wicks or outlines is also adjustable. Outside bars are mentioned e.g. by Michael Voigt in the book "Das große Buch der Markttechnik". All other candles are inner bars.
The default input values are already optimized for EURUSD at time frame M1, spread at 14 and hedged account mode with leverage 1:100 and initial deposit of US$ 10,000, if you don't have this balance, I suggest you to use a CENT account. Always use the strategy tester optimization to set the best values for your assets, time frame, spread and account mode. It is very important and strongly recommended for successful trading. Optimize the input values as your needs.The EA's Strategy The Strategy T
The Beta index, also known as the Beta indicator, is one of the key reference indicators for hedging institutions. It allows you to measure the relative risk of individual assets, such as currencies and commodities, in comparison to market portfolios, cross-currency pairs, the U.S. dollar index, and stock indices. By understanding how your assets perform in relation to market benchmarks, you will have a clearer understanding of your investment risk. Key Features: Accurate Risk Assessment: The Be
Hidden Gap by MMD Hidden Gap by MMD is a unique indicator that detects hidden gaps between three consecutive candles. This observation isn't my own, but in the MMD methodology, it has its application alongside other original indicators. You can apply this indicator to the chart multiple times and set the interval from which you want to see the hidden gaps. You can show or hide these gaps as needed. For example, you can view the chart at an M5 interval and see hidden gaps from an M15 chart, etc.
Indicator Statistics MultiPairs 1. Current Openning Ords - Symbols Openning + Buy Orders + Buy Volume + Sell Orders +Sell Volume - DrawDown by Symbols - Floating by Symbols 2. Closed Orders - Statistics by Today, Week, Month, YTD and Volume - Sum of Closed Orders by Symbol 3. Statistics by Day - Statistics by Say and Volume 4. DrawDown by Day - Each day DrawDown in Week - Percent of DrawDown Contact me at Telegram @MaiMew68
DMC Trend
Deibson Carvalho
4 (1)
Indicator that uses ATR and standard deviation to calculate the current trend. It has the top and bottom line. The top line is shown when it is high, and the bottom line when it is low. The indicator does not draw a trend line or show the trend for the day, or for a certain period. It has the function of indicating the current trend, and may indicate a reversal. use it with caution and at your own risk.
FREE
QuantNas100
Thiago Levi Azevedo Valente
Start the Year 2024 in the perfect way by taking advantage of the Quantitative EA that performed wonderful results in previous years (including 2023) on the NASDAQ Index (NAS100)! It is not a high frequency EA. There are few operations. But they are very precise operations, where the EA analyzes the previous price/volume to understand the current movement and moment. Monthly TP/SL Video = 10% https://www.youtube.com/watch?v=dwgEMMEIIPc Monthly TP/SL Video = 20% https://www.youtube.com/watch?
Plug & Play portfolio - series of high-quality EURUSD H1 strategies for maximized success. The 4th out of 8 strategies  portfolio set.  Each EA works well as a standalone, works even better as portfolio. Triple tested  - backtest, robustness tests , portfolio correlation. Uses a well-known CCI indicator combined with an ADX indicator. Why to buy Fully automatic EA with really easy set-up. Only risk amount to be set and you are good to go. Developed using genetic algorithms on 'in sample' data
MTF MultiMeter5
GRANTLEY LAURENCE CAUSE
Benefits: A new and innovative way of looking across multiple timeframes and multiple indicators on any chart. Provides instant multi-timeframe analysis of any market. i.e. forex currency pairs, cryptocurrency pairs, commodities, etc. It offers precise indications across multiple timeframes of volatility as measured by RSI, ADX and STOCH within one chart. Helps you determine high probability trading setups. See example strategy in comments. Can see bullish/bearish volatility building across mult
В дополнение к поиску бычьих и медвежьих трехлинейных страйков, этот индикатор с несколькими символами и временными рамками также может сканировать следующие модели свечей (объяснение моделей см. На скриншотах): Три белых солдата (разворот> модель продолжения) Три черные вороны (разворот> модель продолжения) На старших таймфреймах формации появляются не очень часто, когда в настройках индикатора включена строгая опция. Но когда они это сделают, это будет с очень высокой вероятностью. По словам Т
MilliiEa
Ricardo Mccartney
Introducing Milli EA: Your Path to Success in Forex Trading Are you seeking a trading solution that can propel your forex trading to new heights? Look no further than Milli EA, a groundbreaking expert advisor that I've poured months of dedication and hard work into. I take immense pride in this EA and have continually refined and backtested it to ensure it becomes an invaluable asset in achieving your trading goals. Milli EA boasts a fusion of top-tier indicators, including Support and Resistanc
R Factor EA MT5
Raphael Minato
5 (5)
R FACTOR Multi Strategy Expert Advisor with Proprietary Dynamic Portfolio Management System After 4 years of development and more than    3    years  of real positive results , R Factor is available for MQL5 community! It has always been important for us that the strategies performed positively for the creator before it could be shared.     Skin In The Game  is essential to demonstrate the belief in the strategy and also to provide a continuous improvement of it. Anyone who has been in this
Trend Ruby
Ignacio Agustin Mene Franco
Trend Ruby, indicator 3 of the ruby ​​pack. trend ruby ​​has the strategy of breaking the structure or trend line How well do the lines mark and gives you the signal of breaking or following the trend? and bounce! works for any temporality, It is used for scalping and also intraday It works for the forex markets all the pairs, also for synthetic indices all pairs ideal for volatility and jumps! also crash and boom!
This is a simple EA Can only open ONE trade EVER then MUST be reattached to the chart everytime you want to use it. Designed to help manual traders Has lot sizes and stops / targets in pips. For a buy trade the engulfing bar must close above the previous red bars high Includes Alarm and Phone notifications Basically if you find a price zone you like and will take a trade if there is an engulfing bar . use this.
FREE
BTC/USD  SCALPING スキャルピング型EA こちらは仮想通貨向け自動売買プログラムとなっております。 シグナル公開予定 通貨ペア :BTC/USDに最適なナンピン及び利確設定をしております ロット数:0.01~ パラメータ ・ロット数:最初の注文ロット数を入力してください。これを基準に、ナンピンに増加していきます。 ・ナンピン:ONにするとナンピンを行いますので、ONにしてご利用ください。 ポジション数: 最大21ポジション 時間足 :M1 注文条件 ・EA起動後、一定の値動きで逆張りを行います。 ・100BTC/USDごとにナンピンを行います。(ただし証拠金維持率が500%以上のあいだ) ・一定の利益にて全決済を行います。 その他 ・マーチングゲールではありませんが、ナンピンを行うため、ある程度のリスクがございます。 ・証拠金は1000USD以上を推奨しております。
Trading has never been easier. Simplify makes trading effordless. Your only work here is to buy it, attach to the EURUSD on H1 , set your risk and wait for results. Strategy was developed by genetic algorithms and of course tested by advanced  robustness tests  and delivered to you. It is great addon to your portfolio or as standalone strategy. Benefits for you Amazing   Plug & Play system  - studying configuration and finding the best optimization is history. This work is included in the pri
Индикатор предназначен для того, чтобы вовремя закрывать позиции по рынку. Например: досрочно фиксировать прибыль, если цена не достигла TakeProfit, а рынок разворачивается. Индикатор анализирует импульс, а не тренд. О тренде никакой информации он не дает. Индикатор хорошо подходит для поиска дивергенции. Индикатор Ershov 38 Parrots динамически подстраивается под рынок и выявляет импульсы движения цены средней и высокой амплитуды. На мелкие скачки цены почти не реагирует.  Принципиальное о
Fimoku
Michel Henriques
Pode ser usado Fimathe sem Ichimoku                                   "Parâmetros Expert" Magic Number Ativar Negociacao Periodo Hora de Inicio de Abertura de Posicoes Minuto de Inicio de Abertura de Posicoes Hora de Encerramento de Abertura de Posicoes Minuto de Encerramento de Abertura de Posicoes Carregar Indicador no Grafico Ativar Notificacoes                                                   "Ordem" Desvio em Pontos Preenchimento da Ordem Tipo de Ordem Inverter Tipo de Ordem Ordens
The indicator will plot a line on the chart that corresponds to the closing price of the previous day, and based on this, it will plot the percentage levels of change in the price of the asset in question. It can be used on any asset. Period: Determine whether the closing price should be daily, weekly or monthly Minimum percentage: Determine the percentage for the indicator to plot the levels and sub-levels on the chart, eg 0.5 it will plot on the chart a line for every 0.5% variation and the su
EA LivWell
Jayme Roger Alves Vieira
EA LivWell Robot Is Without a Doubt The Best Robot For Forex, B3 And Proprietary Table! OPERATE 100% ON AUTOMATIC! A professional trading robot that performs operations in the financial market without you having to waste time and without having to manage emotional control! RECOMMENDED CAPITAL: You can start from as little as $10 using a Cent account. SETUPS: You will receive several setups already configured and ready for various market styles. STRATEGY SUMMARY The E.A. LivWell oper
Tired of information overload when analyzing forex currency strength? Introducing "All Currency Strength Live", the ultimate dashboard indicator for MetaTrader 5 that simplifies your trading life. This innovative tool provides a clear, concise overview of the strength of all major currencies, empowering you to make informed trading decisions with ease. With "All Currency Strength Live,"  you gain access to real-time insights into both price and volume strength across all major currencies. No mor
Считает время жизни Candle Extra до ее закрытия. Он используется для помощи при вводе операций ... ... Мы работаем при закрытии одноминутных свечей, то есть когда таймер установлен на 00: xx: 01. Мы открываем ордер, и значение этой операции также отображается инструментом. Дополнительно: чтобы «разблокировать» шкалу цен. Дважды щелкните по шкале, и график будет «центрирован по горизонтали». Помимо возможности расширения и сжатия шкалы цен, мы можем перемещаться по графику, перетаскивая
** All Symbols x All Timeframes scan just by pressing scanner button ** *** Contact me after the purchase to send you instructions and add you in "ABCD scanner group" for sharing or seeing experiences with other users. Introduction This indicator scans AB=CD retracement patterns in all charts. The ABCD is the basic foundation for all harmonic patterns and highly repetitive with a high success rate . The ABCD Scanner indicator is a scanner reversal ABCD pattern that helps you identify when the pr
--- StudentK Sync Chart --- 1. Move charts at the same time 2. Cross check among different Symbols and Timeframes 3. Plan your own trading strategies --- Context --- StudentK is not indicated as a master or K Sir for knowledgeable person who claims for winning all the time. (But lots of traders should know the fact that it is rarely truth, especially in fluctuated period of time) StudentK is a group of years-experienced traders who want to share amazing tools in Free and Paid versions. Aimi
Market Ticker Pro MT5
John Louis Fernando Diamante
The only Market Ticker on the market! Add a professional novelty to your workspace, with built in mini-charts A scrolling Market Ticker that displays price changes from all symbols in the Market Watch list. Provides an easy snapshot of symbol prices, and keeps scrolling automatically while you trade and analyse the chart. The ticker color (+/- price changes) are based on either the current or completed candle, and the previous candle. Options include: - MTF, eg choose to show price changes o
The Outside The Box (OTB) is a complete trading system that provides the user with immense trading ability by highlighting on the chart areas where the trader should prepare to Re-enter the trend after pullbacks (Pullback trading strategy) Take partial/complete profit(Profit taking strategy), and Trade breakouts (Stock breakout strategy) - We have updated the indicator to show/hide Micro breakout areas around the major breakouts (Micro Breakouts).  The above is supported by an alert system to no
ToolBox 360 is the swiss knife of all indicators. It is full packed with useful tools to help you with your trading. It can be used to find best entry and exit points and help you to decide if you should open a trade or not. It shows market trends, candlestick formations outside / inside bars and you can sett time based allerts. Main features: Time based Fibonacci lines Choose a start and end time and the indicator shows you Fibonacci lines within the selected time range including range high
3 candel indicator in 1 !!! The 3 most important candel indicator in 1 packadge. Help trader in chart visualisation, prevent reversal !!! Doji : Gravestone Doji, Long Legged Doji, Dragonfly Doji. Engulfing : Bullish, Bearish. Hammer : red hammer, green hammer. Fully parametrable indicator icon color config and alarm. Free life time update !!! Just try our demo for free.
Индикатор Trenders, очень чувствительный к текущей ценовой активности, и достаточно хорошо отображает сигналы. Быстро реагирует на изменение тренда, четко показывает движение цены. Цветная версия индикатора сигнализирует об изменении тренда. Индикатор позволяет увидеть растущий или падающий тренд. Кроме направления тренда индикатор показывает изменение угла наклона, анализ которого позволяет отфильтровать сигналы с помощью фильтров по углу, это можно использовать при построении бота с данным
Propfirm Challenge Helper
Jonatan Esteba Rojas Villegas
Помощник по счету финансирования Этот советник уже прошел 1 фазу испытания MFF (фото и видео доказательства) Начальная цена (предложение на первые 3 месяца) Алгоритм основан на структуре цены и действия, а точнее на разграничении. поддержек и сопротивлений. При предъявлении определенного паттерна в начале сессии NY или JPN с ним, он позиционируется с риском вознаграждения 1: 7 таким образом удается извлечь выгоду из начала тенденции. Особые соображения Проверьте, какой поставщик учетной
С этим продуктом покупают
Прежде всего стоит подчеркнуть, что этот торговый индикатор не перерисовывается, не перерисовывает и не отставает, что делает его идеальным как для ручной, так и для роботизированной торговли. Атомный аналитик - это индикатор ценового действия PA, который использует силу и импульс цены, чтобы найти лучший край на рынке. Оборудованный расширенными фильтрами, которые помогают убирать шумы и ложные сигналы, и повышают торговый потенциал. Используя несколько слоев сложных индикаторов, Атомный анали
Прежде всего стоит подчеркнуть, что эта торговая система является индикатором без перерисовки, без повторной отрисовки и без задержки, что делает ее идеальной как для ручной, так и для роботизированной торговли. «Smart Trend Trading System MT5» - это комплексное торговое решение, созданное для новичков и опытных трейдеров. Он объединяет более 10 премиальных индикаторов и предлагает более 7 надежных торговых стратегий, что делает его универсальным выбором для разнообразных рыночных условий. Стр
FX Volume MT5
Daniel Stein
4.94 (17)
Получайте ежедневную информацию о рынке с подробностями и скриншотами в нашем утреннем брифинге здесь, на mql5 , и в Telegram ! FX Volume - это ПЕРВЫЙ и ЕДИНСТВЕННЫЙ индикатор объема, который дает РЕАЛЬНОЕ представление о настроении рынка с точки зрения брокера. Он дает потрясающее представление о том, как институциональные участники рынка, такие как брокеры, позиционируют себя на рынке Forex, гораздо быстрее, чем отчеты COT. Видеть эту информацию прямо на своем графике - это настоящий геймчей
MetaForecast M5
Vahidreza Heidar Gholami
5 (2)
MetaForecast предсказывает и визуализирует будущее любого рынка на основе гармонии в данных о ценах. Хотя рынок не всегда предсказуем, если существует узнаваемый паттерн в ценах, то MetaForecast способен предсказать будущее с наибольшей точностью. По сравнению с другими аналогичными продуктами, MetaForecast способен генерировать более точные результаты, анализируя тренды на рынке. Входные параметры Past size (Размер прошлых данных) Указывает количество баров, которые MetaForecast использует дл
Этот индикатор является уникальным, качественным и доступным инструментом для торговли, включающим в себя наши собственные разработки и новую формулу. В обновленной версии появилась возможность отображать зоны двух таймфреймов. Это означает, что вам будут доступны зоны не только на старшем ТФ, а сразу с двух таймфреймов - таймфрейма графика и старшего: отображение вложенных зон. Обновление обязательно понравится всем трейдерам, торгующим по зонам спроса и предложения. Важная информация Для мак
Это, пожалуй, самый полный индикатор автоматического распознавания гармонического ценообразования, который вы можете найти для платформы MetaTrader. Он обнаруживает 19 различных паттернов, воспринимает проекции Фибоначчи так же серьезно, как и вы, отображает зону потенциального разворота (PRZ) и находит подходящие уровни стоп-лосс и тейк-профит. [ Руководство по установке | Руководство по обновлению | Устранение неполадок | FAQ | Все продукты ] Он обнаруживает 19 различных гармонических цен
Noize Absorption Index - is the manual trading system that measures the difference of pressure between bears forces and bulls forces. Green line - is a noize free index that showing curent situation. Zero value of index shows totally choppy/flat market.Values above zero level shows how powerfull bullish wave is and values below zero measures bearish forces.Up arrow appears on bearish market when it's ready to reverse, dn arrow appears on weak bullish market, as a result of reverse expectation.
40% СКИДКА НА РОЖДЕСТВО! ПОВЫШЕНИЕ ЦЕНЫ ДО $250 С 1 ЯНВАРЯ! Представляем GoldenGate Entries: Революционное Торговое Решение! Откройте для себя революционный подход к торговле с GoldenGate Entries (GGE), передовым индикатором, разработанным для повышения вашего опыта торговли. GGE предоставляет обширный набор функций, чтобы предоставить пользователям точность и уверенность в их торговых решениях. Пары: Любые (валюты - товары - акции - акции - криптовалюты) Таймфреймы: 15 минут до H1 Ос
Доброго времени суток! Представляю вам торговый технический индикатор для синтетических индексов брокера Deriv. Данный индикатор работает ТОЛЬКО с нижеуказанными индексами: Boom 300 Index Boom 500 Index Boom 1000 Index Crash 300 Index Crash 500 Index Crash 1000 Index Индикатор создан для подачи сигналов на открытие среднесрочных сделок в сторону Спайков. Но вы можете открывать сделки и в противоположную Спайкам сторону, на свой риск. Торговля только на М1. Другие ТФ не гарантируют корректную р
Step into the realm of Forex trading with confidence and precision using XQ, a cutting-edge Forex indicator designed to elevate your trading game to unprecedented heights. Whether you're a seasoned trader or just stepping into the world of currency exchange, XQ Forex Indicator empowers you with the insights and signals needed to make informed trading decisions. The signal conditions are a combination of three indicators, and XQ Forex Indicator only display  medium and long-term trends . The ind
Eng Gold
Ely Alkrar Xshkaky
ENG-GOLD Scalper It is an auxiliary indicator that identifies potential targets and determines the place of entry with a stop loss that works on Heiken Ashi candles  The green lines are usually the targets, the red lines are the stop loss, and the yellow lines are the entry location.  This file is recognized on small and medium frames, usually less than the watch frame I highly recommend using XAUUSD US100 US30 USOIL 
Bill Williams Advanced предназначен для автоматического анализа графика по системе " Profitunity " Билла Уильямса. Индикатор анализирует сразу четыре таймфрейма. Инструкция/Мануал ( Обязательно читайте перед приобретением ) Преимущества 1. Автоматически анализирует график по системе "Profitunity" Билла Уильямса. Найденные сигналы помещает в таблицу в углу экрана. 2. Оснащён трендовым фильтром по индикатору Аллигатор. Большинство сигналов системы рекомендуется использовать только по тренду.
note: this indicator is for METATRADER4, if you want the version for METATRADER5 this is the link:  https://www.mql5.com/it/market/product/108106 TRENDMAESTRO ver 2.4 TRENDMAESTRO recognizes a new TREND in the bud, he never makes mistakes. The certainty of identifying a new TREND is priceless. DESCRIPTION TRENDMAESTRO identifies a new TREND in the bud, this indicator examines the volatility, volumes and momentum to identify the moment in which there is an explosion of one or more of these data a
TPA True Price Action indicator reveals the true price action of the market makers through 100% non-repainting signals strictly at the close of a candle! TPA shows entries and re-entries, every time the bulls are definitely stronger than the bears and vice versa. Not to confuse with red/green candles. The shift of power gets confirmed at the earliest stage and is ONE exit strategy of several. There are available now two free parts of the TPA User Guide for our customers. The first "The Basics"
Профессиональный Инструмент для Скальпинга на Deriv Внимание! Индикатор будет продан в ограниченном количестве!!! Предыщуие 5 копий были проданы по 250$ Следующие 5 копий будут проданы по 350$ Следующая цена 500$ Описание: Этот торговый индикатор предназначен для профессиональных трейдеров, ориентированных на скальпинг. Разработанный с учетом особенностей рынка, он предоставляет высокоточные сигналы для торговли в сторону спайков. Работает на таймфрейме М1 и поддерживает следующие символы:
Индикатор Gann Squares представляет собой мощный инструмент для анализа рынка, основанный на математических концепциях, представленных W.D. Gann в его статье "Математическая формула для прогнозирования рынка." Этот индикатор включает в себя техники Ганна, связанные с квадратными числами, такими как 144, 90 и 52, а также Квадрат 9. Кроме того, он включает метод по использованию Квадрата 9 в сочетании с каналами и паттерном звезды. Руководство пользователя и использование: Перед использованием это
Свинг-трейдинг - это первый индикатор, предназначенный для обнаружения колебаний в направлении тренда и возможных разворотов. Он использует базовый подход свинговой торговли, широко описанный в торговой литературе. Индикатор изучает несколько векторов цен и времени для отслеживания направления совокупного тренда и выявляет ситуации, когда рынок перепродан или перекуплен и готов к исправлению. [ Руководство по установке | Руководство по обновлению | Устранение неполадок | FAQ | Все продукты ]
IVISTscalp5
Vadym Zhukovskyi
5 (3)
Представляем вам индикатор iVISTscalp 5 , который не только уникален, но и эффективен в использовании при анализе торговых операциях. Этот индикатор основывается на временных данных и является результатом многолетнего опыта и глубокого анализа финансовых рынков. Индикатор iVISTscalp 5 отличный помощник для ручной торговли. Удобство, простота и визуализация. Все самое сложное спрятано внутри. Мы максимум упростили настройки и использование индикатора iVISTscalp 5 . Индикатор подходит для всех
Elliot Waves Analyzer Pro calculates Elliot Waves to Help Identify Trend direction and Entry Levels. Mainly for Swing Trading Strategies. Usually one would open a Position in trend direction for Wave 3 or a Correction for Wave C . This Indicator draws Target Levels for the current and next wave. Most important Rules for Elliot Wave Analysis are verified by the Indicator.  The Pro version analyzes Multiple Timeframes and shows the Subwaves and Target-Levels.   For an Overview  " Elliot Waves Anal
SMCpro MT5  Original Price  $440   ---  Currently Price  40% OFF  ( for unlimited use ) Hello World! Introducing.. SMCpro tool and Indicator for  MetaTrader 5 , a cutting-edge feature designed to revolutionize your trading experience. With innovative ICT Smart Money Concept, you gain unparalleled insight into market dynamics, empowering you to make informed trading decisions like never before. Built on the foundation of advanced algorithms and real-time data analysis, SMCpro tool and Indicat
Weis Wave with Alert MT5
Trade The Volume Waves Single Member P.C.
4.93 (15)
Rental/Lifetime Package Options and Privileges  * For optimum results the yearly or lifetime package is suggested due to live training ! Rent Monthly Six Months   Yearly/Lifetime Weis Wave with Speed with Alert+Speed Index x x x Manual  x x x Quick Set up Video x x x Blog x x x Lifetime Updates x x x Setup and Training Material x x Free Rectangle Break Alert Tool      x Discord Access Channel "The SI traders" x 2-hour live methodology training x How to trade with it:    http://
VTrende Pro
Andrii Diachenko
5 (1)
VTrende Pro - МТФ индикатор для трендовой торговли с панелью индикации для МТ5 !!! - Подробное описание на русском языке под видео (на Youtube) - !!! Хотя сигналы индикатора VTrende Pro можно использовать, как сигналы полноценной торговой системы, рекомендуется применять их в связке с ТС Билла Вильямса. VTrende Pro - это расширенная версия индикатора VTrende . Отличие Pro версии от VTrende: - Временные зоны - Сигнал V - сигнал 1-2 волн Основная задача индикатора - определить точки изм
RAD CRITICAL LEVES RAD indicator tracks “Relevant Volume” in real time, identifying accumulation and distribution processes, projecting them in the chart as SUPPORT or RESISTANCE zones. Natural   support   and resistance levels are generated by Volume Accumulation and Distribution processes. As these processes evolve, levels at which the relevant volume in the market place is positioned, become difficult areas to cross upwards or downwards. By using this information, traders can identify very s
Мультивалютный, мультитаймфреймный, индикатор гармонического паттерна AB=CD. Поддерживает отправку push-уведомлений о сигналах на мобильное устройство, сообщений на и-меил, а также, сообщений с помощью алертов, на всех доступных валютных парах и таймфреймах. Данный индикатор был создан на основе индикатора Harmonic ABCD Universal . Версия для MetaTrader 5:  https://www.mql5.com/ru/market/product/44972 . Смотре также: Harmonic ABCD Universal для MetaTrader 4 . Использование современных методов ра
«Пиранья» - автономная торговая система, определяющая уровни перекупленности и перепроданности на графике. Красная и синяя зоны отображают уровни перекупленности и перепроданности соответственно. Вход в сделку обозначен стрелками: стрелка вниз в красной зоне для "sell" и стрелка вверх в синей зоне для "buy". Уровень Тейк профита обозначен зеленой средней скользящей. Важные особенности: Регулировка уровня Тейк профита при изменении положения зеленой средней скользящей. Возможность усреднения пр
[ MT4 Version ] Backtesting Simulator Are you tired of spending months on demo or live accounts to test your trading strategies? The Backtesting Simulator is the ultimate tool designed to elevate your backtesting experience to new heights. Utilizing Metatrader historical symbol information, it offers an unparalleled simulation of real market conditions. Take control of your testing speed, test ideas quickly or at a slower pace, and witness remarkable improvements in your testing performance.
Сложно найти и дефицит по частоте, дивергенции являются одним из самых надежных торговых сценариев. Этот индикатор автоматически находит и сканирует регулярные и скрытые расхождения, используя ваш любимый осциллятор. [ Руководство по установке | Руководство по обновлению | Устранение неполадок | FAQ | Все продукты ] Легко торговать Находит регулярные и скрытые расхождения Поддерживает много известных генераторов Реализует торговые сигналы на основе прорывов Отображает подходящие уровни ст
Introduction to X3 Chart Pattern Scanner X3 Cherart Pattern Scanner is the non-repainting and non-lagging indicator detecting X3 chart patterns including Harmonic pattern, Elliott Wave pattern, X3 patterns, and Japanese Candlestick patterns. Historical patterns match with signal patterns. Hence, you can readily develop the solid trading strategy in your chart. More importantly, this superb pattern scanner can detect the optimal pattern of its kind. In addition, you can switch on and off individu
Этот индикатор представляет собой метод анализа рынка, основанный на статье «Математическая формула для прогнозов рынка», написанной У.Д. Ганном, в зависимости от метода квадрата девяти и квадрата 144. Руководство пользователя: Add Your review And contact us to get it Вы можете купить полную версию MT4 у: https://www.mql5.com/en/market/product/15316 Вы можете бесплатно протестировать на МТ4: https://www.mql5.com/en/market/product/15320?source=Site +Profile+Seller#!tab=reviews
Этот индикатор представляет собой идеальный индикатор волнового автоматического анализа для практической торговли! Стандартизированное определение диапазона больше не является волной для разных людей, и рисунок антропогенных помех устранен, что играет ключевую роль в строгом анализе подхода. =》Increase the choice of international style mode, (red fall green rise style)           На данный момент при покупке со скидкой!   Содержание индекса: 1.       Базовая волна:   Сначала мы нашли точ
Другие продукты этого автора
AMA Crossover
Saullo De Oliveira Pacheco
This EA Works Based On Crossing Two AMA's "Adaptive Moving Average", when the fast AMA is above the slow AMA the robot makes buys and sells on the contrary. Robot has Possibility to use Martingale and average price, average price and unique operations. follow me on my social medias: instagram, facebook and youtube: @saullo_algotrader Thank you, Have good trades.
This is the famous Sunflower indicator for Metatrader5. This indicator marks possible tops and bottoms on price charts. The indicator identifies tops and bottoms in the asset's price history, keep in mind that the current sunflower of the last candle repaints, as it is not possible to identify a top until the market reverses and it is also not possible to identify a bottom without the market stop falling and start rising. If you are looking for a professional programmer for Metatrader5, please
Get Economic Calendar History Script is an economic calendar data downloader. The time of the Economic Calendar is based on your broker's time, so if you are going to use the same calendar history file on different brokers, make sure their times are the same. The economic calendar history is organized as follows: Time: Date and time of the news. Importance: Degree of Possible impact of the news on the market. Currency: Currency. Country: Country. Description: Description of the news.
Фильтр:
Нет отзывов
Ответ на отзыв