Смотри обучающее видео по маркету на YouTube
Как купить торгового робота или индикатор
Запусти робота на
виртуальном хостинге
виртуальном хостинге
Протестируй индикатор/робота перед покупкой
Хочешь зарабатывать в Маркете?
Как подать продукт, чтобы его покупали
Платные торговые роботы и индикаторы для MetaTrader 5 - 28

MACD is probably one of the most popular technical indicators out there. When the market is trending, it actually does a pretty good job, but when the market starts consolidating and moving sideways, the MACD performs not so well. SX Impulse MACD for MT4 is available here . Impulse MACD is a modified version of MACD that works very well for trading Forex, stocks, and cryptocurrencies. It has its own unique feature which perfectly filters out the values in a moving average range and enables it

Offer 249 down from 350 for the next 1 copies. then back to 350 $
Are you tired of using outdated indicators that leave you guessing where to set your profit targets? Look no further than the AK CAP Opening Range Breakout Indicator. This powerful tool is backed by a US patent and has already helped countless traders pass funded challenges like FTMO. We use it daily on our prop traders and internal funds, and now it's available to you as well. The calculation behind the indicator is incredibly
A MUST HAVE - NON REPAINT INDICATOR - that will help you to make the decision whether to Buy or Sell , including where to set the Take Profit and Stop Loss . The Buy/Sell signal will not redraw nor repaint until the next new signal occurs. The Take Profit and Stop Loss will change following the market conditions. Our indicator will give alert to your mobile/handphone when new buy/sell signal arrive. For best result, combine this indicator with your knowledge on price action and support & resista

Presenting the uGenesys Break of Structure and Change of Character Indicator The uGenesys Market Structure Indicator is the advanced solution designed specifically for forex traders seeking a competitive edge. This innovative tool goes beyond merely identifying Break of Structure (BoS) and Change of Character (CHoC); it also illuminates optimal entry and exit points on your forex charts, transforming your trading experience.
While the uGenesys Market Structure Indicator can reveal pivotal pa

Rayert - утилита, позволяющая расставлять уведомления на необходимых уровнях. Уведомления происходят как в самом терминале, так и на мобильныйх устройствах путем Push уведомлений. Варианты использования Разметка ликвидности на графике и реагирование при сборе ликвидности. Устанвока уведомлений на уровнях приняти решений. Настройка Можно указать различные цвета линий выше и ниже свечи, до пересечения ценой и после пересечения соответственно. Рисование линий на переднем или заднем фоне. Примагничи
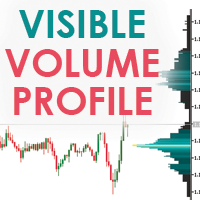
Visible Market Profile graphically represents the amount of trades made on each price level. This indicator in particular, unlike the daily market profile , is calculated on the visible area of the chart.
Visible Market Profile cannot be considered an indicator of operational signals, but it can be a good support for reading the market, in addition to what is already used by every trader in his work process. The Visible Market Profile is able to determine with a good approximation the pric
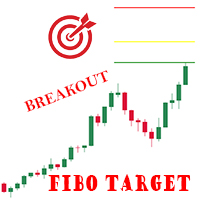
Indicator shows 3 Fibonacci expansion levels, based on the last pivot breakout. Pivots are calculated based on volatility (ATR), works on every Timeframe and Symbol. Lines are displayed only after the pivot breakout. A comment on the upper left side shows the minimum calculated value (in points) for pivots. Parameters: Variation: minimum variation for the pivot. ATR multiplication factor. (default 3) ATR Period: Period for ATR value calculations. (default 60)
Ex.: ATR on TimeFrame H1 = 100po

Этот индикатор определяет краткосрочный и долгосрочный тренд. Анализ основан на выбраном таймфрейме. Индикатор показывает точки открытия сделок на продажу или покупку, а также указывает направление тренда на: Краткосрочном периоде Долгосрочном периоде Этот индикатор не только сигнализирует о немедленной покупке или продаже. Он указывает краткосрочный и долгосрочный тренд. Индикатор позволяет вам подробнее изучить реальный и исторический рыночный тренды!

Любой финансовый инструмент, торгуемый на рынке, - это отношение определенного актива к какой-либо валюте. Форекс отличается от других рынков только тем, что в качестве актива используется другая валюта. В результате на Форексе мы всегда имеем дело с отношением одной валюты к другой, называем валютной парой.
Проект, начатый более года назад, помог разработать группу индикаторов под общим названием кластерные индикаторы. Их задача состоит в том, чтобы из валютных пар вычленить отдельные валюты.

Мультитаймфреймовая версия классического индикатора Parabolic SAR (от "Stop and Reverse" - стоп и разворот ). Индикатор PSAR следует за трендом. Как только нисходящий тренд разворачивается вверх, PSAR следует за ценой, как трейлинг-стоп. Вы можете выбрать PSAR для отображения на графике. PSAR отображается только на основе текущего или старшего таймфреймов. Входные параметры: bM15 - PSAR от M15 bM30 - PSAR от M30 bH1 - PSAR от H1 bH4 - PSAR от H4 bD1 - PSAR от D1 bW1 - PSAR от W1 bMN1 - PSAR от M

Мультитаймфреймный индикатор Relative Strength Index отображающий информацию одновременно с разных периодов в одном подокне графика.
Параметры Period of averaging — период усреднения. Type of price — тип цены для расчета RSI. Timeframes for RSI— перечень периодов, через пробел или запятую или точку с запятой. Number of bars for each period — количество отображаемых баров для каждого периода. Sort periods — сортировать периоды если они указаны в перемешку. Current period first — отображать теку

Индикатор предоставляет замену реальным торговым объемам, построенную на основе тиковых объемов. Он рассчитывает по специальной формуле близкую к реальности оценку распределения торговых объемов, что может пригодиться для инструментов, для которых доступны только тиковые объемы. Обратите внимание, что абсолютные значения индикатора не соответствуют никаким данным о реальных объемах, но само распределение, включая общую форму и поведение, повторяет общую форму и поведение реальных объемов связанн

Стохастический осциллятор отображающий информацию одновременно с разных периодов в одном подокне графика.
Параметры %K Period — K-период (количество баров для расчетов). %D Period — D-период (период первичного сглаживания). Slowing — окончательное сглаживание. Method — тип сглаживания. Price field — способ расчета стохастика. Timeframes for Stochastic — перечень периодов, через пробел или запятую или точку с запятой. Number of bars for each period — количество отображаемых баров для каждого пе

Higher Timeframe Chart Overlay will display higher timeframe candles, including the number of candles high/low you specify.
You no longer need to switch timeframes to check the candles. Everything can be shown in one chart. MT4 Version : https://www.mql5.com/en/market/product/115680 Almost everything can be change as you want. You can change/set:
- Choose different colors for the body and top/bottom wicks.
- Panel's height and width.
- The width of the body and wicks
- Change backgrou

Индикатор осуществляет поиск и маркировку на графике торговых сигналов "Пятое измерение". Подробное описание графических моделей, формирующих торговые сигналы можно прочитать в главе 8 "Торговля с помощью линии баланса" книги Б. Вильямса "Новые измерения в биржевой торговле". Сигнальные уровни с указанием цены на вход в позицию или установку стоп-лосса, указываются непосредственно на графике. Эта функция создает дополнительные удобства трейдеру в момент выставления отложенных ордеров. Сплошная

This is a utility that helps you close market orders and pending orders (optional), using keyboard shortcuts. For me, it's more convenient and faster than clicking a button on the chart. You can set: Keyboard Shortcut Hotkey: You can change and use most of the keys on the keyboard.
Key combination (Ctrl, Shift) also available in case you want to use
(Note that not all combinations work). Magic Number Symbol: All Symbol, or Current Chart Symbol, or Select Symbol List Close Pending or

EA scalp Hedge is trading on trend reverse if open on loss site it will hedge opposite to recover loss until win and close all positions to rebalance. There are 2 mode to hedge single and double both of this is the same just working on different market direction, Last hope you all MM your capital carefully. Robot features: Lot = Starting Lot sizes when start robot. Lot_Martingale = Lot multiply when hedging on loss site. HEDGE_TYPE = type to hedging single or double. Hedge_Distance = Distance t

PROTECT YOUR FTMO Account in a simplest way Must-Have Account Protector for any Prop-trading Account and Challenge MT4 / MT5 Expert Advisor that protects your Forex Prop Trading account from an unexpected drawdown! FTMO Protector is a Tool that lets you manage trades and control your profit and loss across multiple Robots and currency pairs using a simple parameters and settings. Use as many EAs and Instruments you need, the Protector will: 1. Calculate your midnight (01:00 System time) Balan
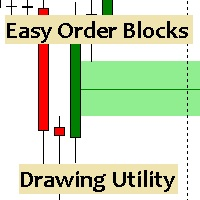
Esta utilidad dibuja Order Blocks y otros bloques fácilmente mediante el trazado rápido de lineas y rectángulos con 1 click y 1 tecla. Las teclas Hotkeys son programables y son 5: Order Blocks Fair Value Gaps (o Liquidity Void) Rejection Blocks Mitigation/Breaker Blocks Fast Object Delete (Borrado Rápido de objetos) Las 4 teclas de dibujo toman las coordenadas de la barra donde se clickeo y trazan 1 linea horizontal y 1 rectángulo delimitando la zona de OTE (Optimal Trade Entry). Automáticamente

Tax Buddy creates a simple, sortable trading report which you can send to your local tax authorities alongside your annual declaration. I've been using this kind of report for the German Finanzamt in order to declare my capital gains ("Kapitalerträge") in a readily comprehensible manner. For testing purposes, the Demo version places random trades in the Strategy Tester on the symbol of your choice and creates a demo report for them.
Conveniently, all reports are stored in the common path for a

*This is trading view indicator converted in mql5*
The HA Market Bias Indicator is a popular tool used in trading and technical analysis, designed to help traders identify market bias and potential trend reversals. It is commonly used in conjunction with candlestick charts and provides valuable insights into market sentiment. The indicator is based on the Heiken Ashi (HA) candlestick charting technique, which aims to filter out market noise and provide a smoother representation of price actio

Торгуйте на Bybit с помощью советников и индикаторов MT5/MT4! GRat_BybitImport — это инструмент для автоматической торговли ЛЮБЫМИ имеющимися советниками и индикаторами, ЛЮБОЙ криптовалютой на одной из самых популярных криптобирж Bybit в режиме 24/7. Возможности 1. Доступны ВСЕ инструменты Bybit. 2. Им порт( автоматическое копирование) на заданную криптовалюту Bybit всех сделок (совершенных вручную или ЛЮБЫМ советником) со счета MT5 (в том числе и демо) по заданному символу и/или магическо

The GGP Chandelier Exit Alert MT5 Indicator is a volatility-based indicator that identifies stop loss exit points for long and short trading positions. Chandelier Exit is based on the Average True Range (ATR) indicator. It is designed to keep traders in the trend until a defined trend reversal happens. Traders use CE to maximize their returns in a trade and make stop loss exit decisions. It is based on the principle that a trend reversal is highly probable when the price of an asset moves agains

The double top bottom pattern is arguably one of the technical analysis's most popular chart patterns. These patterns are used to capitalize on recurring patterns and identify trend reversal patterns, thereby creating well-placed entry and exit levels. The KT Double Top Bottom is based on these patterns and fine-tunes the trade signal development process for traders.
Features
It's based on one of the most reliable trading patterns and brings some fine-tuning and automation to the process. A
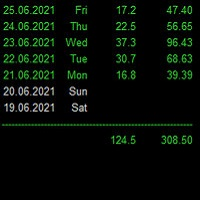
Statistics for each day
Индикатор показывает статистику - итоговую конечную прибыль/убыток по каждому отдельному торговому дню с учетом свопов и комиссий. Параметры : Dey - количество анализируемых дней; Weekday color - цвет будних дней; Weekend color - цвет выходных дней; Loss color - цвет убытка; font_size - размер шрифта; font_face - название шрифта; Для удобства просмотра статистики за большие временные периоды, при инициализации индикатор выгружает данные в Statistics.csv
Созданный файл и

I am placing the indicator obtained as a result of market analysis, it may be useful to someone. The indicator shows how quickly the price changes (where there is a trend), and where there is no obvious trend. With the right settings, you can know the beginning of the trend in advance.
The indicator measures the slope / rate of change / ratio of the moving average on the current bar relative to the previous bar.
The settings specify the ratio limit for a downtrend and a ratio limit for an u

Усовершенствованная Мультитаймфреймовая версия скользящей средней Хала (Hull Moving Average - HMA). Особенности
Две линии индикатора Халла разных таймфреймов на одном графике. Линия HMA старшего таймфрейма определяет тренд, а линия HMA текущего таймфрейма - краткосрочные ценовые движения. Графическая панель с данными индикатора HMA на всех таймфреймах одновременно. Если на каком-либо таймфрейме HMA переключил свое направление, на панели отображается вопросительный или восклицательный знак с тек
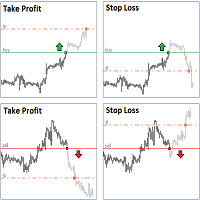
StopLoss and TakeProfit Utility MT5 for automatic setting of stop loss and take profit levels. Created by a professional trader for traders. The utility works with any market orders opened by a trader manually or using advisors. Can filter trades by magic number. The utility can work with any number of orders simultaneously.
WHAT THE UTILITY CAN DO: Set virtual stop loss and take profit from 1 pip Real stop loss and take profit W ork with each order separately ( stop loss and take pr

Trend Scanner - это трендовый индикатор, помогающий определить текущее и прогнозируемое направление рынка с помощью продвинутого алгоритма. Благодаря гибким настройкам оповещения, индикатор своевременно предупредит вас о развороте тренда. Индикатор интуитивно понятен и прост в использовании, и станет отличным фильтром в ваших трендовых торговых стратегиях. Линии данного индикатора, так же являются отличным динамическим уровнем для стоп-лосса, и применяется как один из видов трейлинг-стопа в Торг
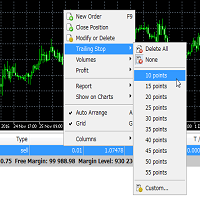
Trailing Stop Utility MT5 for automatic closing of deals by trailing stop levels. Allows you to take the maximum from the profit. Created by a professional trader for traders. Utility works with any market orders opened manually by a trader or using advisors. Can filter trades by magic number. The utility can work with any number of orders simultaneously.
WHAT THE UTILITY CAN DO: Set virtual trailing stop levels from 1 pip Set real trailing stop levels W ork with each order separ

Gold Master EA is an Expert Advisor (EA) purposefully designed for trading the most sought-after precious metal, gold. It stands out by avoiding risky trading strategies such as martingales, grid strategies, or hedging. Instead, it relies on simple and effective strategies, eliminating unnecessary complications. Gold Master EA is not designed to promise impressive gains overnight. On the contrary, it targets traders seeking low drawdown and long-term profit stability. This cautious approach favo

Moving Average Distance Indicator
The “Moving Average Distance Indicator” calculates the difference between the instrument's price and the moving average of your choice, showing this difference in percentage values or in price. In other words, it indicates how far the price is from the moving average.
What is it for?
The great advantage of this indicator is the ease to compare movement expansions that occurred in the past, at different price levels, as the indicator works in a levell

Introducing the Order Block Indicator , the pinnacle of trading technology. Order blocks, the large cluster of buy or sell orders placed by institutional traders, significantly influence market direction. They form at critical price levels and can act as robust support and resistance zones. Our cutting-edge indicator allows you to harness the full potential of these influential market dynamics, providing a never-before-seen level of precision and customization. Here's why this tool stands apart:

Compare Symbols Specifications - это индикатор-утилита представляющий собой сводную интерактивную таблицу по анализируемым параметрам. Торговые условия на рынке постоянно меняются и отслеживать эти изменения трудоёмкая задача.
Данный инструмент позволяет в считанные секунды сравнить торговые условия всех символов, и выбрать для торговли те символы, которые отвечают требованиям торговой системы.
Этот инструмент будет полезен всем трейдерам и поможет владеть актуальной информацией о торговых
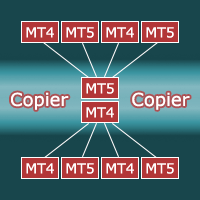
Копировщик для терминала MetaTrader5. Предназначен для копирования торговли с одного терминала на другой. Работает как на неттинговых счетах, так и на хеджинговых. Причем копирование с неттингового счета может выполняться одновременно и на неттинговые счета, и на хеджинговые. Так же и с хеджингового счета копирование может выполняться одновременно и на неттинговые счета, и на хеджинговые. Совместим с версией для терминала MetaTrader4; при ее наличие, копирование можно выполнять между различными

Indicator introduction: A channel and trend line indicator, which is a good tool for manual trading, and also can be used for creating new EAs, without drifting or repainting. It applies to any timeframes and any symbols. The work of the indicator is shown in the screenshots. For any novice and programming trading friend, you can write the signal into the EA to play freely, buffer 0 corresponds to the bold trend line, buffer 4 and 5 respectively corresponds to the channel's upper and lower f

Индикатор строит графики зафиксированной на момент закрытия свечи прибыли для закрытых (или частично закрытых) длинных и коротких позиции отдельно. Индикатор позволяет фильтровать сделки по текущему символу, заданному ID эксперта (магическому числу) и наличию (отсутствию) подстроки в комментарии к сделке, задавать начальное время и периодичность сброса прибыли (ежедневно, еженедельно или ежемесячно) для расчёта графика прибыли. Индикатор также отображает плавающую (не зафиксированную) прибыль от

Индикатор показывает на графике свечную модель "Три белых солдата Три черных вороны". Три белых солдата раскрашиваются в синий цвет. Три черных вороны раскрашиваются в красный цвет. Входные параметры: Max Bars - количество баров рассчитанное на графике. Make Signal Alert - использовать алерт. Type of pattern rules - использовать строгую модель определения паттерна (для трех солдат короткие нижние тени, для трех ворон короткие верхние тени), либо упрощенную модель определения паттерна. Max Shadow

Your search for a perfectly simple ICT Killzone indicator for MT5 is now over because here it is. If you trade ICT concepts, then you know what ICT Killzones are. ICT Killzones (by default is adjusted to EST New York Time, no recalibrating to your timezone needed. Just load it onto your chart and you're good to go): Asian Open Killzone (06:00PM - 12:00AM EST New York Time) London Open Killzone (02:00AM - 05:00AM EST New York Time ) New York Open Killzone (07:00AM - 9:00AM EST New York Time )
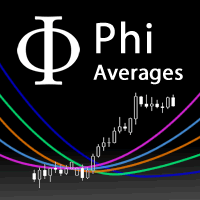
A fan of special weighted moving averages, able to predict tendency reversal and give references about price movements during consolidation and drawbacks. This special moving average is based on Phi fractals and is not available on others indicators. Reproduce this method with another kind of average will not have the same results. The fan has the following averages: 17: Purple 34: Blue 72: Orange 144: Green Blue 305: Dark Blue 610: Grey How to use the fan to analyze price behaviour: If the pric

Enhance Your Trading with Buraq Bars Indicator! Take your trading to the next level with Buraq Bars ! This easy-to-use indicator draws bars on your chart whenever the RSI (Relative Strength Index) crosses above or below the levels you choose, giving you clear signals to help you trade better. Key Features: Set Your Own RSI Levels: Choose the levels for overbought and oversold that work best for you. Clear Visual Signals: Bars appear on your chart when the RSI crosses your levels, making it easy

Imbalance / FVG MTF Mark Imbalance on chart of Selected Multi Time frames. Trend is Manually set to filter signals in the chosen direction by a button on the chart. .
Futures Auto Mark Imbalance / FVG on chart on selected time frames
Select time frames by buttons on chart
Popup Alert, Push Notification or email when New Imbalance Form
Popup Alert, Push Notification or email when Imbalance is Taken out
Select Alert Mode to be a single or multiple Imbalance ( OR / AND option ) when Imbalan
Any MA
Any Moving Average draws a moving average of * any indicator in a sub-window. Many Indicators included with MT5 are supported by default. You can add custom indicators as well. Settings Name Description Timeframe Select timeframe for calculation Source Indicator Select Indicator Custom Indicator Name Enter Custom Indicator Name ( when Source Indicator is set to Custom) Indicator Settings Source Indicator parameters ( separated by comma ) Moving Average Settings Moving Average pa

The Investment castle II ea trading robot has a variety of features, including: The ability to remember open positions, their take profit and stop loss levels if the VPS or terminal is restarted. The ability to remember trade buttons and their setup if the VPS or terminal is restarted. The ability to plot profit/loss on a chart, but only when the user runs the visualizer and on live charts. It automatically disables this feature when backtesting or optimizing settings for improved speed and perf

KT Know Sure thing is a momentum oscillator based on the smoothed rate of change over four different timescales and was developed by Martin Pring. In 1992, Pring published the initial description of the indicator in Stocks & Commodities magazine's "Summed Rate of Change (KST)" article. KST creates a momentum oscillator by combining the price momentum measurements from four different price cycles. Traders can utilize KST to search for bullish or bearish divergences, signal line crossovers, and ce

This utilities can constantly monitors and handle the equity/ balance account to prevent drawdowns and protect your account. This Utilities can handle manually order and automatically order by other Expert Advisors. If the conditions are reached, the open position will be close/ all close (depending your setting).
How to use :
attach this utilities on new chart (same pair) you need to handle make sure magic number is same with other EA you need to handle entry magic number '0' if you need h

The KT 4 Time Frame Trend is an invaluable forex indicator for traders seeking to identify the trend direction across 4-time frames accurately. This innovative indicator allows users to simultaneously observe and analyze price trends across four different timeframes. Whether you're a beginner or an experienced trader, this tool offers an enhanced understanding of trend dynamics, leading to improved trading strategies on your trading platform. The capability to concurrently monitor multiple timef
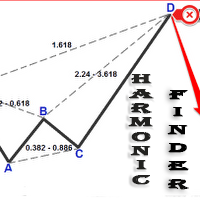
Automatically finding harmonic patterns has been made easy for traders. For those who do not know harmonic patterns : it is a method of technical analysis based on Fibonacci ratios in the markets and patterns made of these. Kind of like patterns such as triangles and double tops, but with precise measurements which makes computerized measuring tools especially appealing for trading these patterns. Some highlights from this Indicator include: Efforts to reduce the amount of screen clutter thro

An indicator to draw a graph of account current and historical state such as Balance, Equity, Margin, Free Margin, Margin Level, Drawdown, Account Profit, Deposit and Withdrawals.
Indicator Inputs : Draw Balance Graph Draw Equity Graph Draw Margin Graph Draw Free Margin Graph Draw Margin Level Graph Draw Drawdown Graph Draw Account Profit Graph Hide Data on Chart and Buffers Connect Gaps by Lines Sign of DDs on Profit Sign of DDs on Loss
Tips : The Indicator will draw historical balance gra
Автоматический расчёт лота на уровень StopLoss: считает лот с учётом риска %. Нужно ввести процент от депозита и установить линию на уровень планируемого StopLoss. В результате будет посчитан лот для входа. Также будет посчитан уровень TakeProfit с учётом коэффициента прибыль/убыток, и их профит/убыток в валюте депозита. Таким образом сразу виден конечный результат сделки, что является неотъемлемой частью успешной торговли. Возможности Индикатор показывает количество позиций, суммарный объём и п

I'm excited to introduce you to the fifth bar on Martin Armstrong's Forecast Array - The Trading Cycle .
This innovative tool represents a transverse form of cyclical frequency analysis, offering a unique perspective on market trends.
The model employs a color-coded system for easy interpretation. In this model, green signals the ideal timing for highs, red indicates ideal lows, and yellow signifies a convergence of highs and lows occurring simultaneously. This intuitive approach allows

10 COPIES OUT OF 10 LEFT AT $70 ---> NEXT PRICE $140 PLEASE READ ALL THE DESCRIPTION BEFORE USE IT LL Tetra EA is an expert advisor based on 4 different strategies , designed and optimized to work on EURUSD, GOLD (XAUUSD) and high volatility pairs (like GBPJPY) . The core strategy of the EA has been studied and applied for years, based on price action it could be applied on different timeframes with the appropriate modifications. Thus was born the idea of programming an algorithm that would
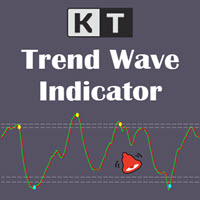
KT Trend Wave is an oscillator based on the combination of Price, Exponential, and Simple moving averages. It usually works great to catch the short term price reversals during the ongoing trending market. The bullish and bearish crossovers of the main and signal lines can be used as buy/sell signals (blue and yellow dot). It can also be used to find the overbought and oversold market. The buy and sell signals that appear within the overbought and oversold region are usually stronger.
Feature
The KT Risk Management Indicator provides a comprehensive overview of the profit/loss and risk management characteristics of your Metatrader account, offering valuable insights and information. It efficiently categorizes the displayed information at account and symbol levels, ensuring a clear and organized presentation of crucial data. Risk is inherent when trading the Forex market - a reality that seasoned traders acknowledge and beginners quickly realize. To succeed in this volatile market, t

Classic RSL This is the classic indicator "Relative Strength Levy" (RSL), according to Dr. Robert Levy's study, called "The Relative Strength Concept of Common Stock Pricing", which was released as a hardcover book in late 60's of the last century.
Key concept Use this indicator on various instruments to compare their relative strength: The resulting analysis values will fluctuate around 1 The strongest instruments will have the highest RSL values (above 1) and the weakest instruments

This Currency Meter Calculates Strength Using a currency basket of 28 pairs? This Currency Meter uses a basket of 28 currency pair to define strength. This is very important because it gives an wholesome view of the strength of a currency by considering its reaction to all major currencies paired with it.
This Currency Meter is Multi-timeframe!!! Majority of the currency strength indicators around the market today only has a single time frame view. Even with the so called multi-timeframe versi

50% off. Original price: $60 Triangle Finder is a multi symbol multi timeframe dashboard that finds symmetrical triangle pattern in 28 symbols and 9 timeframes with a deep scan feature to scan all market watch symbols (up to 1000 instruments!).
Download Demo here (Scans only M1, M5 and M10) Settings description here MT4 version here
Triangle Finder features: Realtime monitoring of 28 customizable instruments and 9 timeframes at the same time. Deep scan mode to scan all market watch sym

Dear users, January will be the last month that I will keep LL Gold Miner EA for sale at the price of $45 . From next month I will update the prices bringing the lifetime license to $250 , in order to guarantee the exclusivity of the strategy . However I will unlock the ability to rent the EA for 1/3/12 months while keeping the prices reasonably lower. So this really is your last chance to secure your lifetime copy of this fantastic strategy at this price . Don't miss the opportunity. Thank you

Уникальный индикатор IceFX VelocityMeter Mini для платформы MetaTrader 4 измеряет скорость рынка форекс . Это не обычный индикатор объемов или других величин. IceFX VelocityMeter Mini способен понять скорость скрытых в тиках движений рынка, а эта ценная информация не доступна в обычных свечах, поэтому не может быть получена простым индикатором. Этот индикатор контролирует приход тиков (частоту и величину изменения) в пределах указанного диапазона времени, анализирует эти данные, определяет, запи

Swing Points are those places on the chart where price changes direction. This is an MT5 version of my MT4 Swing Points Indicator. Found on the code base at https://www.mql5.com/en/code/15616 and in the market at https://www.mql5.com/en/market/product/22918
The beginning input parameters allow you to configure your alerts. Turn on screen alerts allows you to turn on and off screen alerts. True is on, false is off. Turn on push to phone alerts allows you to turn on and off push to phone ale

Fair Value Gap (FVG) Indicator: Master the ICT Method in Forex Trading
What Traders Are Saying: " Transformed my trading approach with its precise gap spotting ..." – J. Doe " The alert feature is a lifesaver, never miss a trading opportunity.. ." – Alex P. " A crucial tool for anyone following the ICT methodologies in Forex. .." – Samantha R. Unlock the secrets of price movement in the Forex market with the revolutionary Fair Value Gap (FVG) Indicator. Designed for precision and ease of use,

Скрипт создает в отдельном окне краткий торговый отчет. Отчет можно создавать как для всех совершенных сделок, так и для сделок по отдельным финансовым инструментам. Есть возможность задавать временной интервал расчета, записать отчет в htm-файл.
Входные параметры скрипта report starting date - начальная дата составления отчета. report end date - конечная дата составления отчета. symbols selection for report - вариант выбора инструмента составления отчета. allSymbol - отчет составляется для сд

This indicator can be considered as a trading system. It offers a different view to see the currency pair: full timeless indicator, can be used for manual trading or for automatized trading with some expert advisor. When the price reaches a threshold a new block is created according to the set mode. The indicator beside the Renko bars, shows also 3 moving averages.
Features renko mode median renko custom median renko 3 moving averages wicks datetime indicator for each block custom notificatio

Новый уникальный индикатор Actual tick footprint (volume chart) разработан для использования на фьючерсных рынках и позволяет увидеть объемы реальных сделок в тот момент, когда они совершаются. Индикатор Actual tick footprint (volume chart) представляет собой значительно улучшенный тиковый график, который дополняется информацией о фактическом объеме совершенных сделок по определенной цене. Кроме того, этот уникальный для MetaTrader 5 индикатор, позволяет надежно распознавать вид сделки – продажа

This indicator accurately identifies and informs market reversals and continuation patterns by analyzing and signaling the Three White Soldiers / Three Black Crows pattern. It also offers a "real-time backtesting" panel in the indicator itself in a way that every change made on the indicator parameters will immediately show the user how many signals are occurred, how many take profits and stop losses were hit and, by having these informations, the Win Rate and the Profit Factor of the setup bas

Click here to see my best trading robot: Prosperity MT5 !
Prosperity MT4 version
Some EAs we use are great, but sometimes they don't have built-in drawdown limiters internally that just affect the EA. Other DD limiters operate on the whole account, this one is designed specifically so one EA (designated by the magic numbers it uses) can be monitored and closed off if it reaches a certain DD limit.
1. Find the magic numbers the EA uses . Normally (including for martingale / grid EAs) the
Reverse TradeCopier for Followers can copy trades from an account that is running Reverse TradeCopier Source . Features: Copies trades from one source (master) account to multiple following (slave) accounts. Allows investor (read only) password for source (master) account. There are no complicated settings and input parameters, everything is easy. Works with different brokers. Works with different quotes symbols (EURUSD_FX, eurusd_m, etc.). Can copy orders from 4-digit quotes platform to 5-dig
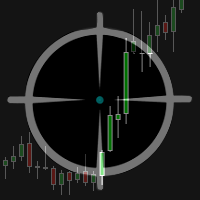
The Multicharts Crosshair draws a cross hair in any linked chart. The indicator can be used for comparison of symbol price levels in different time frame or to compare candles of different instruments in the same time frame
How it works: It can works from every linked charts where the indicator is installed towards the others or from the chart where is istalled towards the following linked charts . It can be shown just pressing a the key of keyboard. After installing the indicators in the cha

The Crash and Boom VT indicator is a highly adaptable trading tool designed to operate across a wide range of market conditions, including Crash 300, Crash 500, Crash 1000, Boom 300, Boom 500, and Boom 1000. Engineered to blend Oversold (OS), Overbought (OB), and Macho periods, this advanced indicator generates reliable trading signals, especially when used on a 5-minute timeframe. For the best outcomes, it's recommended to set the Macho period between 4-5. While the indicator offers robust capa

The Volume Heatmap indicator visually shows the INTENSITY of the volume taking into account the concept of standard deviation. Purpose of the Indicator: High volumes are common where there is a strong consensus that prices will increase. An increase in volume often occurs at the beginning of a new upward trend in the price of an asset. Some technical analysts do not rely on trend confirmations without a significant increase in volume. Low volumes usually occur when an asset is heading for a down
MetaTrader Маркет - лучшее место для продажи торговых роботов и технических индикаторов.
Вам необходимо только написать востребованную программу для платформы MetaTrader, красиво оформить и добавить хорошее описание. Мы поможем вам опубликовать продукт в сервисе Маркет, где его могут купить миллионы пользователей MetaTrader. Так что занимайтесь только непосредственно своим делом - пишите программы для автотрейдинга.
Вы упускаете торговые возможности:
- Бесплатные приложения для трейдинга
- 8 000+ сигналов для копирования
- Экономические новости для анализа финансовых рынков
Регистрация
Вход
Если у вас нет учетной записи, зарегистрируйтесь
Для авторизации и пользования сайтом MQL5.com необходимо разрешить использование файлов Сookie.
Пожалуйста, включите в вашем браузере данную настройку, иначе вы не сможете авторизоваться.