Смотри обучающее видео по маркету на YouTube
Как купить торгового робота или индикатор
Запусти робота на
виртуальном хостинге
виртуальном хостинге
Протестируй индикатор/робота перед покупкой
Хочешь зарабатывать в Маркете?
Как подать продукт, чтобы его покупали
Платные технические индикаторы для MetaTrader 5 - 4

MACD Scanner provides the multi symbols and multi-timeframes of MACD signals. It is useful for trader to find the trading idea quickly and easily. User-friendly, visually clean, colorful, and readable. Dynamic dashboard display that can be adjusted thru the external input settings. Total Timeframes and Total symbols as well as the desired total rows/panel, so it can maximize the efficiency of using the chart space. The Highlight Stars on the certain matrix boxes line based on the selected Scan M
RSI Traffic Light Indicator tracks several RSI ( Relativ Streng Index) Periods and informs you, if the trend is changing. Trend is you friend, one of the classical Trend following is the Relativ Streng Index (RSI). With RSI Traffic Light Indicator you will get information about trendchange. The RSI Traffic Light Indicator alerts you if the trend is changing for your pair. Different trendchange criterials and visualisation themes inclusive. Your can adjust the indicator Trendchange criterials by
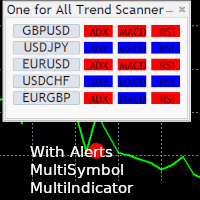
One for All Trend Scanner is a trend following multi-symbol indicator that can be used with any input: forex, stocks, commodities,... The panel shows three indicators and six symbols with the trend for every pair (symbol/indicator): up, down or no trend. The indicators are: Average Directional Movement Index (ADX) Moving Average Convergence Divergence (MACD) Relative Strength Index (RSI) You can choose which indicators will use for entry/exit and can adjust the parameters of each indicator sepa
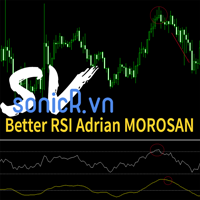
Adrian MOROSAN (2011) examined the same set of data using both traditional and modified RSI. He also incorporated trading volume in the method's calculating formula. Finally, findings acquired using the indicator's traditional form will be compared to those obtained using the modified version. He found that, in comparison to the original form, his version resulted in a greater advantage when a different, even opposing interpretation was used. And, in the alternative case, it resulted in much lar

The Quantitative Qualitative Estimation (QQE) indicator is derived from Wilder’s famous Relative Strength Index (RSI). In essence, the QQE is a heavily smoothed RSI.
Modification of this version: ( converted from tradingview script by Mihkell00, original from Glaz)
So there are Two QQEs. One that is shown on the chart as columns, and the other "hidden" in the background which also has a 50 MA bollinger band acting as a zero line.
When both of them agree - you get a blue or a red bar.
Update 2.2: Added MFI with predictive mod. Updated all indicators to reflect similar values, to combine multiple ones to rest well on overbought/oversold lines.
Update 2.3: Minor bug fixes.
Update 2.4: Removed buggy indicators DeMarker, and MACD, as it was too complicated and not as accurate as the rest due to it's nature. Added Awesome Oscillator. removed spreads, as it bogged the indicator down. Added other features, like indicator value compensators to match each other's levels when combine
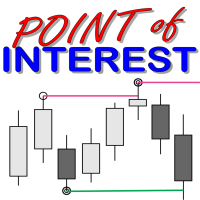
What is a Point of Interest? Traders who follow Smart Money Concepts may call this a Liquidity Point, or areas pools of liquidity have been built up by retail traders for for Big Banks to target to create large price movements in the market. As we all know, retail traders that use outdated and unreliable methods of trading like using trendlines, support and resistance, RSI, MACD, and many others to place trades and put their stop losses at keys points in the market. The "Big Banks" know these me

RSI Professional is based on an oscillator to hunt ranges and trends where you can also see it catches rebounds in the measurements according to the pair, it can be used for forex and synthetic indices, it works in any temporality, in the pairs that I use it are, eur/usd, usd/jpy, usd/chf and gbp/usd, in synthetics in the crash and boom pairs all, volatility 75, jumps, and range break!

Inspired investing.com Technical Indicators, this indicator provides a comprehensive view of the symbol by synthesizing indicators including: RSI, StochRSI : have 3 level oversold - red, midle (aqua when upper, pink when lower), overbuy – blue Stoch: oversold – red, overbuy- blue, aqua when main line < signal line, pink when main line > signal line MACD: aqua when main line < signal line, pink when main line > signal line ADX: aqua when line plus > line minus, pink when line plus < line minus

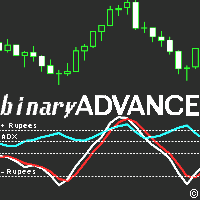
This is similar in it's idea as the Binary Advance/Lite indicator, but this is intended to use as a levels indicator, as well as trend reversal and how ranging the market is. It takes several useful indicators and combines them in such a way as to declutter your charts, yet prove even more useful together, than separate. RSI, RVI, DeMarker, MACD are added together then multiplied by ATR and StdDev to reveal multiple factors: How far the price has changed, and as the price slows down and reverses

Scalp Rsi. programmed %100 for scalping perfect for grabbing rebounds on m15, m5 and m1 ideal for catching mini trends echo for forex and synthetic indices ! works on all forex and synthetic pairs It works in all time frames, but it's made for scalping and collecting a quick profit. Accompanied by the ZigZag Gold indicator, it can be found on the market as well, World Investor.
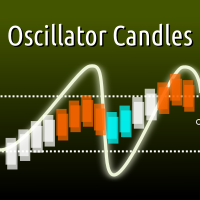
With this indicator you can colorize the candles on your chart based on the output of any oscillator indicator. Supporting both built-in and custom indicators, with the ability to set up to 5 custom parameters, custom color scheme, and upper/lower threshold values. Most built-in indicators in MT5 will be found under "Examples\\" path. For example, to use default RSI indicator, set your indicator path to "Examples\\RSI" in the inputs dialog. Input01-05 sets the custom parameters of your indicator
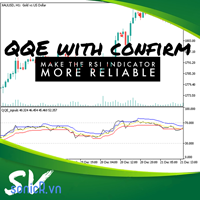
New QQE with confirm The relative strength index (RSI) is a technical indicator of momentum that measures the speed and change of price on a scale of 0 to 100, typically over the past 14 periods. Cause RSI measures the speed and change of price, trader normally use this indicator in two way: + Buy when oversold, sell when overbougth. + buy or sell when identifying divergence from rsi with price. In two way, it wrong when rsi in overbouth (for example) for long time or divergence. Even price ju
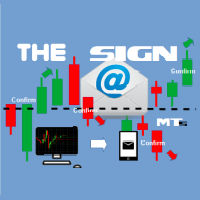
INDICATOR The Sign For MT5 Trend indicator for discretionary trading with three types of settable strategies that sends trading signals. Indicator for Traders, who work even with little experience in the settings HISTORY This indicator was born from my need, having little time during the day for work reasons, I was unable to make profitable trades, or I lost excellent opportunities. CHARACTERISTICS Optimal Time Frames 1H 4H 1D Can be used on all symbols/instruments: forex, commodities, cryptocur

The Accumulation / Distribution is an indicator which was essentially designed to measure underlying supply and demand. It accomplishes this by trying to determine whether traders are actually accumulating (buying) or distributing (selling). This indicator should be more accurate than other default MT5 AD indicator for measuring buy/sell pressure by volume, identifying trend change through divergence and calculating Accumulation/Distribution (A/D) level. Application: - Buy/sell pressure: above

Identify Engulfing candle pattern with Arrows & Alert ( built-in RSI filter). This indicator helps you to identify Engulfing candle pattern or Outside bar (OB) on the chart with arrows, along with an alert when a new Engulfing candle appears. Engulfing candle pattern is one of the most important reversal Price Action signals. You can choose between standard Engulfing (Engulfing based on candle body) or non standard Engulfing (Engulfing based on candle high - low )
Alerts can be turned on

The RSI2.0 indicator uses normalized price data and signal processing steps to get a normal distributed oscillator with no skew (mean is zero). Therefore, it can give much better reads than the traditional RSI. Areas/Levels of reversal: Overbought or oversold levels from traditional RSI have no statistical significance, therefore the standard deviation bands are implemented here, which can be used in similar way as possible reversal points. Divergence: As the indicator is nearly normal dist

Identify Pinbar Candle Pattern with Arrows & Alert (built-in RSI filter).
This indicator helps you to identify Pin bar Candlestick Pattern (or shooting star & hammer pattern) on the chart with arrows, along with an alert when a new Pin bar appears. Pin bar pattern is one of the most important reversal Price Action signals.
You can set Minimum Percent of Wick (or Tail) Length over full bar length (Recommended: 60%, 70%, 75%).
Alerts can be turned on and off: Popup Email Push Notification S

Rsi Project is an Rsi programmed to scalp on m1 , m5 and m15 , ideal for hunting revotes and with the naked eye the rsi marks the pecks on the ceilings and floors to grab those sails! It also serves to make long periods of time! It works for forex markets works for synthetic index markets fits all pairs ideal for volatility and jumps! Good profit! World Inversor !!!!

Все 11 индикаторов быстро отключаются и быстро включаются!
Набор индикаторов:
2 индикатора "TREND" :
- быстрый = линия 4 цвета - медленный = точки 4 цвета
Раскраска индикаторов зависит от направления тренда и показателя RSI: 1) тренд вверх и RSI<50% 2) тренд вверх и RSI>50%
3) тренд вниз RSI<50%
4) тренд вниз RSI > 50% Настройте периоды индикаторов для каждого из таймфреймов: M5 M10 M15 M30 H1 H2 H4 H6 H12 D1 W1 MN
Не входите в сделки, если хотя бы 1 из индикаторов имее

The EMA Engulfing Cross indicator is an indicator for the MetaTrader 5 platform that signals potential buy and sell opportunities based on an engulfing candle pattern after a recent exponential moving average cross. You can adjust how recently the trend change must have occurred using the PASTemaCROSS input. The RSI oversold/overbought function is used to confirm the signals generated by the moving averages. It takes into account the previous bar before the engulfing bar, and it is best used wi

MULTI MARKET SPEED INDICATOR FOR MARKET FLOW & PERFORMANCE CATEGORIZING Specially developed for pattern detection and multi market and cross / intermarket research, volatility , and performance research. Measure in real time, speed & performance on multi markets Detect price and time cycles , squeezes, performance, pattern in structure, pattern in price and structure, patterns over different individual markets and how they move together, time and price action and of course upcomin

The Double Stochastic RSI Indicator is a momentum indicator which is based on the Stochastic Oscillator and the Relative Strength Index (RSI). It is used help traders identify overbought and oversold markets as well as its potential reversal signals. This indicator is an oscillator type of technical indicator which plots a line that oscillates within the range of zero to 100. It also has markers at levels 20 and 80 represented by a dashed line. The area below 20 represents the oversold area, wh

macd rsi It is a macd indicator added to the rsi to capture perfect entries in the average crossovers! As seen in the indicator, it has 2 lines, one of gold color and the other violet line, where the cross of the violet with the gold downwards is a sell signal when it crosses the violet up from the gold it is a buy signal! very good to make shorts works for forex markets and synthetic indices It is used in any temporality! Good profit! World Investor.
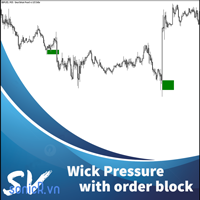
Multiple Wicks forming at OverSold & OverBought levels create Buying and Selling Pressure. This indicator tries to capture the essence of the buy and sell pressure created by those wicks. Wick pressure shows that the trend is Exhausted. Order block should display when buying or selling pressure wick. When price go inside buy order block and up to outside order block, trader should consider a buy order. If price go inside buy order block and down to outside order block, trader should consider a s

Detect divergence (classic, hidden) price and all oscillator indicator include: RSI, CCI, MACD, OSMA, Stochastic, Momentum, Awesome Oscillator (AO), Accelerator Oscillator (AC), Williams Percent Range (WPR), Relative Vigor Index (RVI), Rate of Change (ROC). Confirm reversal with dochian channel for to improve signal quality. Divergence is when the price of an asset is moving in the opposite direction of a technical indicator , such as an oscillator, or is moving contrary to other data. Diverge

The Returns Momentum Oscillator (RMO) shows the difference of exponentially weighted volatility. It is used to find market tops and bottoms. Volatility comes in waves, and as the Returns often front run price action it gives directional prediction of market movement. The Oscillator signal is RMSed (root mean squared) to make the distribution closer to Gaussian distribution. While the traditional RSI indicators are often stuck in overbought or oversold areas for a long time, RMSing of the sign
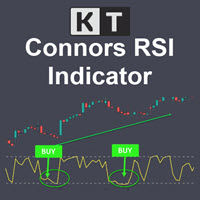
KT Connors RSI is a modified and more advanced version of the original Connors RSI developed by Larry Connors. It was designed to help traders generate trade signals based on short-term price movements.
The Connors combine the standard RSI calculation with two additional elements: a short-term RSI, ROC, and a moving average.
Features Provides more transparent and more actionable buy and sell signals using the overbought/oversold zones. Incorporates short-term RSI and moving average, provid

Slopes are an increasingly key concept in Technical Analysis. The most basic type is to calculate them on the prices, but also on technical indicators such as moving averages and the RSI.
In technical analysis, you generally use the RSI to detect imminent reversal moves within a range. In the case of the Blue indicator, we are calculating the slope of the market price and then calculating the RSI of that slope in order to detect instances of reversal.
The Blue indicator is therefore used

Introducing Trend Fusion 444F, a powerful MQL4 indicator designed to determine market direction using multiple trading indicators. This comprehensive tool offers a unique fusion of technical analysis techniques that help traders make informed decisions in various market conditions. Key Features: Comprehensive Analysis: Trend Fusion 444F combines several widely-used trading indicators to provide a multi-dimensional view of the market. The indicators include Moving Averages, MACD, RSI, DeMarker,

Schaff trend RSI indicator (It is related with EMA and RSI) It is suited for sub-Indicator to undertand trend(or direction change)
As you can see the screenshot, it's good with Nagaraya-Watson Envelope Indicator (or others) I am using this indicator as Screenshot setting. (Schaff value is default value. 23, 50, 9, close) If you want to get Nagaraya-Watson Envelope, Link: https://www.mql5.com/ko/market/product/97965

https://youtu.be/JJanqcNzLGM , https://youtu.be/l70MIHaQQa4 , https://youtu.be/pg0oiT5_8y0 Automated Supply and Demand Trading Edge MT5. These videos demonstrate how we apply the supply and demand system to our latest trading review and market analysis
Enhance your Trading Strategy with the Supply and Demand Trading Edge MT5. Gain a competitive market advantage with the Supply and Demand Trading Edge MT5 indicator, a powerful tool that combines MACD signals with supply and demand zones. B
Automated Supply and Demand Tracker MT5. The following videos demonstrate how we use the system for trade setups and analysis.US PPI, Fed Interest Rates, and FOMC Trade Setup Time Lapse: U.S. dollar(DXY) and Australian dollar vs U.S. dollar(AUD/USD) https://youtu.be/XVJqdEWfv6s The EUR/USD Trade Setup time lapse 8/6/23. https://youtu.be/UDrBAbOqkMY . US 500 Cash Trade Setup time lapse 8/6/23 https://youtu.be/jpQ6h9qjVcU . https://youtu.be/JJanqcNzLGM , https://youtu.be/MnuStQGjMyg,  ;

Moving Average Band is a tool designed to provide traders with a more comprehensive and realistic perspective when using moving averages in their technical analysis. Unlike conventional moving averages plotted as lines, Moving Average Band introduces a unique approach by representing the moving average as a dynamically adjusting band based on market volatility.
Volatility is an intrinsic characteristic of financial markets, and understanding how it impacts trends and price movements is essent

This will find a possible reverse area and show entry signal and this strategy is using every candle and calculate them
buyer should us e with other indicators to get the best trade entry like Macd , RSI , or EMA . SMA.
Make sure try demo first it will supprise you all because how good it is
i hope you guy enjoy it but my coding is not good, so i cant code any EA for this , my own strategy
The Scalper v2 will give you accurate guidance to trade with. It has indications with arrows and it sends notifications. This software was built based on the RSI,MACD,Martingale, Ema 50 and 200, Aligator, SMA 30,50, ADX, Volumes percent range, variable dynamics and fibonacci levels. all of these indicators have something in common, it allows analysis, support and resistance, accurate signals for buy and sell, overbought and oversold market analysis. I have combined all of these indicators into o
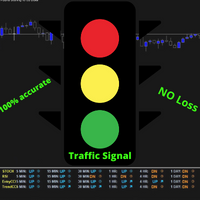
Представляем революционный индикатор MT5 под названием Traffic Signal - ваша несокрушимая ворота в мир успешной торговли! Разработанный с точностью и профессионализмом, Traffic Signal работает на основе специальной стратегии, которая использует мощь передовых технических индикаторов - RSI, Stochastics, CCI и Trends - на всех временных рамках. Приготовьтесь к невероятному торговому опыту, поскольку этот передовой индикатор предлагает вам наиболее точные сигналы для входа, позволяя вам навигироват
ボリンジャーバンドは、価格変動を分析するためのテクニカル分析の1つのツールになります。
ボリンジャーバンドには、中心線と2つのバンドがあります。
中心線は、一般的には移動平均線(通常は20日間の単純移動平均)として計算されます。この中心線は、一定期間の価格の平均値を表しています。 ボリンジャーバンドのバンドは、中心線の上と下に等間隔で配置されます。通常は中心線から2つの標準偏差分だけ離れた位置に設定されます。 拡大(Expansion)とは、ボリンジャーバンドが広がる状態を指します。
つまり、上下のバンドが中心線から離れ、価格の変動範囲が広がっていることを示します。拡大は、相場が活発になり、価格の大幅な変動が起こりやすいことを示すことがあります。 収縮(Contraction)とは、ボリンジャーバンドが狭くなる状態を指します。
つまり、上下のバンドが中心線に近づき、価格の変動範囲が狭まっていることを示し、相場が方向感を失い、一時的に価格変動が鈍化していることを示すことがあります。 ボリンジャーバンドの収縮と拡大は、価格変動のパターンや相場の特徴を捉えるために重要な指
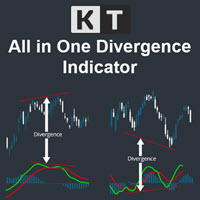
The KT All-In-One Divergence is designed to identify regular and hidden divergences between the price and 11 widely recognized oscillators. This powerful tool is indispensable for swiftly and accurately spotting market reversals. Its a must-have tool in any trader's arsenal, providing clear and accurate divergence patterns. Its accuracy and speed in identifying market reversals are remarkable, allowing traders to seize profitable opportunities confidently.
Features No Interference: You can a
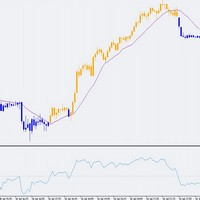
This indicator can be very important in any trading system. The Indicator colors candles above or below the 50 level of the RSI, which is a widely used indicator in technical analysis. With this indicator it is much easier to identify trends, helping with the entry and exit points of negotiations. It is a fact that in the financial market, simple things work. Este indicador pode ser muito importante em qualquer sistema de negociação. O Indicador colore as velas acima ou abaixo do nível 50 do

Indicator Type Strategy (Pullback) for all Symbols and Periodicity, Preferably from 30M periodicity. Can be used for manual trading. Its workspace corresponds to channel of 3 bars of Bill Willians. Also relies on the indicator Rsi and Atr. BUY when: There is a Green Arrow STOPLOSS to buy, below the bottom line of the channel (red line)" SELL when: There is a Red Arrow. STOPLOSS to sell, above the upper line of the channel (blue line)

Представляем революционный индикатор MT5, DARWIN Assistant - ваши врата в мир успешной торговли! Разработанный с точностью и опытом, DARWIN Assistant работает по специальной стратегии, которая использует мощь передовых технических индикаторов - RSI, Stochastics, CCI и Trends - на всех временных интервалах. Приготовьтесь к экстраординарному торговому опыту, поскольку этот передовой индикатор предлагает вам самые точные сигналы для входа, позволяя вам ориентироваться на рынках с непревзойденн

Индикатор для торговли по тренду Не перерисовывает В алгоритме использует надёжные и проверенные временем индикаторы Рекомендуем использовать с дополнительными фильтрами такими как уровни поддержки сопротивления Или стандартные индикаторы Bollinger bands или Zigzag Так же можно совмещать с индикатор RSI для определения перекуплености или перепроданости валютной пары или индекса Индикатор заточен под работу на маленьких таймфреймах от м1 до м15

The RSI Divergence Indicator is a powerful tool designed to identify potential reversals in the market by spotting discrepancies between the Relative Strength Index (RSI) and price movement. Divergences can be a significant indication of an impending trend change, either from bullish to bearish or vice versa. This indicator is built for making the task of identifying potential trade opportunities more straightforward and efficient.
Features: Automatic Detection: The indicator scans the cha
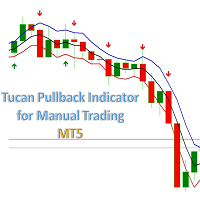
Indicator Type Strategy (Pullback) for all Symbols and Periodicity, preferably from M30. The strategy is based on criteria for the Rsi, Atr and Force indicators. The channel band corresponds to the value of the Atr indicator. The default parameters correspond to : a) Price = Median price b) Method of averaging = Simple c) Period of averaging = 3 d) Coefficient of the Atr indicator = 1.0
BUY when there is a Green Arrow. StopLoss below the bottom line of the channel. SELL when there is a Red

This indicator can automatically scan the RSI values of all varieties on the mt5 and set an alarm.
Note that it is fully automatic scanning, you do not need to enter which varieties, do not need to open the variety chart, as long as there are some varieties in the market quotation column, will be automatically scanned to reach the set rsi alarm value, will pop up the alarm, and cycle with the market changes to scan the latest RSI values of all varieties, and alarm.
This is very helpful t
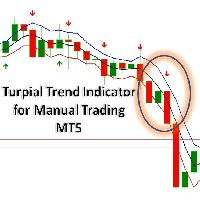
Turpial Trend Indicator for Manual Trading. Indicator (arrow) for all Symbols and Periodicity. This indicator considers a pullback strategy and a trend strategy. The strategy that is based on criteria for the Rsi, Atr and Macd indicators. The channel band corresponds to the maximum and minimum average values of three bars (Bill Williams 3-bar strategy). BUY when there is a Green Arrow. It is advisable to place the StopLoss below the bottom line of the channel. SELL when there is a Red Arrow. I

This indicator is based on the RSI indicator
Also, some candlestick patterns are used in it to identify better signals
Can be used in all symbols
Can be used in all time frames
Easy to use method
Adequate settings
Settings: period: The number of candles used to calculate signals. alarmShow: If you want to receive an alert in Metatrader after receiving the signal, enable this setting alarmShowNoti: If you want to receive an alert on your mobile after receiving a signal, enable this sett
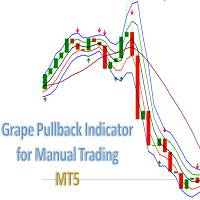
Indicador Grape Pullback for Manual Trading. Indicator (arrow) Type Strategy (Pullback) for all Symbols and Periodicity, Preferably from 30M periodicity. Can be used for manual trading. The indicator i s determined by strategies that is based on criteria for the location of candlesticks in the channel and for the Rsi and Market facilitation index indicators. Its workspace corresponds to channel of 3 bars of Bill Willians with a channel extension . BUY when there is a Green Arrow. StopLoss below
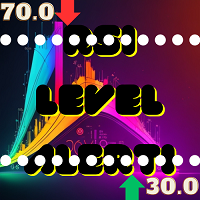
Simple alert system which will alert you on your mobile terminal, email and on the chart whenever RSI crosses below the overbought level or above the oversold level. Use this alert system, so you don’t have to watch the chart all day for the RSI levels to break.
INPUTS: 1. RSI Period- (Default is 14). Number of candles the RSI indicator will look back for the calculations. 2. OB Level- (Default is 70). This is the Overbought level or Upper level for the RSI indicator. 3.

Форекс индикатор Double Stochastic RSI – это модификация осциллятора Стохастик для платформы MetaTrader 5.
ИНФОРМАЦИЯ О ИНДИКАТОРЕ В форекс индикаторе Double Stochastic реализован двойной Стохастик, примененный к RSI, с применением плавающих уровней вместо фиксированных для оценки перепроданности и перекупленности. В случаях, когда период RSI <=1, вы получаете просто двойной Стохастик. Можно использовать дополнительное сглаживание результатов (для этого используется встроенная EMA). Досту

Прецизионный индикатор осциллятора (Pi-Osc) от Роджера Медкалфа из Precision Trading Systems Версия 2 была тщательно перекодирована для быстрой загрузки на вашем графике, а также внесены некоторые другие технические улучшения для улучшения опыта. Pi-Osc был создан для предоставления точных сигналов времени для совершения сделок, предназначенных для поиска экстремальных точек истощения - точек, к которым рынок вынужден идти, чтобы сработать стоп-заказы всех остальных. Этот продукт решает вековую
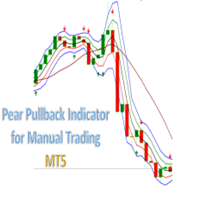
Grape PullBack Indicator for Manual Trading. Indicator (arrow) Type Strategy (Pullback) for all Symbols and Periodicity, Preferably from 30M periodicity. Can be used for manual trading. The indicator i s determined by strategies that is based on criteria for the location of candlesticks in the channel and for the Rsi, Atr, Fractal and Market facilitation index indicators. Its workspace corresponds to channel of 3 bars of Bill Willians with a channel extension . BUY when there is a Green A

Alpha Trend Pro: Your Ultimate Trading Companion
Embark on a new era of trading with Alpha Trend Pro Indicator. Crafted with precision and innovation, Alpha Trend is designed to elevate your trading experience by seamlessly blending powerful elements to navigate various market conditions.
**Key Features:**
**1. Dynamic Adaptability:** - In sideways market conditions, Alpha Trend acts as a dead indicator. Say goodbye to many false signals and welcome a tool that adapts seamlessly to mar

Note: If you want to apply this indicators on indicators which are shown in a sub-window, then consider using this indicator instead: https://www.mql5.com/en/market/product/109066.  ; AIntel Predict - Your Gateway to Future Trading Success! Unlock the power of predictive analytics with AIntel Predict. Say goodbye to the guesswork and hello to improved forecasting, as AIntel Predict leverages historical data to unveil the future of your trades like never before. Whether you're a seasoned tra

Note: This indicator is for sub-window use and not for the main chart. If you need to apply it for the indicators in the main chart, then use this indicator instead: https://www.mql5.com/en/market/product/108876 AIntel Predict - Your Gateway to Future Trading Success! Unlock the power of predictive analytics with AIntel Predict. Say goodbye to the guesswork and hello to improved forecasting, as AIntel Predict leverages historical data to unveil the future of your trades like never before. Whe

MT5 RSI Experiment: This indicator leverages the Relative Strength Index (RSI) and floating levels to pinpoint potential buy and sell signals.
The code uses enums for prices and RSI calculation methods. These enums define indicator parameters.
Input variables include RSI period, price type for RSI calculation, smoothing method, and look-back period with levels for floating levels.
Index buffers store RSI fill, RSI up line, RSI middle line, RSI down line, and trend line data.
For each ba

This is my trusted friend of trading.
So... I musted re-write this in MQL5 to use in brokers where there is only MT5.
The indicator is like a mother-in-law, who talks often, talks a lot and often inappropriately.
The indicator, in addition to giving us an entry signal on parameters which I will then list, monitors the trend of the hourly timeframe, OSMA to understand the entry direction, RSI to sense any overbought or oversold conditions from which to abstain, ATR for the volatility and ADX

Introducing the True Currency Strength Indicator - Your Ultimate Guide to Market Mastery! Are you tired of guesswork when it comes to trading? Ready to elevate your trading strategy to a whole new level? Look no further! We present to you the True Currency Strength Indicator - the game-changer in the world of Forex trading. Unleash the Power of Multi-Currency Analysis: Gain a competitive edge with our revolutionary indicator that goes beyond traditional single-currency analysis. The Tru

We have turned one application of the RSI indicator into a separate indicator, represented by red and green bars, which is incredibly simple and effective.
By simply inputting the parameters for the RSI, you can obtain the RSI indicator represented by red and green bars. The application of the RSI indicator has been expanded into a powerful new indicator, visually presented through red and green bars, undoubtedly an innovative move in the field of financial technical analysis. The design of t

RSI Barometer Pro provides traders and investors with intuitive insights into market sentiment and potential trend reversals by representing RSI values using red and green bars. The meticulous design of red and green bars in RSI Barometer Pro visually showcases market dynamics. When the bars appear green, it indicates that the RSI is below 50, suggesting a relatively stable market phase. Conversely, when the bars turn red, it signifies that the RSI is above 50, indicating potential market volat

Product Name: RSI Momentum Gauge
Product Description: The RSI Momentum Gauge is an advanced indicator that transforms the traditional concept of overbought and oversold signals from the RSI (Relative Strength Index) into a visually intuitive representation using red and green bars. Designed to empower traders and investors with actionable insights, this innovative indicator provides a clear assessment of market conditions and potential trend reversals. The RSI Momentum Gauge's distinctive fea

The indicator plots up/down buffer arrows in the chart window two of the following indicator conditions are met. Moving Average ; Moving Average Convergence/Divergence (MACD ); Oscillator of Moving Averages (OsMA ); Stochastic Oscillator ; Relative Strength Index (RSI) ; Commodity Channel Index (CCI) ; Relative Vigor Index (RVI ); Average Directional Index (ADX) ; Triple Exponential Average ; Bollinger Bands ;
ตัวบ่งชี้จะพล็อตลูกศรขึ้น/ลงในหน้าต่างแผนภูมิเมื่อตรงตามเงื่อนไขของตัวบ่งชี้สองตัวต่

Description:
Heikin-Ashi-like swing oscillator candles. It can be used in the same way as RSI or Stochastic.
For example: Zero crossing. Above the zero line is bullish, below the zero line is bearish.
Overbought or oversold. 100 line is the extreme bought level, -100 line is the extreme sold level.
Divergences.
Time frame: Any time frame.
Instrument: Any instrument.

The RSI Advanced tool will help traders capture trends and optimal entry points by:
- Enter a Buy order when the green line crosses the yellow line. Provided that the yellow line is near line 32 or 20 - Enter a Sell order when the green line crosses the yellow line. Provided that the yellow line is near line 68 or 80
Additionally, you can combine it with the convergence divergence that occurs at the green line.
**When you purchase the Mastering the RSI MT4 or Mastering the RSI MT5 indicat

Certainly! Let’s discuss the RSI Rush , an aggressive momentum indicator that combines weighted moving averages (WMAs) at lows, mid-price, and tight highs. Here are the key components: Weighted Moving Averages (WMAs) : The RSI Rush employs three WMAs: WMA at Lows : Calculated based on the lowest prices during a specific period. WMA at Mid-Price : Considers the average price (midway between highs and lows) during the same period. WMA at Tight Highs : Based on the highest prices during the speci

Представляем Volatility Doctor RSI, новаторский инструмент, созданный на основе надежного индикатора RSI, призванный улучшить ваш опыт торговли как никогда прежде.
Наш индикатор не только предоставляет текущие показатели RSI в реальном времени, но также точно прогнозирует, где будет находиться показатель RSI через 10 шагов в будущем на выбранном вами интервале времени и любом предпочтительном символе для торговли.
Адаптивный Интеллект: Этот инструмент учится и настраивается под любой рынок
Индикатор RSI Pro Analyser — это мощный инструмент, предназначенный для трейдеров, стремящихся принимать обоснованные решения одновременно на нескольких таймфреймах. Этот индикатор использует RSI для предоставления сигналов перекупленности , перепроданности и тренда, что упрощает определение возможностей входа в рынок. Его главным преимуществом является простота чтения благодаря четким и четким цветовым кодам, обозначающим различные рыночные условия.
Индикатор отображает значения RSI и связан
DYJ SignalSourceOfRSI is a momentum oscillator which shows price strength by comparing upward movements of Close prices to their downward movements over a selected number of periods. There are two kinds of signals provided by RSI: RSI reaching of either overbought or oversold level and then making a bit of reversal: Signals to buy are generated falling of RSI below level( 30) and Signals to sell are generated rising of RSI above level( 70) Falling of RSI below level( 30) and then rising abo

The Fat and Slim indicator tracks strong and weak money in the market. It is derived from RSI, MFI and many similar indicators. Input values are closing prices and volumes. The RSI (yellow curve) is in the range -100 ... 100. It is additionally multiplied by a coefficient so that the curve is not compressed to the middle values at higher periods (a problem with the classic RSI with different periods). Strong/Fat red curve is RSI weighted by higher volumes. Weak/Slim blue curve is calculated so t
MetaTrader Маркет предлагает каждому разработчику торговых программ простую и удобную площадку для их продажи.
Мы поможем вам с оформлением и подскажем, как подготовить описание продукта для Маркета. Все продаваемые через Маркет программы защищаются дополнительным шифрованием и могут запускаться только на компьютере покупателя. Незаконное копирование исключено.
Вы упускаете торговые возможности:
- Бесплатные приложения для трейдинга
- 8 000+ сигналов для копирования
- Экономические новости для анализа финансовых рынков
Регистрация
Вход
Если у вас нет учетной записи, зарегистрируйтесь
Для авторизации и пользования сайтом MQL5.com необходимо разрешить использование файлов Сookie.
Пожалуйста, включите в вашем браузере данную настройку, иначе вы не сможете авторизоваться.