Смотри обучающее видео по маркету на YouTube
Как купить торгового робота или индикатор
Запусти робота на
виртуальном хостинге
виртуальном хостинге
Протестируй индикатор/робота перед покупкой
Хочешь зарабатывать в Маркете?
Как подать продукт, чтобы его покупали
Платные технические индикаторы для MetaTrader 5 - 38
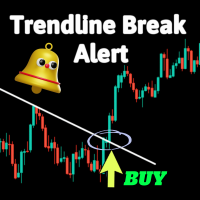
Это простой индикатор, который предоставляет предупреждение о разрыве трендовой линии.
Он может быть полезен, если вы привыкли использовать трендовые линии в своей торговле. Регулируемые параметры включают:
Идентификатор свечи: на какой свече сигнализировать после прорыва И три типа предупреждений: Отправить Email Звуковые предупреждения Уведомления Push Буду рад вашим отзывам или комментариям к индикатору.
Для тестирования рекомендуем использовать MetaTrader 4 вместо стратегического тест

Индикатор MasterOBV - мощный инструмент технического анализа, использующий объем, положительную корреляцию и скользящее среднее (MA) для улучшения идентификации трендов на финансовых рынках. Внедряя активы с положительной корреляцией через меню индикатора, MasterOBV предлагает изысканный подход к оценке силы и направления трендов. Включение скользящего среднего обеспечивает дополнительное сглаживание движений цен, помогая более точному отслеживанию основного тренда во времени.
Учитывая не тол

Exclusive Limited Time Offer! Grab this useful indicator for a lifetime at just $49. Volatility indicator dashboard designed to revolutionize how traders perceive and navigate market volatility. Track volatile for multiple currency pairs one at time for multiple timeframes. Works best with Forex Market, Gold, Silver, Oil. Available in MT4, MT5. Indicator Features: Multi-Symbol, Multi-Timeframe Dashboard: Gain a strategic advantage by simultaneously monitoring volatility across various currenc
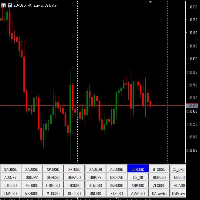
"Symbol Changer" - это индикатор, созданный для платформы Metatrader 5 (MT5), который предоставляет возможность изменять символы. Для выполнения всех действий с этим индикатором используйте следующие характеристики:
Характеристики: Установка: Чтобы установить индикатор на платформе MT5, скопируйте ваш .mq5 код в папку Indicators и перезапустите MT5. Отображение: На графике индикатор "Symbol Changer" размещает специальные кнопки для изменения символов. Начальные настройки: Дополнительные пара

The GGP Trendlines with Breaks Alert MT5 Indicator is a technical analysis tool that can assist investors in identifying market trends. The indicator returns pivot point based trendlines with highlighted breakouts. Users can control the steepness of the trendlines as well as their slope calculation method. This indicator is MT5 conversion of the Trendlines with Breaks Indicator by “ LuxAlgo “ in Trading View website and some alert methods are added to provide real-time alerts when a trading sign
Этот Индикатор показивает тренд движения. Если свеча красный надо искать сигнали на Покупку . Если свеча Красный то искат сигнал надо Продажа. Сигнали можна искат на Moving Average 14 Индикатор оссобенно подходит для скалпинга. В торговле учтите Риск менеджмент. В тейдинге рекомендую таймфрейм M5 M30 Всем Удачи )) Если ест вопросы можете самной связитес +77767238899 Эл почта dilshodaka25@gmail.com

The GGP Chandelier Exit Alert MT5 Indicator is a volatility-based indicator that identifies stop loss exit points for long and short trading positions. Chandelier Exit is based on the Average True Range (ATR) indicator. It is designed to keep traders in the trend until a defined trend reversal happens. Traders use CE to maximize their returns in a trade and make stop loss exit decisions. It is based on the principle that a trend reversal is highly probable when the price of an asset moves agains

GIVE A LOOK TO MY OTHER PRODUCTS ! 100 % PER MONTH PROFIT---- MY NEW SIGNAL HERE -------> https://www.mql5.com/en/signals/2162238?source=Site+Signals+My# Smoothed MA cross alert,is a cool indicator that notificate you directly on your telephone or email when 2 Smoothed Moving average ( you choose the parameters ) crosses. This is very important when you want to know a change of trend and you can't stay in front of your pc! The indicator give you the alert just when the next bar opens ,so give

Introducing our groundbreaking indicator designed to elevate your trading strategy! Unlock the power of precise volume analysis with Buy, Sell, and Neutral indicators. Tailor your approach with customizable levels based on timeframes and moving average methods.
Key Features: Dynamic Volume Insights Instantly identify Buy, Sell, and Neutral volumes for informed trading decisions. Gain clarity on market sentiment like never before. Adaptable Level Configuration Customize and adapt levels to matc

Introducing our cutting-edge product, an innovative MACD Oscillator with a dynamic level enhanced by a decimal point Moving Average (MA) also with the versatility of multiple moving average modes. This advanced trading tool brings precision and flexibility to your technical analysis, offering a seamless experience for traders seeking a competitive edge in the financial markets.
Key Features: Dynamic Level Precision Our MACD Oscillator is equipped with a dynamic level feature, providing traders

Introducing our revolutionary intra-day trading indicator, meticulously crafted to optimize your trading insights within the 24-hour market cycle. Immerse yourself in historical data with precision using two distinctive modes - "All History" and "Last X Hours."
Key Features: All History Mode Uncover a comprehensive view of the day's dynamics. Instantly analyze the preceding day's high and low, 50% mid-point, and the open versus close price for the current day. Decode critical patterns to infor

Gobbo è un indicatore professionale che evidenzia il trend del mercato con un aspetto grafico chiaro e comprensibile, è basato sulla Moving Average e può essere impostato su qualsiasi periodo di intervallo, di default impostato sul periodo 14, scegliendo un periodo più alto evidenzierà meno cambi di tendenza per un approccio sul medio o lungo periodo, con un periodo più basso più cambi di tendenza per un approccio sul breve termine L'aggiornamento e l'adattamento al time frame scelto avviene in

Золотой узор — это конфигурация из трех свечей, основанная на золотом сечении последовательности Фибоначчи.
Золотое сечение составляет 1,618. Его вариации включают 0,618, 2,618 и 3,618. По этому индикатору лучшие результаты достигаются на уровне 2,618.
Золотой паттерн состоит из обычной свечи, за которой следует свеча большего размера с ценой закрытия, по крайней мере, в 2,618 раза превышающей размер первой свечи.
Бычий золотой паттерн состоит из бычьих свечей, тогда как медвежий золо

The Liquidation Estimates (Real-Time) experimental indicator attempts to highlight real-time long and short liquidations on all timeframes. Here with liquidations, we refer to the process of forcibly closing a trader's position in the market.
By analyzing liquidation data, traders can gauge market sentiment, identify potential support and resistance levels, identify potential trend reversals, and make informed decisions about entry and exit points.
USAGE (Img 1) Liquidation refer

Vision è un indicatore professionale che legge i dati storici del periodo impostato e in base a tali elabora una previsione scrivendo l'andamento sul grafico, l'impatto visivo eccellente rende chiaro l'andamento del prossimo trend e mette a fuoco il prezzo d'ingresso il posizionamento di ordini e la distanza per SL e TP, di default è impostato con un rapporto bilanciato 24 a 24 ciò significa che in base alle ultime 24 candele prevederà scrivendo sul grafico l'andamento delle 24 candele successi

Простой индикатор тренда в NRTR виде с отрисовкой линий стоплосса и тейпрофита, цвет и направление движения которых определяются действующим трендом. Индикатор имеет возможность подавать алерты, отправлять почтовые сообщения и push-сигналы при смене направления тренда. Следует учесть что значение входного параметра индикатора Deviation of the take profit line in points для каждого финансового актива на каждом таймфрейме необходимо подбирать индивидуально!
Introducing the Engulfing Goddess Metatrader 5 (MT5) Indicator , a revolutionary tool designed for traders who seek to harness the power of candlestick patterns in their trading strategy. This indicator is built on the principles of engulfing candlestick patterns , a popular method used by successful traders worldwide. Our Engulfing Goddess Indicator stands out with its ability to detect various kinds of engulfing patterns . It employs a range of filters, providing you with a comprehensive anal

Introducing the True Currency Strength Indicator - Your Ultimate Guide to Market Mastery! Are you tired of guesswork when it comes to trading? Ready to elevate your trading strategy to a whole new level? Look no further! We present to you the True Currency Strength Indicator - the game-changer in the world of Forex trading. Unleash the Power of Multi-Currency Analysis: Gain a competitive edge with our revolutionary indicator that goes beyond traditional single-currency analysis. The Tru

Этот продукт предназначен для отображения торговых сессий 15 стран на основе часового пояса вашего брокерского сервера и различных режимов отображения на основе желаемых вами настроек для предотвращения перегрузки графиков и возможности установки сессии в желаемое пользователем время.
На рынке Форекс никогда не заходит солнце, но его ритм танцует в такт отдельным торговым сессиям. Понимание этих сессий, их совпадений и их уникальной атмосферы имеет решающее значение для любого трейдера форекс
Описание работы
Индикатор 'MA7 Agave' основан на стандартном индикаторе Average Directional Movement Index (ADX). Показывает пересечение линий +DI и -DI. Подробная информация о индикаторе 'MA7 Agave' .
Настройки индикатора
General settings – общие настройки: ADX period – период индикатора Average Directional Movement Index.
'MA7 Flax' settings – настройки индикатора 'MA7 Flax': ATR period – период индикатора Average True Range, (0 – не исп); ATR multiplier – множитель значения индикатора A

Market Cycle and Trading Sessions Indicator
Introducing our Market Cycle and Trading Sessions Indicator, a tool designed to provide you with a comprehensive view of the financial market like never before. Observe the market's pulse with our exclusive indicator. Gain a deep understanding of market phases, from accumulation to distribution, to make informed, strategic decisions with a high probability.
What makes our indicator?
1. Date Range for Calculations: Customize the start and end da

Шаблон развертки это передовой инструмент, предназначенный для определения как вращения медвежьего тренда, так и вращения бычьего тренда с беспрецедентной точностью,
давая вам возможность принимать обоснованные торговые решения и оставаться на шаг впереди рынка. Версия MT4: WH Sweep Pattern MT4 Особенности шаблона развертки:
Он автоматически обнаруживает и отображает на графике вращение медвежьего и бычьего тренда, используя разные цвета и стили. Он отправляет вам оповещение (звуковое

Our goal is to empower every trader with their own unique trading system.
Indicator - Red-Green Series
Ultimate simplicity: Red for uptrend, green for downtrend! It can be used independently or in combination with other indicators. This is a red-green indicator based on the crossover of two moving averages. We have more indicators in store and will be adding them gradually. Friends who make a purchase are kindly requested to contact us after their purchase.
In the world of financial tradi
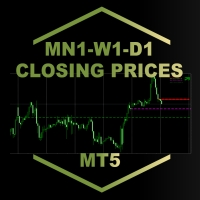
MN1-W1-D1 Close Price Indicator to Index Trading for MT5
The indicator draws lines to the close prices of the last closed bars of monthly, weekly and daily timeframes. Observably, these prices are significant support and resistance prices at major indices, like Nasdaq, DAX. The info panel always shows the prices relative to each other in the correct order. If the current price is the highest - i.e. higher than the last monthly, weekly and daily closing price - it is in the first row. The lowest
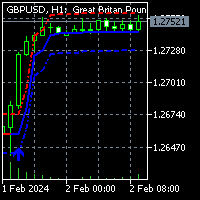
To get access to MT4 version please click here . This is the exact conversion from TradingView: "HalfTrend" by "Everget". This is a light-load processing indicator. This is a non-repaint indicator. Buffers are available for processing in EAs. All input fields are available. You can message in private chat for further changes you need. Thanks for downloading

Smart Delta Volume использует динамические уровни, которые автоматически корректируются в зависимости от волатильности рынка. Эта особенность обеспечивает более точный и адаптивный анализ изменений рыночных условий в реальном времени. Благодаря способности динамически корректироваться, индикатор предлагает более всестороннее и надежное представление о потоке объема и динамике цен. Кроме того, Smart Delta Volume имеет валидатор откатов, который активируется, когда цена превышает два динамических

Это пользовательский индикатор, основанный на ценовом действии свечей. Он генерирует оповещения о сигналах покупки или продажи по любому торговому инструменту. Доступны пояснительные материалы по проверке сигналов, методам входа и выхода. Чтобы узнать больше, найдите пояснительные видеоролики по запросу Benjc Trade Advisor на YouTube.
Последняя версия включает фильтры трендов и осцилляторов для повышения точности сигналов. Цена продукта увеличена для неограниченного использования и аренды.

Описание работы
Индикатор 'MA7 Flax' основан на стандартном индикаторе Average True Range (ATR) и данных свечи. Показывает свечи, которые больше по размеру по отношению к значению индикатора ATR. Подробная информация о индикаторе 'MA7 Flax' .
Настройки индикатора
General settings – общие настройки: ATR period – период индикатора Average True Range; ATR multiplier – множитель значения индикатора Average True Range; Remove subsequent arrows – удаляет последующие стрелки в одном направлении.

Описание работы
Индикатор 'MA7 Viola' основан на стандартном индикаторе Moving Average (MA). Показывает резкое повышение или понижение скользящей средней. Подробная информация о индикаторе 'MA7 Viola' .
Настройки индикатора
General settings – общие настройки: Difference – разница между двумя последними значениями МА, проценты; Period – период МА; Method – метод МА; Apply to – применить к; Remove subsequent arrows – удаляет последующие стрелки в одном направлении.
Message settings – настрой

We have turned one application of the RSI indicator into a separate indicator, represented by red and green bars, which is incredibly simple and effective.
By simply inputting the parameters for the RSI, you can obtain the RSI indicator represented by red and green bars. The application of the RSI indicator has been expanded into a powerful new indicator, visually presented through red and green bars, undoubtedly an innovative move in the field of financial technical analysis. The design of t

RSI Barometer Pro provides traders and investors with intuitive insights into market sentiment and potential trend reversals by representing RSI values using red and green bars. The meticulous design of red and green bars in RSI Barometer Pro visually showcases market dynamics. When the bars appear green, it indicates that the RSI is below 50, suggesting a relatively stable market phase. Conversely, when the bars turn red, it signifies that the RSI is above 50, indicating potential market volat

Product Name: RSI Momentum Gauge
Product Description: The RSI Momentum Gauge is an advanced indicator that transforms the traditional concept of overbought and oversold signals from the RSI (Relative Strength Index) into a visually intuitive representation using red and green bars. Designed to empower traders and investors with actionable insights, this innovative indicator provides a clear assessment of market conditions and potential trend reversals. The RSI Momentum Gauge's distinctive fea

Pips on Candles shows the number of pips involved in each candle on the chart. It is possible to set 3 different ranges for counting on each single candle via the RangeType parameter: With "HighLow" you count the pips present between the minimum and the maximum. The number is shown under each candlestick on the chart. With "OpenClose" you count the pips present between the opening and closing price of the candle. The number is shown under each candlestick on the chart. With "HighDistAndLowDist"

Exclusive Limited Time Offer! Grab this useful indicator for a lifetime at just $49. Enhance your trading experience with this amazing Metatrader indicator that tracks your live trade status. The indicator displays live take profit, stop loss & trailed stop loss, or trailed profit value with the best dashboard with account balance alert. Indicator Features:
Trade Details The indicator shows the last 5 active trades data in chronological order. Don't miss this opportunity to get your copy tod

Описание работы
Индикатор 'MA7 Galega' основан на стандартном индикаторе Moving Average (MA). Показывает прокол скользящей средней. Подробная информация о индикаторе 'MA7 Galega' .
Настройки индикатора
General settings – общие настройки: Period – период индикатора MA; Method – тип сглаживания MA; Apply to – тип цены; Consider the direction of the candle – учитывать направление свечи.
Message settings – настройки сообщений: Send message to the terminal (Alert) – разрешение на отправку сообщ

Описание работы
Индикатор 'MA7 Ixora' основан на стандартном индикаторе Moving Average (MA). Показывает пересечение быстрой и скользящей скользящих средних. Подробная информация о индикаторе 'MA7 Ixora' .
Настройки индикатора
General settings – общие настройки: Consider the direction of the candle – учитывать направление свечи.
Fast moving average settings – настройки быстрой скользящей средней: Period – период индикатора MA; Method – тип сглаживания MA; Apply to – тип цены.
Slow moving

График секунд для MetaTrader 5
Индикаторы позволяют создавать графики в терминале MetaTrader 5 с таймфреймом в секундах. Таймфрейм на таком графике задается в секундах, а не в минутах или часах. Таким образом, вы можете создавать графики с таймфреймом меньше М1. Например, S15 — таймфрейм с периодом 15 секунд. К полученному графику можно применить индикаторы, советники и скрипты.
Вы получаете полноценный график, на котором можно работать так же хорошо, как и на обычном графике.
Таймфрейм в

Описание работы
Индикатор 'MA7 Aster' основан на стандартном индикаторе Moving Average (MA). Показывает отклонение цены от скользящей средней. Подробная информация о индикаторе 'MA7 Aster' .
Настройки индикатора
General settings – общие настройки: Period – период индикатора MA; Method – тип сглаживания MA; Apply to – тип цены; Minimum distance – минимальное расстояние от скользящие средней до цены закрытия свечи.
Message settings – настройки сообщений: Send message to the terminal (Alert)
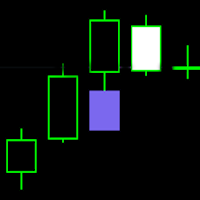
FVG - Fair Value Gap indicator is a three candle pattern indicator . It find inefficiencies or imbalances in market. It act as magnet before continue the trend.
indicator key function
1. No object is used to draw the plot. You can use this to build EA and backtest also.
2. Min and max value to Filter-out the noises .
It use as retest zone and can be use as entry price also. It popular among price action traders. your suggestion and comments are welcome and hopping that you will find th

Описание работы
Индикатор 'MA7 Hypnum' основан на стандартном индикаторе Commodity Channel Index (CCI). Показывает зоны перекупленности и перепроданности. Подробная информация о индикаторе 'MA7 Hypnum' .
Настройки индикатора
General settings – общие настройки: Period – период индикатора CCI; Apply to – тип цены для расчета индикатора CCI; Upper level – верхний уровень; Lower level – нижний уровень.
Message settings – настройки сообщений: Send message to the terminal (Alert) – разрешение на

Данный индикатор создан для трейдеров, которые осознали необходимость исследования фундаментальных изменений в экономике на глобальные тренды мировых рынков. Понимание того, что в мире больших денег простых путей не бывает, ваша фора. Индикатор Secret Fairway задуман как универсальный инструмент в арсенале трейдера, аналитика, инвестора. С помощью него вы сможете создать свою доску приборов, отражающую ваши взгляды на экономическую теорию и практику. Эволюционируя с каждой сделкой, каждой проч
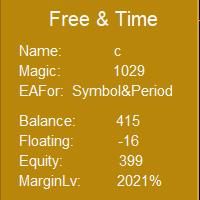
This indicator can use EAMagic to statistics EA since the operation of the revenue data and the current trading volume and trade data statistics, now the first version, should be slowly updated. When using, you must enter the number of EA's Magic when loading, in order to receive EA's transaction data. The part of the input currency pair and cycle can be filled in by the user to more clearly understand the currency pair and cycle that is currently being traded, and to facilitate the screenshot
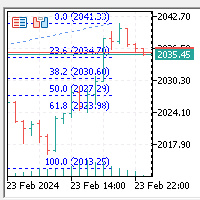
Этот индикатор auto fibo set находится в окне K - line, автоматически генерируя регрессию Фибоначчи: 0,0%, 23,6%, 38,2%, 50,0%, 61,8%, 100,0%, следуя цена отображения. Zoom In, Zoom Out, TimeFrame (M1, M5, M15, M30, H1, H4, D1, W1, MN) Циклы меняются, носить максимальную цену, ломать нижнюю ступень, все могут автоматически обновляться для генерации. Как восходящий, так и нисходящий тренды автоматически корректируют линию регрессии Фибоначчи вверх и вниз.

This indicator can help you clearly identify trend changes in both bullish and bearish markets. The indicator compares the closing price of the last candle with the closing price of the candle "X" periods ago (input parameter). In an uptrend, an initial number '1' is plotted if a candle closes higher than the closing of a candle "X" periods ago. In a downtrend, an initial number '1' is plotted if a candle closes below the closing of a candle "X" periods ago. Subsequent numbers are plotted when e

Candlesize Histogram is an indicator for monitoring candlestick sizes. This indicator is based on the high and low of a candle, also adopting the use of a histogram to easily determine the length of each candlestick bar. We can determine if the market is gaining momentum using this indicator. The histogram is calculated based on the size of the bars.
Key benefits
- Easily get the length of every candlestick
- Determine market condition if trending or not trending using the Candl
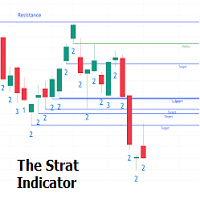
The Strat indicator is a full toolkit regarding most of the concepts within "The Strat" methodology with features such as candle numbering, pivot machine gun (PMG) highlighting, custom combo highlighting, and various statistics included.
Alerts are also included for the detection of specific candle numbers, custom combos, and PMGs.
SETTINGS
Show Numbers on Chart: Shows candle numbering on the chart.
Style Candles: Style candles based on the detected number. Only effective on no

Indicator shows "Support" and "Resistance" lines (these lines are drawn using the DRAW_LINE drawing style - that is, they are not graphic objects). A search for new minimums and maximums is performed to the left and right of the "signal bar" - the "signal bar" is the conventional middle of each new construction. Why is the word Flexible in the name of the indicator? Because we have the possibility to specify different number of bars to the left ('Left Bars') and to the right ('Right Bars'

Привет, коллеги! Представляю вам уникальное решение - Мультивалютный сканер волатильности в реальном времени. Этот индикатор является одним из результатов моего личного наблюдения за рынком на протяжении многих лет. Он решает несколько ключевых проблем, с которыми сталкиваются трейдеры: Отслеживание волатильности в реальном времени: Устраняет необходимость постоянного обновления или переключения графиков, чтобы видеть, где происходят значительные движения. Понимание международных корреляций:

To get access to MT4 version please click here . This is the exact conversion from TradingView: "Schaff Trend Cycle" by "everget". This is a light-load processing indicator. This is a non-repaint indicator. Buffers are available for processing in EAs. All input fields are available except fillings(due to graphical aesthetics). You can message in private chat for further changes you need. Thanks for downloading
OVERVIEW
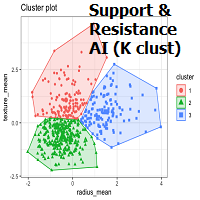
K-means is a clustering algorithm commonly used in machine learning to group data points into distinct clusters based on their similarities. While K-means is not typically used directly for identifying support and resistance levels in financial markets, it can serve as a tool in a broader analysis approach.
Support and resistance levels are price levels in financial markets where the price tends to react or reverse. Support is a level where the price tends to stop falling
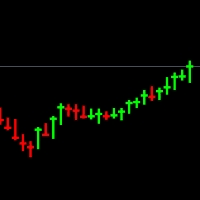
Примечание. Вам необходимо скрыть существующий тип диаграммы. Вы можете сделать это, изменив цвета диаграммы. Если вы не знаете, как это сделать, посмотрите это видео - https://youtu.be/-4H6Z5Z4fKo или свяжитесь со мной по адресу priceaction9@outlook.com.
Это тип графика, который будет отображаться вместо вашего графика, и он показывает только максимум, минимум и закрытие, а также имеет толстые фитили. Это помогает вам лучше понять каждую свечу, уменьшая шум, вносимый ценами открытия каждой

This indicator, named Edyx_Candle_Size, is designed to be used with the MetaTrader 5 trading platform. It displays the size of the candlestick body for the current timeframe as a histogram. The indicator does not provide any specific trading signals or recommendations
Measures the size of of the candlestick. That is the difference between the open and close as the case may be for either a bullish or a bearish candle. This can be use to filter out entry position as to maximise profit and minimi

Order Blocks are supply or demand zones in which big traders can find the comfort of placing large buy and sell orders and completing a big, very big transaction. Order blocks are a unique trading strategy that helps traders find a direction in the market. Usually, it allows traders to find out what financial institutions are planning to do in a particular market and better indicate the next price movement.

The dashboard scans the readings of two indicators: 'MACD' and 'Stochastic'. Displays signals in three columns: for MACD, for Stochastic, and the resulting column (if the signal is the same for both indicators). Scanning can be selected on one or more timeframes. If you disable all timeframes, the dashboard will still load, but with settings specifically for such cases. Signals are always checked for the zero bar (zero bar is the rightmost bar on the chart) of the indicator. Description of para

Хорошо всем знакомый индикатор ZigZag который рисует лучи на основании заданного параметром pips " значимого движения" в пунктах инструмента. Причем если появился луч, не будет такого что он исчезнет (то есть индикатор не перерисовывается), будет обновляться только его экстремум, до тех пор пока не появиться противоположный луч. Есть возможность вывести на каждый луч текстовые метки с описанием ширины луча в барах и длины луча в пунктах.
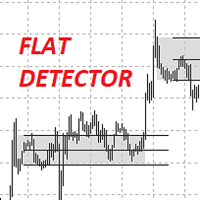
Представляю вам индикатор IndFlatDetector . Он относится к уровневым индикаторам и показывает Уровни проторговки.
В данном индикаторе сочетается простота интуитивность настроек и точность отрисовки уровней. Up count - количество свечек вверх для определения верхнего диапазона Down count - количество свечек вниз для определения нижнего диапазона Borders on the body or shadow - вести расчет диапазона по теням или по телу Change the borders or not - менять границы изначального диапазона или нет

The ZigZag Wave Entry Alert** indicator, created by Azad Gorgis in 2024, is designed for MetaTrader 5 and aims to provide traders with entry signals based on ZigZag patterns. Here's a brief overview of its functionality and key features:
Functionality:
- Detection of ZigZag Patterns: The indicator identifies significant price movements and outlines potential ZigZag patterns on the chart. It detects new highs and lows based on user-defined parameters such as Depth, Deviation, and Backstep. -
Индикатор " Session Control " предназначен для отображения торговых сессий на графике цены. Это позволяет трейдеру увидеть, в какие моменты активности происходят наиболее важные торговые сессии: Тихоокеанскую, Европейскую, Американскую и Азиатскую. Каждая из этих сессий характеризуется определенной волатильностью и активностью на рынке, что важно для принятия торговых решений.
Особенности: Отображение сессий : Индикатор показывает на графике цены временные промежутки, соответствующие различны
Этот индикатор представляет собой закрепленный осциллятор полулогарифмического масштаба. Логарифмическая шкала широко используется профессиональными специалистами по анализу данных для более точного отображения информации, собранной за определенный период времени, точно так же, как MT5 отображает данные о ценах. Фактически, основная логика этого индикатора была бесплатно получена от зарубежного ученого-биотехнолога.
Логарифмическая диаграмма отображает логарифмические значения по осям X (гори

Brief Description: A tool to display historical Open, High, Low, and Close (OHLC) price points for various time periods. Gain insights into market behavior with data from yesterday, the day before, the previous week, and the previous month. Recognize liquidity zones effectively. Features: 1. Comprehensive Timeframe Insights: Visualize crucial OHLC points for different timeframes. Historical data for yesterday, day before yesterday, previous week, and previous month. 2. Built on ICT's Teachings:

Introducing the Consecutive Green/Red Candle Alert Indicator for MT5 - Your Trend Spotting Companion!
Are you ready to take your trading to the next level? We present the Consecutive Green/Red Candle Alert Indicator, a powerful tool designed to help you spot trends and potential reversals with ease. Whether you're a new trader looking for clarity in the market or an experienced pro seeking additional confirmation, this indicator is your trusted companion.
Key Features of the Consecutive Gre
Buy DEMA 3 Scalp Indicator, Signaling and Trend Finder for Forex DEMA 3 indicator is a professional indicator for finding trends as well as finding entry and exit points for a symbol. This indicator is designed based on the DEMA indicator, which can tell you the signals accurately and quickly. The DEMA 3 indicator can give you accurate and early entry points for swings. Features of the DEMA indicator 3
Receive signals as notifications on the Metatrader mobile application. Receive signals by em
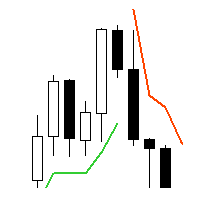
Supertrend - невероятно мощный и универсальный индикатор, предназначенный для помощи трейдерам в определении текущего тренда на конкретном торговом инструменте. С помощью двух встроенных индикаторов, Average True Range и Standard Deviation, трейдеры могут выбрать наиболее подходящий индикатор для своей стратегии торговли. Пользователи также могут настроить период этих индикаторов и выбрать цену (Close, High, Low, Open, Weighted), к которой он должен быть применен, с Typical price в качестве опци

Heikin Ashi Heikin Ashi is a charting technique that can be used to predict future price movements. It is similar to traditional candlestick charts. However, unlike a regular candlestick chart, the Heikin Ashi chart attempts to filter out some of the market noise by smoothing out strong price swings to better identify trend movements in the market.
To create Heiken Ashi, a formula is used in which price data is entered, while ordinary candles are built only on bare numbers, without using any

An invention that will turn your working principles upside down.
Especially in horizontal and stagnant markets, annoying losses can occur.
Besides, following trend lines, support and resistance can be tiring.
To put an end to all this, I decided to create a professional "moving average" indicator.
All you have to do is follow the colors.
If you need additional support, I recommend the "Heiken-Ashi" candle indicator in my profile.
I wish you lots of profit..

Description: Dimatis Watchtower is a powerful backtesting tool designed for traders seeking for an efficient way to test and optimize their trading strategies on the MetaTrader 5 platform. With a minimalist interface and advanced features, this tool provides an outstanding solution for evaluating the performance of your strategies in various market conditions. Key Features: Backtesting: Perform precise and reliable backtests of your strategies using historical data from your broker directly on M

Индикатор Spread Pulse - это эффективный инструмент, который предоставляет трейдерам информацию о текущем спреде на графике. Спред - это разница между ценой покупки и ценой продажи инструмента.Индикатор представлен в виде текста, который отображается на графике. Это позволяет трейдеру легко отслеживать текущий спред. Один из главных преимуществ индикатора Spread Pulse заключается в его цветной визуализации. В зависимости от размера спреда, цвет текста изменяется. По умолчанию, при маленьком

Supertrend is a trend following indicator based on the Average True Range (ATR) . Calculating the odd line combines trend detection and volatility. It can be used to detect changes in trend direction and position stops.
Basic knowledge Supertrend is a trend following indicator. It takes up space on the main chart and its plots show the current trend. A Supertrend can be used for varying durations (daily, weekly, intraday, etc.) and varying instruments (stocks, futures or forex). Super

Certainly! Let’s discuss the RSI Rush , an aggressive momentum indicator that combines weighted moving averages (WMAs) at lows, mid-price, and tight highs. Here are the key components: Weighted Moving Averages (WMAs) : The RSI Rush employs three WMAs: WMA at Lows : Calculated based on the lowest prices during a specific period. WMA at Mid-Price : Considers the average price (midway between highs and lows) during the same period. WMA at Tight Highs : Based on the highest prices during the speci
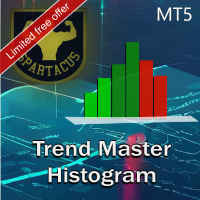
Trend Chart Histogram — индикатор, основанный на алгоритме с использованием двух скользящих средних и нескольких осцилляторов. Благодаря цветовому коду он позволяет быстро определить тенденцию и воспользоваться крупнейшими рыночными импульсами. Светлые цвета указывают на тренд, темные цвета определяют импульсы, а серый указывает на то, что вам не следует входить в рынок.
Версия для МТ4 здесь.
Входные параметры: - Период 1 (быстрый период) - Период 2 (медленный период) - Период осциллятора
А знаете ли вы, почему MetaTrader Market - лучшее место для продажи торговых стратегий и технических индикаторов? Разработчику у нас не нужно тратить время и силы на рекламу, защиту программ и расчеты с покупателями. Всё это уже сделано.
Вы упускаете торговые возможности:
- Бесплатные приложения для трейдинга
- 8 000+ сигналов для копирования
- Экономические новости для анализа финансовых рынков
Регистрация
Вход
Если у вас нет учетной записи, зарегистрируйтесь
Для авторизации и пользования сайтом MQL5.com необходимо разрешить использование файлов Сookie.
Пожалуйста, включите в вашем браузере данную настройку, иначе вы не сможете авторизоваться.