Смотри обучающее видео по маркету на YouTube
Как купить торгового робота или индикатор
Запусти робота на
виртуальном хостинге
виртуальном хостинге
Протестируй индикатор/робота перед покупкой
Хочешь зарабатывать в Маркете?
Как подать продукт, чтобы его покупали
Платные технические индикаторы для MetaTrader 5 - 2
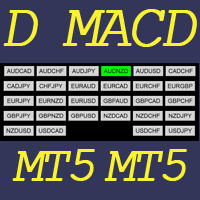
Данный индикатор позволяет визуализировать состояние MACD на 28 парах. С помощью цветовой панели, алертов и push-оповещений, пользователи с легкостью могут использовать потенциальные возможности для совершения покупки и продажи, когда быстрые EMA 28 основных пар пересекают медленные EMA. Dashboard MACD - это интуитивно понятный и удобный графический инструмент, способный помочь вам отслеживать все 28 пар и предоставляющий торговые сигналы на основе правил MACD (пересечение быстрой EMA медленную)

"Бои между быками и медведями продолжают оказывать влияние на цену даже после того, как бой закончился, оставляя при этом грязное поле, которое внимательные специалисты могут использовать для управления рисками и поиска возможностей. Используйте анализ "трендового зеркала" для изучения таких волатильных зон с поиском действий в прошлом, которые повлияли на текущий тренд, при которых цена разворачивается и пересекает границы". Индикатор RSI Mirrors and Reflections обеспечивает надежную методику с

Индикатор Trend Sign - это модификация индикатора MACD (Moving Average Convergence Divergence), которая позволяет определить направление и силу тренда, а также смену тенденции. Индикатор построен на двух скользящих средних - быстрой и медленной, и может работать на любых таймфреймах. Восходящий тренд показан синим цветом линии индикатора, а нисходящий тренд - красным цветом. Закрывать короткую позицию и открывать длинную можно, когда цвет линии меняется с красного на синий. Закрывать длинную поз

Назначение Индикатор DG Trend+Signs окрашивает свечи по цвету тренда и четко показывает области консолидации, используя индикаторы DoGMA Trend и DoGMA Channel. Он разработан для помощи пользователям в торговле, отображения трендов, зон консолидации и обозначения точек входа и выхода. При определении пробоев индикатор также учитывает консолидации.
Основные особенности Разработан простым в использовании, имеет небольшое количество параметров НЕ перерисовывается НЕ пересчитывается Сигналы на вход
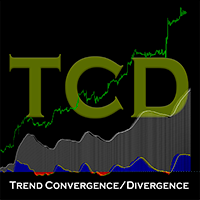
TCD (Trend Convergence Divergence), основан на стандартном индикаторе MACD, с измененными расчетами, отображает силу тренда, его импульсы и откаты. TCD состоит из двух гистограмм, первая показывает основной тренд, в то время как вторая отображает импульсы и откаты. Среди преимуществ индикатора, можно считать: возможность торговать по тренду, добавляться в рынок при появлении импульсов, торговать по дивергенции основного тренда а также по дивергенции откатов.
Входные Параметры Show_Signal_1 : С
Версия для MetaTrader 4 доступна здесь : https://www.mql5.com/ru/market/product/24881 FFx Basket Scanner ищет до пяти индикаторов среди 16 доступных на всех парах и таймфреймах. Таким образом вы можете ясно увидеть торговли по каким валютам следует избегать, а на каких сосредоточить внимание.
Когда валюта переходит в экстремальную зону (например, 20/80%), вы можете торговать всей корзиной с большей уверенностью. Другая область применения индикатора – определение сильных и слабых валют для поис

Индикатор сочетает разворотные паттерны "Двойное дно" и "Двойная вершина" с индикатором определения расхождения между графиком цены и осциллятором MACD.
Особенности С легкостью определяет сильные сигналы разворота Позволяет использовать паттерны "Двойное дно" и "Двойная вершина" и сигналы расхождения MACD вместе или по отдельности Получайте уведомления по электронной почте и/или на мобильное устройство при обнаружении сигнала Можно использовать пользовательские цвета Индикатор не перерисовывае

Данный сканер показывает значения тренда известного индикатора SuperTrend для множества инструментов (до 15) на 21 таймфрейме. Уведомляет о смене направления тренда в терминале MetaTrader 5, по email и push-уведомлением.
Важная информация Есть различные способы использования сканера SuperTrend Scanner. Вот два примера: Сканера позволяет легко торговать сверху вниз. Если на двух старших таймфреймах, например W1 и D1, ежу появились зеленые значения (растущий тренд), а на H12 показываются красные

Multi-Oscillator - это превосходный швейцарский армейский нож для мультивалютной и мульти-таймфреймовой торговли. Он отображает желаемый осциллятор для множества валютных пар и / или таймфреймов на одном графике. Он может использоваться для торговли статистическим арбитражем, в качестве инструмента скрининга рынка или в качестве уточненного индикатора с несколькими таймфреймами. [ Руководство по установке | Руководство по обновлению | Устранение неполадок | FAQ | Все продукты ] Простая интерпре

The indicator identifies divergences between chart and RSI, with the possibility of confirmation by stochastics or MACD. A divergence line with an arrow appears on the chart when divergence is detected after the current candle has expired. There are various filter parameters that increase the accuracy of the signals. To identify a divergence, point A must be set in the RSI, then point B Value must be edited, which sets the difference between point A and point B. The indicator can be used for tim

—— 进入本指标前,请谨记:『 不易,变易 』。拔开数理统计的枝叶,变化是不变的定理才是本指标的由来和内涵思想。本指标只应指明变化到不变之间的契机。 本指标——阴阳线指标(YiiYnn)由一条粗蓝色实线和一条细烟绿色虚线构成,粗实线叫阳线(Ynn),作为主线,细虚线叫阴线(Yii),作为辅线。本指标不同DeMarks去搜索哪个周期的最高最低,也不同Stoch那样告诉你超买超卖超过后缩小再等超买超卖直至资金的尽头。本指标是分析价格减速动态均值线的(偏)相关性及自相关性,并采用标准差的方法进行滤波以求趋势示意更明朗。所以,本指标有以下特性: 指标依据波浪理论,有二阶线性插值模拟组合多条均线(开收高低)构建波浪动力并分析它们各自相关性,所以将对趋势有很好的 预测性 ——与MACD、ATR等相比。它并非只让我们看到趋势的尾巴,请参考最后一张示例图; 指标采用简单的方差进行差相过滤,在兼顾计算性能的同时让盘整阶段的指示更明朗; 阳线与阴线之间是偏相关差相,具有阴消阳长相互激励、抵消的特点,因此命名; 本指标中判定的趋势与常人所称『趋势』不同,本指标中的趋势包括: 上涨、下跌和横盘 。不要忽略横盘

Market profile was developed by Peter Steidlmayer in the second half of last century. This is a very effective tool if you understand the nature and usage. It's not like common tools like EMA, RSI, MACD or Bollinger Bands. It operates independently of price, not based on price but its core is volume. The volume is normal, as the instrument is sung everywhere. But the special thing here is that the Market Profile represents the volume at each price level.
1. Price Histogram
The Price Histogram
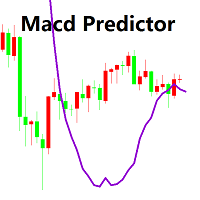
Macd's main chart indicator
1. You can determine the price at which the MACD will change from buy to sell, and vice versa. It is the cousin of the oscillator predictor. If you know a position at the time, then the exact price, current and next (future) columns will need to reach the MACD crossover. You can also see how far the market has to go before your current position is helped or blocked by the next MACD crossover force. You can do this in all time frames because the predictor is updated

Технический индикатор Universal Oscillator является комбинацией торговых сигналов самых популярных и широко используемых осцилляторов. Индикатор представлен гистограммами, а также линиями fast и slow MA, что позволяет расширить список получаемых торговых рекомендаций и работать как по тренду, так и в боковом движении рынка. Таким образом, гистограммы позволяют определить момент пробоя ценовых значений и движение в новой фазе рынка, а линии указывают на зоны перекупленности и перепроданности. Ос

Индикатор, показывающий момент преодоления нулевой отметки индикатора MACD. Подходит для бинарной торговли, т.к. имеется возможность посчитать точность сигналов, в зависимости от времени экспирации.
Входные параметры Period of SMA1 - Период 1 скользящей средней Period of SMA2 - Период 2 скользящей средней Period of SMA3 - Период 3 скользящей средней Price Type - Тип цены, используемый индикатором MACD Invert signals - Возможность давать инвертированные сигналы (для работы по тренду) Infor

This indicator is designed to detect the best divergences between price/MACD and price/RSI. MACD and RSI produce by far the best divergence signals therefore this indicator focus on those two divergences. This indicator scans for you up to 15 instruments and up to 21 timeframes for bullish and bearish divergences. You need to add the indicator only to one single chart ! The indicator will then automatically scan all configured instruments and timeframes.
Important Information
The indicator c
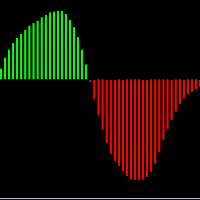
É um indicador oscilador baseado no "MACD" convencional porém com suavização . Através desse indicador você será capaz de operar sem os ruídos produzidos pelo indicador "MACD" convencional. Em quais ativos o indicador funciona: Em qualquer ativo do mercado, tanto em forex, como B3 ou binárias. Qual é o novo parâmetro: Smooth Period ou período de suavização, que representa o período que será suavizado no "MACD".
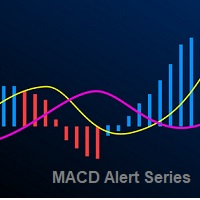
The Moving Average Convergence Divergence Indicator (MACD) is both a trend–seeking and momentum indicator which uses several exponential moving averages set to closing prices to generate trading signals. We added many types of alerts plus the Delay Cross Filter to aid in your search for better opportunities in the market.
Product Features Sound alert Push Notification (Alerts can be sent to your mobile phone) Signs on chart Alert box Alert on zero histogram cross or line sign cross. DelayCros
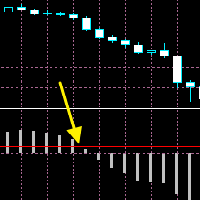
The moment when the MACD line crosses the signal line often leads to a significant price movement and trend changes. MACD Cross Prediction is an indicator that uses OSMA(MACD oscillator) and a red line. You can change the level of the red line on the indicator setting popup(and the red line moves up and down). The alerts(email, mobile push, sound, MT5 alert) will be sent when the MACD histogram touches the red line, which means the alerts can be sent just before/around the time when the MACD

KT MACD Divergence shows the regular and hidden divergences build between the price and oscillator. If your trading strategy anticipates the trend reversal, you can include the MACD regular divergence to speculate the potential turning points. And if your trading strategy based on the trend continuation, MACD hidden divergence would be a good fit.
Limitations of KT MACD Divergence
Using the macd divergence as a standalone entry signal can be a risky affair. Every divergence can't be interpr
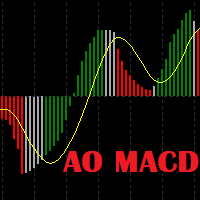
Awesome Oscillator Moving Average Convergence/Divergence Indicator. Не опаздывает как AO и не шумит как MACD. Представлена базовая версия индикатора. В разработке версия "PRO" с такими возможностями как отправка сигналов на e-mail и построение на графике линий дивергенций и конвергенций. Входные параметры: Fast: короткая EMA Slow: длинная EMA Signal: сигнальная линия Цвета: Красный: MACD < Signal Зеленый: MACD > Signal Серый: MACD выше Signal, но ниже предыдущего MACD MACD ниже Signal, но выше п

Говоря об индикаторе Zen MACD
Четырехцветный двухпроводной MACD
Показать сумму площадей столбца
InpFastMA = 12; // Период быстрой EMA
InpSlowMA = 26; // Период медленной EMA
InpSignalMA = 9; // Период SMA сигнала
InpAppliedPrice = PRICE_CLOSE; // Примененная цена
InpMaMethod = MODE_EMA; // Ma_Method
input bool ChArea = false; // Чжщ Площадь
Параметры быстрой линии периода быстрой EMA
Параметры медленной линии с периодом EMA
Параметры сигнальной линии периода SMA
Цена при

1. Why did I develop this series of indicators
I found that most traders need to use multiple time frame indicators. They usually switch time frame to see indicators. However, once the timeframe is switched, you cannot see the corresponding relationship between the price in the smaller timeframe and the indicator in the larger timeframe . For example: if your price chart is in H1 timeframe, you can see H4, D1 and W1 indicators in H1 timeframe Chart. This is more helpful for you to find t

The indicator allows you to simplify the interpretation of signals produced by the classical MACD indicator.
It is based on the double-smoothed rate of change (ROC).
Bollinger Bands is made from EMA line.
The indicator is a logical continuation of the series of indicators using this classical and efficient technical indicator.
The strength of the trend is determined by Bands and main line.
If the bands width are smaller than the specified value, judge it as suqueeze and do not recommen
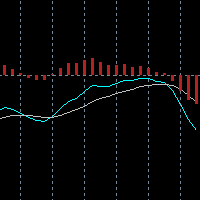
The built-in MACD does not properly display all the different aspects of a real MACD. These are: The difference between 2 moving averages A moving average of (1) A histogram of the difference between (1) and (2) With this indicator you can also tweak it as much as you want: Fast Period (default: 12) Slow Period (default: 26) Signal Period (default: 9) Fast MA type (default: exponential) Slow MA type (default: exponential) Signal MA type (default: exponential) Fast MA applied on (default: close)
One of the most popular methods of Technical Analysis is the MACD , Moving Average Convergence Divergence, indicator. The MACD uses three exponentially smoothed averages to identify a trend reversal or a continuation of a trend. The indicator, which was developed by Gerald Appel in 1979 , reduces to two averages. The first, called the MACD1 indicator, is the difference between two exponential averages , usually a 26-day and a 12-day average.

Основная цель индикатора заключается в определении наиболее оптимальных точек входа в сделку и выхода из нее. Индикатор состоит из трех частей. Первая – это стрелки, показывающие оптимальные точки входа в сделку и выхода из нее. Стрелка вверх – сигнал на покупку, стрелка вниз – на продажу. В индикаторе заложен алгоритм аналитического анализа, который включает в себя множество показаний стандартных индикаторов, а также авторский алгоритм. Вторая часть – это информация в правом верхнем углу (работ
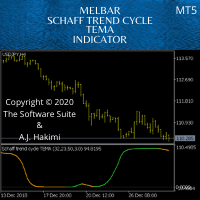
Schaff Trend: A Faster And More Accurate Indicator In Combination With The TEMA MACD - Scalping Systems Advantage
The Schaff Trend Cycle (STC) is a charting indicator that is commonly used to identify market trends and provide buy and sell signals to traders. Developed in 1999 by noted currency trader Doug Schaff, STC is a type of oscillator and is based on the assumption that, regardless of time frame, currency trends accelerate and decelerate in cyclical patterns. https://www.investopedia.

Currency Strength Meter - это самый простой способ определить сильные и слабые валюты. Этот индикатор показывает относительную силу 8 основных валют + Золото: AUD, CAD, CHF, EUR, GBP, JPY, NZD, USD, XAU. Символ золота может быть изменен на символ другого инструмента, например такого как XAG, XAU и т.д.
По умолчанию значение силы нормализовано в диапазоне от 0 до 100 для алгоритма RSI: Значение выше 60 означает сильную валюту; Значение ниже 40 означает слабую валюту;
Для работы данного индик

Currency Strength Meter - это самый простой способ определить сильные и слабые валюты. Этот индикатор показывает относительную силу 8 основных валют: AUD, CAD, CHF, EUR, GBP, JPY, NZD, USD.
По умолчанию значение силы нормализовано в диапазоне от 0 до 100 для алгоритма RSI: Значение выше 60 означает сильную валюту; Значение ниже 40 означает слабую валюту;
Индикатор создан и оптимизирован для его внешнего использования в советниках и внутри пользовательских индикаторах. Для непосредственного

Very special indicator of Joe Dinapoli which is a derivative from traditional MACD indicator. It shows the precise price, at which MACD will show line crossing and trend shifting. Also, this level is known one period ahead of time.You can constantly reassess your current position by looking at this studying a variety of timeframes. When you are in a trade, you have a feel for how much time you have for the trade to go your way by looking at the distance between the MACD Predictor line and the

All in One package includes the Oscillator Predictor , MACD Predictor , Thrust Scanner and Advanced Fibonacci indicators which are mandatory for applying Dinapoli trade plans.
Please visit below links for detailed explanations of indicators. Advanced Fibonacci Indicator => https://www.mql5.com/en/market/product/107933 Thrust Scanner Indicator => https://www.mql5.com/en/market/product/52829 Overbought /Oversold Predictor indicator => https://www.mql5.com/en/market/product/52628 Macd

The indicator monitors the Dinapoli MACD trend in multiple timeframes for the all markets filtered and shows the results on Dashboard.
Key Features Indicator can be used for all markets Monitors every timeframe, from 1 Min to Monthly
Parameters
UseMarketWatch: Set true to copy all symbols available in market watch MarketWatchCount : Set the number of symbols that you want to copy from the market watch list. CustomSymbols: Enter the custom symbols that you want to be available in dashboard.
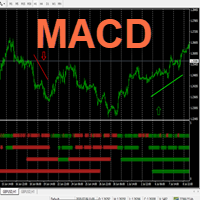
Hello This Indicator will draw Green (Up) and Red (Down) small arrows from Multi TimeFrames based in ( MACD ) to help you to take decision to buy or sell or waiting If there 4 green arrows in same vertical line that's mean (Up) and If there 4 Red arrows in same vertical line that's mean (Down) and the options contain (Alert , Mobile and Mail Notifications). Please watch our video for more details https://youtu.be/MVzDbFYPw1M and these is EA for it https://www.mql5.com/en/market/product/59092 G
Indicator summary Индикатор информационная панель отображает значения и торговые действия, а так же выводит сводную информацию о торговых действиях, основанных на 11 встроенных индикаторах. Встроенные индикаторы:
RSI (Relative Strength Index )- пересечение зоны перекупленности сверху вниз - сигнал на продажу. Пересечение зоны перепроданности снизу вверх - сигнал на покупку. При колебаниях в зоне между перекупленостью и перепроданостью сигнал формируется в зависимости от нахождения значения о

The indicator shows when there are overpricing and divergences over a normalized MACD Plus, it displays signals with configurable alerts, self-regulating dynamic overprice levels, and a simple setup and interface. The indicator that automatically calculates overprices ranges! MACDmaxmin is an indicator based on the MACD oscillator that effectively identifies trend changes in price, as it is a momentum indicator that captures the trend and shows the relationship between two moving averages of th

[ОПИСАНИЕ]
Индикатор Entry Point показывает стрелки вверх / вниз как точку входа для покупки / продажи. Сигнал основан на EMA, MACD и Price Action.
Красная стрелка означает, что это хорошая возможность для продажи. Зеленая стрелка означает, что это хорошая возможность для покупки. [ПРЕДУПРЕЖДЕНИЕ И РЕКОМЕНДАЦИИ]
Торговля Forex и финансовыми инструментами с кредитным плечом сопряжена со значительным риском и может привести к потере вашего инвестированного капитала. Вы не должны инвестировать

Projeção de alvos harmônicos com dois cliques, os alvos possuem melhor qualidade quando ancorados em candles climáticos, seja de ignição ou exaustão ou em pivôs de alto volume.
Funciona com qualquer ativo (volume real e volume tick), em qualquer tempo gráfico, ações, indicies, futuros, forex, criptomoedas, commodities, energia, mineiro e qualquer outro. As projeções devem respeitar os princípios de confluência e simetria, portanto não devem ser utilizados unicamente como critério de decisão, se
RaptorT: Cumulative Volume and Cumulative Volume Delta (Buying Selling Pressure) Introduction RaptorT CV & CVD (CVD is also known as Buying/selling Pressure or Book Pressure) offers two basic and meaningful indicators for trading having volumes as main index and weigh of the market interest. It gives good insights in combination with VWAP line and its four upper and lower standard deviations, developing PVP (Peak Volume Price, the equivalent of the POC for the old Market Profile), Volume Profi

DAILY STATS PANEL is a small panel that shows some statistic of opened chart. For example: Fibonacci resistance and support, daily average moving points and today's moving range, etc. After applied this expert advisor to chart, a small panel will be shown on the right. ** NOTE: This is not an algo trading expert advisor. **
Input parameters show_pivot - Whether or not to show pivot, resistance and support line on the chart. Pivot Color - R1-R4, Pivot and S1-S4 horizontal line colors.
Stati

Micro ******************* Секундные графики MT5 ********************** Более точного инструмента для входа в сделку вы не найдёте. Входные параметры: Timeframe, sek - период построения графика, секунды Displayed bars - отображаемые бары Step of price levels, pp, 0-off - шаг отрисовки ценовых уровней, пункты Scale points per bar, 0-off - масштаб в пунктах на бар Show lines - отображение текущих уровней Show comment - отображение комментария Standard color scheme - стандартная цветовая сх
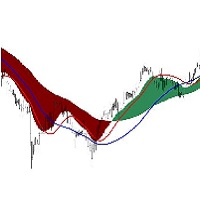
The Visual MACD Indicator is a forex technical analysis tool based on Moving Average Convergence Divergence, but it is plotted directly on the main trading chart with two macd signals. You should look for buy trades after the yellow line crosses the blue line and the MACD wave is blue. Similarly, you should look for sell trades after the yellow line crosses the blue when the MACD wave is red and the price is below the blue line . Go ahead and add it to your best trading system. It fits all

FXC iMACD-DivergencE MT5 Indicator
This is an advanced MACD indicator that finds trend-turn divergences on the current symbol. The indicator detects divergence between the MACD and the price movements as a strong trend-turn pattern.
Main features: Advanced divergence settings
Price based on Close, Open or High/Low prices Give Buy/Sell open signals PUSH notifications
E-mail sending Pop-up alert Customizeable Information panel Input parameters: MACD Fast-EMA: The Fast-EMA variable of the MACD

GIVE A LOOK TO MY OTHER PRODUCTS ! 100 % PER MONTH PROFIT---- MY NEW SIGNAL HERE -------> https://www.mql5.com/en/signals/2162238?source=Site+Signals+My# MACD Cross Alert is a tool indicator that notificate directly to your phone whenever the signal line crosses the base line. For more accurate signals,crosses are filtered like this : Buy Signal : SIGNAL LINE CROSSES ABOVE BASE LINE AND BOTH ARE ABOVE THE 0 VALUE Sell Signal : SIGNAL LINE CROSSES BELOW BASE LINE AN

Данный индикатор вычисляет формулу MACD для объемо-ориентированных индикаторов Accumulation/Distribution и OnBalance Volumes . Помимо тиковых объемов он поддерживает расчеты со специальными псевдо-реальными объемами, эмулируемыми для символов Форекс, где реальные объемы не известны. Подробности о данных "суррогатных" объемах можно узнать в описании других индикаторов - TrueVolumeSurrogate и OnBalanceVolumeSurrogate (алгоритм последнего используется внутри MACDAD для подготовки значений AD и OBV

**Инструмент для определения потенциальных точек разворота и направления тренда**
Этот инструмент отлично подходит для выявления возможных точек разворота и направления тренда на рынке. Он хорошо совместим с такими подтверждающими индикаторами, как MACD, Stochastic, RSI - стандартные индикаторы, доступные на всех платформах MT5. Вместе с ними он формирует надежную стратегию. В настройках можно регулировать расстояние и период канала.
Рекомендуется входить в сделку, когда сигнальная линия пе
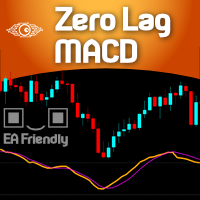
For those who are fans of the traditional MACD ( Moving Average Convergece/Divergence ) indicator, here it is a way faster indicator that could be very useful for intraday trading. Of course it could be used in higher timeframes, with the proper settings. Here at Minions Labs we always encourage traders to calibrate every single indicator you have to extract and distill every drop of good information it has for you. And this is the case with this speedy friend... This Zero Lag MACD could be used
The Moving Average Convergence Divergence Indicator (MACD) is both a trend–seeking and momentum indicator which uses several exponential moving averages set to closing prices to generate trading signals. This Version brought to you the Stochastic confluence filtering the signals, this set ups amazing entries on índices and stock futures trading.
We added many types of alerts plus the Delay Cross Filter to aid in your search for better opportunities in the market.
Product Features Sound aler

Description: TrendAccess can optimize your trading time by showing you the trend via two different calculation modes quick and easy.
No more searching for Trends. Just open the chart and look at the trend display.
Features: Shows Uptrend, Downtrend and "No Trend" indicator
Shows the calculated ZigZag Profile
Works on all timeframes Two different calculation Modes (MACD and Candle-based calculation)
Settings: Variable
Standard Value Description
Calculation Mode
Candle based
C

Этот многосимвольный индикатор приборной панели может отправлять оповещения при обнаружении сильного тренда. Это можно сделать, создав информационную панель с использованием следующих индикаторов/осцилляторов (далее упоминаемых только как индикаторы): RSI, Stochastics, ADX, CCI, MACD, WPR (процентный диапазон Вильямса, также называемый Williams %R), ROC (ценовой диапазон). скорость изменения) и осциллятор Ultimate. Его можно использовать со всеми таймфреймами от M1 до MN (он может показывать тол

MACD divergence signals MACD is called Convergence and Divergence Moving Average, which is developed from the double exponential moving average. The fast exponential moving average (EMA12) is subtracted from the slow exponential moving average (EMA26) to get the fast DIF, and then 2× (Express DIF-DIF's 9-day weighted moving average DEA) Get the MACD bar. The meaning of MACD is basically the same as the double moving average, that is, the dispersion and aggregation of the fast and slow moving a

Представляю индикатор для профессионалов. Prof MACD по виду и своим функциям сильно напоминает классический MACD , но строится на абсолютно иных алгоритмах (к примеру, у него только один период усреднения) и более робастный, особенно на малых таймфреймах, поскольку фильтрует случайные блуждания цены. Классический индикатор MACD ( Moving Average Convergence/Divergence ) — это следующий за тенденцией индикатор, основанный на соотношении между двумя скользящими средними, а именно EMA
Индикатор арахиса
Этот индикатор указывает тренд толстой синей и красной ЛИНИЕЙ на основе золотого креста, мертвого креста и MACD. Вы можете свободно настраивать число в настройках параметров (период скользящей средней, значение MACD).
Таким образом, вы можете настроить этот индикатор в соответствии с типом вашей торговой валюты, периодом и т. Д. Номер этого индикатора по умолчанию подходит для торговли USD / JPY M30 или H1.
КАК ИСПОЛЬЗОВАТЬ ЗЕЛЕНАЯ ЛИНИЯ: ПОДЪЕМ, КУПИТЬ КРАСНАЯ ЛИНИЯ: ПАД

Description This addon is originated from my own trading. I spent my whole time waiting for signals and just wanted a notification when a specific signal appears. So i started to wrote my own addon and called it "LifetimeSaver", because thats exactly what it is for me. But because this addon should not only be for my personal trading, I extended the LifetimeSaver and now its highly customizable, so that it can fit your needs.
Functions: Notification at your defined target/signal Notificatio

This indicator plots in the candles the divergence found in the selected indicator and can also send a notification by email and / or to the cell phone.
Works on all TIMEFRAMES. Meet Our Products
He identifies the divergences in the indicators:
Relative Strength Index (RSI); Moving Average Convergence and Divergence (MACD); Volume Balance (OBV) and;. iStochastic Stochastic Oscillator (STOCHASTIC).
It is possible to choose the amplitude for checking the divergence and the indicator has

This indicator Allow you to get notification from 7 indicators. Scan all your favorite pairs with your favorite technical indicator, and get notified on your preferred timeframes.
Settings are Customizable
(RSI, ADX, MACD, Alligator, Ichimoku, Double MA, and Stochastic)
Click to change the time frame or open new pairs
Notification: Phone/Popup/Email
Узнайте, как легко и просто купить торгового робота в MetaTrader AppStore - магазине приложений для платформы MetaTrader.
Платежная система MQL5.community позволяет проводить оплату с помощью PayPal, банковских карт и популярных платежных систем. Кроме того, настоятельно рекомендуем протестировать торгового робота перед покупкой, чтобы получить более полное представление о нем.
Вы упускаете торговые возможности:
- Бесплатные приложения для трейдинга
- 8 000+ сигналов для копирования
- Экономические новости для анализа финансовых рынков
Регистрация
Вход
Если у вас нет учетной записи, зарегистрируйтесь
Для авторизации и пользования сайтом MQL5.com необходимо разрешить использование файлов Сookie.
Пожалуйста, включите в вашем браузере данную настройку, иначе вы не сможете авторизоваться.