Смотри обучающее видео по маркету на YouTube
Как купить торгового робота или индикатор
Запусти робота на
виртуальном хостинге
виртуальном хостинге
Протестируй индикатор/робота перед покупкой
Хочешь зарабатывать в Маркете?
Как подать продукт, чтобы его покупали
Платные технические индикаторы для MetaTrader 5 - 26

Ценовой канал - это основной инструмент трейдера для анализа текущей ситуации на рынке. С его помощью можно успешно прогнозировать будущее поведение цены, однако основным фактором получения прибыли являются своевременно принятые решения. Зачастую это и является проблемой, потому что постоянно смотреть в монитор просто невозможно. Данный индикатор строит и обновляет автоматически два трендовых канала с разными периодами(быстрый и медленный). Определение тренда осуществляется при помощи линейной
Это классический вариант реализации экспоненциальной скользящей средней с коррекций ошибки, какой используется в индикаторах DEMA и TEMA. Соответственно названию, глубина коррекции ошибки увеличена до 33. Индикатор оптимизирован. Потребляет минимально возможные ресурсы. Достаточно быстр, учитывая объёмность вычислений. Может накладываться на другие индикаторы. Как и обычные скользящие средние, nEma_33 не перерисовывается (за исключением нулевого бара). Требуется история > Период*33*33. Согласно
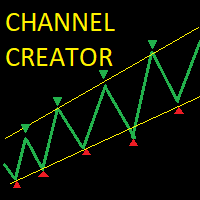
The auto-channel indicator creates a top line and bottom line that encloses a channel within which the symbol has been trading. The channel is created by finding high points for the top line and low points for the bottom line, these points are shown with arrows. A line of best fit is then plotted through these points and extended until the end of the chart. This indicator is useful for trading both within the channel and for breakouts. Inputs: MAPeriod - The moving average period over which the
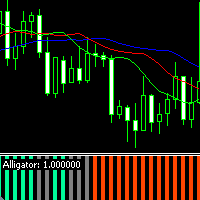
Модифицированный индикатор Alligator, выполнен в виде осциллятора. Облегчает анализ показателей индикатора Alligator, сигнализируя трейдеру об изменениях рынка с помощью цветной гистограммы. Значения цветов гистограммы
Зеленый (Medium spring green) - восходящий тренд Оранжевый (Orange red) - нисходящий тренд Серый (Gray) - боковое движение (флет) Значение параметров jaw_period - период челюстей teeth_period - период зубов lips_period - период губ jaw_shift - смещение челюстей teeth_shift

Индикатор связывает цену по циклично-волновой зависимости. Таким образом, все точки пересечения будут оптимальными точками, в которых изменяется движение с учетом периода индикатора. Точки пересечения можно использовать как точки потенциального разворота рынка. Но не надо забывать, что подход должен быть комплексным, сигналы индикатора требуют дополнительной информации для входа в рынок.
Подходит для форекса, фьючерсов и бинарных опционов без перерисовки. Подает много сигналов, что требует на
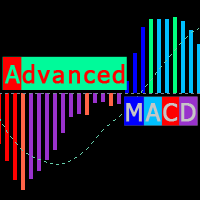
Модифицированный MACD, для технического анализа графиков, с цветовыми обозначениями изменений гистограммы. Индикатор подсвечивает, направление движения гистограммы, изменение направления движения гистограммы, пики гистограммы, взаимодействие гистограммы и сигнальной кривой. Также, индикатор облегчает поиск конвергенций/дивергенций между барами и гистограммой, (которые служат мощным сигналом в некоторых торговых системах с использованием индикатора MACD). Цветовые обозначения сигналов гистограммы

Clear Dom
This Indicator shows a pressure color box based on depth of market of the current symbol. Notice that it only works when book information is received.
You decide weather you want or not to display higher (ask) and lower (bid) levels of book.
The proportion ratio is calculated using volumes read from the book. You can read the actual pressure in the market any time.
Indicator parameters: color_Ask -> ASK box color and ASK value line color color_Bid -> BID box color and BID valu

This indicator shows supports and resistences calculated form historical data when market was swing. When market was swing ? When ADX was below 25 for some bars. In fact market can be considered without a trend. I mean and suggest timeframes H4 and Daily. Using that lines in the present you see resistance and support. More lines are distant and best is possible profit. Every ADX parameters can be set, so colors, swing market bars number.
I am available to get feedback or modify code. Thanks Al

Этот индикатор строит проекцию старшего таймфрейма на текущий таймфрейм. Визуализация в виде свечей. Помогает лучше понять процессы внутри рынка и его масштаб. Упрощает поиск свечных паттернов. Есть возможность включать несколько индикаторов с разными параметрами и видеть одновременно много таймфреймов. В настройках доступны изменение цвета свечей каждого из направлений и их толщина. Важно! Если индикатор ничего не рисует, то либо параметр таймфрейм выбран не верно (он должен быть больше чем те

1. What is this Rising volatility and falling volatility are not the same, whether it is academic research or actual testing has shown this point. The original ATR indicator is calculated by putting up and down fluctuations together. This indicator is to calculate separately the upward volatility and the downward volatility, which can better help you study the market.
2. Indicator description There are two modes for the calculation of this indicator, as shown in the f
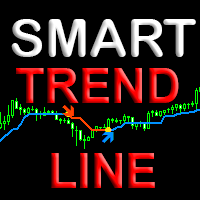
Индикатор с уникальным авторским алгоритмом определения направления тренда. Показывает лучшие результаты определения тренда на любых валютных парах, акциях, криптовалюте без перерисовки результата. Имеет встроенную статистику, что поможет сразу определить прибыльность текущей пары и таймфрейма. Использует паттерны Price action в связке с уникальным алгоритмом фильтрации. Подходит как новичкам так и профессионалам для всех видов торговли. Как выбрать прибыльный таймфрейм и оптимизировать индикато

Stochastic Cross Arrow is an indicator that automatically places arrow when stochastic K and D line crosses each other on a certain level.
Buffer Guide For Developers: Buffer 0 =Buy Arrow Buffer 1 =Sell Arrow Inputs: ---Stochastic Settings--- %K - %K value. %D - %D value. Slowing - Slowing value . Stochistic Method - Moving Average method. It can be any of enumeration values. Newbar - arrow only appear on new bar. Buy_Msgs - type info message when buy arrow appears. Sell Msgs - type inf
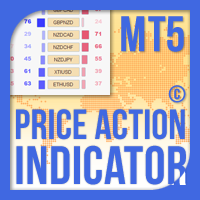
Индикатор Price Action Indicator MT5 рассчитывает баланс уровней силы покупки / продажи любого символа / инструмента на основе чистых данных о ценовом действии указанных (8 по умолчанию) прошлых свечей. Это даст вам наиболее точное представление о настроении рынка, отслеживая ценовое действие 32 символов / инструментов, доступных на панели индикатора. Уровень силы покупки / продажи более 60% дает достаточно надежный уровень для покупки / продажи определенного символа (с использованием настрое

The Pirates MACD is a Momentum Indicator that shows us not just the Classical MACD, it also shows us high priority trades. the user has an option of selecting among several options the best settings that suits their trading style, even if one has no trading style, Pirates always find a way to survive hence the Pirates MACD is equipped with easy to understand tools. that reduce the strain on ones analysis giving them visual advantages over classical MACD techniques.
This product is made as an
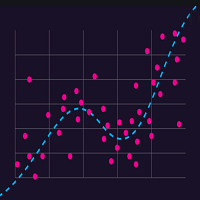
Канал Регрессии состоит из двух линий, равноудалённых сверху и снизу от линии тренда регрессии. Расстояние между границами канала и линией регрессии равно значению отклонения максимальной цены закрытия от линии регрессии, только это определение соответствует самим свежым точкам регресии.
Термин регрессии относится к области статистики. Центральная линия канала является линией тренда. Для ее расчета используется метод наименьших квадратов. Линия, расположенная выше центральной, выступает сопр

The utility helps to locate in the lower time frames the maximum and minimum of the upper time frame. The length of time frame level line represents the temporal length of the upper time frame. It's possible to OnOff the levels with a button or keys
The indicator draws lines that delimit the upper time frames candle and highlights his high-low price and the pips candle range. How it works:
Firstly . Choose which time frames levels to represent in the lower ones : monthly, weekly, da
Unlike a standard moving average, trendy traders unique algorithm will show you a less choppy signal resulting in a smoother and easier trend to follow thereby making your trading decisions more confident. Put simply when price moves above the average it signals a bullish trend and when price moves below the average it signals a bearish trend. The trader is then given 2 levels of take profit and a stop loss on each new signal. It can also be added to other trend-following systems for better pe

the indicator will show signal arrows on the graph at the crossing of Awesome Oscillator base level it has push and audible alerts and Email alert. By crossing above base level , a blue arrow will come out for the BUY, at the same time an audible signal will sound. By crossing Below base level, a red arrow will come out for the SELL, at the same time an audible signal will sound. Possibility to deactivate push and audible alerts.
MT4 version : Buy the 'Awesome cross' Technical Indicator for

Индикатор "Tiger" показывает развороты рынка. Основан на индексе относительной бодрости (RVI).
Представлен в виде осциллятора, который показывает энергию текущего ценового движения и отражает уверенность ценового движения от цены открытия к цене закрытия в диапазоне максимальных и минимальных цен за данный период. Это, в свою очередь, даёт трейдеру возможность находить точки разворота с большой вероятностью.
Не перерисовывает!
Хорошо показывает себя на боковом движении рынка, которое п

Brief description The ContiStat indicator calculate statistic frequency of green (up) and red (down) movement in the chart and determine movement dynamics (silver curve). There are two key parameters to understand the ContiStat principle: Block height and Block count . The ContiStat engine convert instrument price chart move to Blocks of constant height (price) regardles of how much time it take. Example 1: Block height is set to 50. DE30 index price make move from 15230 to 15443 in an hour. 4 g
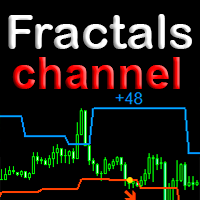
Трендовый индикатор с уникальным алгоритмом определения смены тренда. Для определения тренда использует Price Action и собственный алгоритм фильтрации. В основе алгорима используется ценовой канал по фракталам графика. Такой подход помогает точно определять точки входа и текущий тренд на любом таймфрейме. Без задержек распознать новый зарождающийся тренд с меньшим количеством ложных срабатываний. Особенности
Преимущество индикатора заключается в том, что его период динамический. Так как привяза

Info: marcobarbosabots
Pivot lines are an easy way to see market trend. The indicator provides the pivot line and three first support and Resistance lines.
Calculations used was:
Resistance 3 = High + 2*(Pivot - Low) Resistance 2 = Pivot + (R1 - S1) Resistance 1 = 2 * Pivot - Low Pivot point = ( High + Close + Low )/3 Suport 1 = 2 * Pivot - High Suport 2 = Pivot - (R1 - S1) Suport 3 = Low - 2*(High - Pivot)
You can use the calculated values on an EA too, just make sure the indicator
The Qv² Trend is an indicator that aims to identify trends.
Buying trend signals are indicated by arrows pointing up.
Selling trend signals are indicated by arrows pointing down.
It can be used in all deadlines.
It can be used in all pairs.
I use it on the H1 with a period of 24. Important Recommendation: Make sure you trade in trend market. Good Trades, in trend market
KF CROSS 3MA
This indicator show the collision points of moving averages in a separate window. so we will have a solitude chart. Features indicator: Show alert in Meta Trade Send notification to mobile Adjustable 3 MA (Fast-Middle-Slow) Can be used on all symbols Can be used in all time frames
Attention, the application does not work in the strategy tester
You can download the Demo version on the comments page : https://www.mql5.com/en/market/product/81152?source=Site
or cotact us : ht

Перед вами индикатор, который совершит революцию в торговле синтетическими индексами BOOM на торговой платформе Deriv mt5.
Бог Спайк Бум .
Основные характеристики:
Работает только в индексах BOOM. Есть трендовый фильтр. Отправляйте оповещения только тогда, когда рынок растет. Звуковые оповещения. Вы можете отправлять оповещения на мобильный.
Как пользоваться:
Применять во временных диапазонах m1 и m5. Дождитесь звукового оповещения. Проанализируйте, есть ли сильный тренд или

An customize Indicator by which you can have Triple moving averages at close prices and send push notification on each crossing. This indicator is especially useful when you are doing manual trading. Notes: Cation: forex trading is a very risky business,... don't invest the money you cannot bear to lose. the probability of losing is high ... more high aaaand exponentially high.... something like EMA enjoy losing with us...

This is a multi-symbol and multi-timeframe table-based indicator designed for a candlestick patterns detection with 46 patterns for META TRADER 5. Each formation has own image for easier recognition. Here you find most popular formations such as "Engulfing", "Hammer", "Three Line Strike", "Piercing" or Doji - like candles. Check my full list of patterns on my screenshots below. Also you can not only switch all bearish or bullish patterns from input, but also select formation for a specified symb
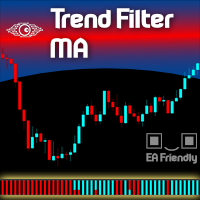
One of the best tools category for an Expert Advisor is the Filtering System . Using a filter on your entries will take your metrics to the good side. And even when you trade manually a filtering system is more than welcome. Let us present a commonly used filtering system based on Exponential Moving Averages - in fact, you can choose the type of the MAs as you wish and also mix them all up - we called this indicator Filter Trend MA . We present this indicator as a colored strip you can use at th

Прекрасно дополнит актуальной информацией ваш работающий советник или торговлю вручную.
Предусмотрено звуковое оповещение превышения установленных лимитов прибыли и убытка открытых ордеров SELL и BUY. Причем для каждой валютной пары EURUSD, GBPUSD, XAUUSD, и остальных выводятся различные звуковые оповещения на английском языке.
Показатели выводятся на специальной панели на графике с момента активации индикатора: Прошедшее время Накопленная прибыль
Текущая прибыль Максимальная просадка Текуща

Индикатор Bridge отображает на графике сигналами потенциальные точки на вход (точки абсолютного разворота по тренду).
Алгоритм форекс индикатор Bridge был создан на основе оригинальных индикаторов поиска экстремумов, индикатор хорошо подходит для определения разворота или большого резкого рывка в одну из сторон благодаря ему вы будете знать когда такое произойдет он вас уведомит появлением точки синего цвета на покупку красного на продажу. Индикатор по определенному алгоритму квалифицирует на
This indicator is based on the same famous fractal indicator with a slight difference:
MetaTrader version 4 click here
Advantages:
Works on all instruments and time series,
Does not redraw its results,
Comparison depth is adjustable,
Works well with any popular strategy,
Adjust the power of fractals
Input settings:
Number of comparisons - The number of candles that each side selects for comparison.
Marker distance from the candlestick
You
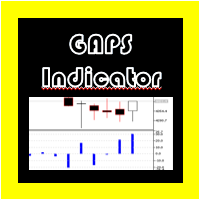
Индикатор GAPS для Метатрейдера 5
Для некоторых стратегий, используемых в индексах, акциях и других активах, обычно измеряется GAP каждой свечи, но если мы хотим сделать это вручную, это может привести к ошибкам в расчетах.
По этой причине был создан «Индикатор GAP», который автоматически показывает значение PIPS каждого из GAPS, представленных между каждой из свечей, и генерирует сигнал тревоги при их появлении, если опция активирована.

(Автоперевод) Большинству трейдеров известен знаменитый японский индикатор Хейкин-Аши , созданный в 1700-х годах Мунехисой Хоммой . Иногда его пишут Heiken-Ashi , но его значение остается прежним, а именно «средний бар» по-японски. Это реализация очень известного индикатора Heikin Ashi , но с несколькими дополнительными функциями. Во-первых, он позволяет взвешивать его значения по объему , будь то объем тиков , реальный объем или псевдообъем на основе истинного диапазона. Основное преимущество з

Indicator that shows you at any time the current number of closed deals as well as profit and loss totals of the closed deals of the account that you're logged into for a configurable period.
To do this, it is best to load Deals and "Complete history" in the account history in the terminal and then enter the desired period in the indicator (e.g. 2022.01.01-2023.01.01 would be for calendar year 2022).
Input options:
- Period (Attention: corresponding data must be loaded into the account h
This indicator is based on ParabolicSAR. This indicator does not change the trend easily and does not change the trend until it receives a clause and approval. This indicator can be used for trail stop or trend detection.
MT4 Version
benefits:
Works on all instruments and time series,
Does not redraw its results,
Comparison depth is adjustable,
Works well with any popular strategy,
The power of the areas is adjustable,
We assure you that we we
Индикатор - HotKeys позволяет сделать работу в терминале МТ5 более комфортной Возможности индикатора:
- Вызов создания объекта на графике быстрыми клавишами
- Включение/отключение автопрокрутки
- Быстрое переключение между основными пользовательскими шаблонами Предустановленные быстрые клавиши:
- Прямоугольник - Q
- Фибо - E
- Горизонтальный уровень - R
- Отрезок - T
- Автопрокрутка - A
Вы можете назначить другие быстрые клавиши (только заглавные буквы английского алфавита) Важно

Hello Traders
I have created this indicator to Catch SPIKES on Crash1000, Crash500 and Crash300. Follow the below mention instruction for better Result
1. When Red arrow pop up on the Chart, Take a Sell entry
2. Stay in trade until price break below from entry
3. Do not hold trades after all trades went in Blue
4. Keep adding position until spike cross below from intial entry
See Example for more assistance

Индикатор помогает зайти в сделку по тренду, при этом, после некоторой коррекции. Он находит сильные трендовые движения валютной пары на заданном количестве баров, а также находит уровни коррекции к этому тренду. Если тренд достаточно сильный, а коррекция становится равной заданной в параметрах, то индикатор сигнализирует об этом. Можно устанавливать разные значения коррекции, лучше подходят значения 38, 50 и 62 (уровни Фибоначчи). Кроме этого, можно настраивать минимальную длину тренда, колич

Система для визуализации популярных шаблонов ценовых формаций. После подключения индикатор автоматически отобразит на графике следующие формации: Пиноккио бар (“пинбар”) - свеча с небольшим телом и длинным “носом”, очень известный разворотный шаблон; Внутренний бар - свеча, диапазон которой лежит внутри диапазона предыдущей свечи. Такая формация представляет неопределённость рынка; Внешний бар - свеча, диапазон которой превышает диапазон предыдущей свечи. Такая формация представляет неопре

This simple, yet powerful indicator is very good way to determine actual S/R levels. It's main purpose is making your overview on markets much better.It has built-in arrow signal system, which should be used along with MT indicators for best results.Just try it.
Recommended MT indicators to use along:
Bollinger Bands (default) RSI (period 3, levels 10/90)

Добавьте этот индикатор на график и установите ExtDepth Setting ZigZag.
Он дает мгновенное оповещение, когда цена касается линии тренда Верхнего, Нижнего или Среднего канала.
Функции :
-Включить / отключить оповещения в верхней, нижней или средней строке - Добавить паузу после оповещения в секундах - Приостановить или возобновить канал тренда с помощью кнопки на графике - Добавьте ранние оповещения, добавив пункты в поле ввода, например, цена ETH составляет 2900,25, здесь цифры 25 - это «т

BeST Swing Strategy MT5 is a Metatrader indicator based on the corresponding Jim Berg's work about volatility as described in his article "The Truth About Volatitlity" (TASC 2/2005).The indicator consists of 2 channel lines deriving as (MA+/- times the ATR) and can be used as a standalone trading system.The outlier prices of the Market as of the indicator's values can be used for producing Entry and Exit Signals.
Advantages of the indicator
== Uses 2 Swing Strategies
== Never repaints it
PAX BDB Trade Chaos system of Bill Williams (Bearish/Bullish divergent bar). One of the signals of the "Trade Chaos" system of Bill Williams. (First wiseman)
When bar moving away from the "Alligator" indicator and there is divergence on the Awesome Oscillator indicator, it shows a potential point of movement change.
It is based on the opening/closing of the bar, the position relative to the previous ones, the Alligator and AO.
When trading, the entrance is at the breakthrough of the bar(sh
This indicator is mainly used for my SuperDonchain EA but can also be used as a simple indicator. It draws a donchain channel in the chart window. It has various setting options which affect the graph. Furthermore, the colors of the graph can be adjusted. Simply copy it into the indicators folder and drag it from there into the chart window https://www.mql5.com/de/market/product/78025?source=Unknown%3Ahttps%3A%2F%2Fwww.mql5.com%2Fde%2Fmarket%2Fmy
This indicator is mainly used for my SuperDonchain EA but can also be used as a simple indicator. It draws a simple supertrend on the chart window. It has various setting options which affect the graph. Furthermore, the colors of the graph can be adjusted. Simply copy it into the indicators folder and drag it from there into the chart window. https://www.mql5.com/de/market/product/78025?source=Unknown%3Ahttps%3A%2F%2Fwww.mql5.com%2Fde%2Fmarket%2Fmy

The indicator draws lines (with line objects) to the close prices of the last closed bars, on selected timeframes. Parameters
Close line 1 close price timeframe - timeframe of the 1st close price Close line 1 color - color of the 1st close price Close line 1 width - width of the 1st close price Close line 1 style - style of the 1st close price Close line 1 max count - the maximum number of lines plotted for the 1st close price, considering the selected timeframe in Close line 1 timeframe parame
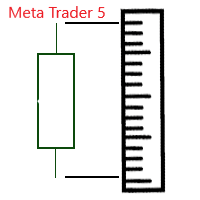
Индикатор отображает размер бара и его направление. ---------------------------------------- Цвета гистограммы: * Красный - Медвежий бар.
* Зелёный - Бычий бар.
* Серый - Цена открытия и цена закрытия равны. * Синяя линия - скользящая средняя.
---------------------------------------- Параметры: - Type of Calculation - Тип расчёта ( High - Low, Open - Close ) - Moving Avarage - Период скользящей средней - Method for MA - Метод усреднения скользящей средней

Индикатор тренда волатильности индекса.
Основные характеристики:
Он используется только для синтетических индексов в брокерах Binary или Deriv, которые одинаковы. Есть трендовый фильтр. Он имеет звуковое оповещение, чтобы предупредить о возможном падении цены. Он может отправлять вам мобильные оповещения, если вы поместите его на VPS. Он настроен на алгоритм L566b12, который разработан для повышения эффективности.
Как пользоваться индикатором
Он работает в темпоральности М1. Тр

TrendHunt is an indicator focus on higher timeframe (H1 and Above) It using breakout strategy, plus MA for filter. Check for Support, Resistance and News before every entry to increase the success rate.
Parameters Moving Average Period - 200 Moving Average Price - Closed Price Entry Period - 20 (Breakthrough 20 High for Long, 20 Low for short) Stop Period - 10 (cross over 10 low for exit long)

Indicator Constant TF Moving Average basically is the same Moving Average indicator, but differently it always shows the price values of chosen time frame. Also, number of periods to show can be selected. Indicators purpose is to use it as support and resistance level in smaller time frames than selected in Input menu. How it looks like you can see in screenshots and video. ---------Main settings-------- Timeframe - choose time frame from dropdown menu Number of periods to show - enter the integ

Upgraded version 3.4 Supply and Demand Indicator , it determines levels of supply and demand by using algorithm such as order blocks , engulfing candle patterns , etc. Signals are visually indicated when the levels are drawn on the chart
Trendline touch and Candle Strick Patterns can also play a role to add as confluence when making trading decisions including `reversal patterns` etc Compatibility : All tradable Instruments ; Currency Pairs, Synthetic indices ,Metals, Crypto, NASDAQ et

The indicator, Big Candle Detect , is based on ATR and Volume to detect candlesticks of buying and selling strength, which is represented through an oscillator indicator. With this indicator you will be able to identify the lateral market, providing better entries according to your strategy.
Big Candle Detect highlights candles with brighter colors when the condition is found, making it easier to identify, in addition to being fully compatible for automation in your EA.
SETTINGS
ATR P
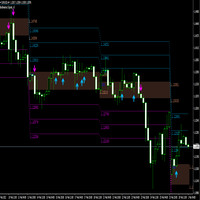
A breakout refers to when the price of an asset moves above a resistance area, or moves below a support area . Breakouts indicate the potential for the price to start trending in the breakout direction. For example, a breakout to the upside from a chart pattern could indicate the price will start trending higher. The indicator works with arrows in case of breakthrough, you also have a level of 1 tp, a level of 2 tp, a level of 3 tp. For more information, welcome to our Telegram Group. https:
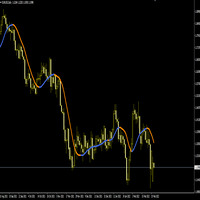
The Hull Moving Average (HMA) attempts to minimize the lag of a traditional moving average while retaining the smoothness of the moving average line. Developed by Alan Hull in 2005, this indicator makes use of weighted moving averages to prioritize more recent values and greatly reduce lag. The resulting average is more responsive and well-suited for identifying entry points. For more information, welcome to our Telegram Group. https://t.me/InfinXx
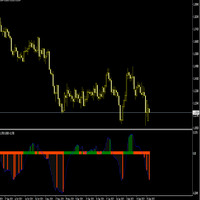
The Slope indicator measures the slope of a linear regression , which is the line of best fit for a data series. A 20-period Slope, therefore, measures the slope of a 20-day linear regression. ... In general, a positive slope indicates an uptrend, while a negative slope indicates a downtrend. How do you use slope Indicator?
By applying the slope indicator to both the price chart and the price relative , chartists can quantify the price trend and relative performance with one indicator. A po

Обозреватель паттернов для паттерна треугольника, такого как симметричный треугольник, асимметричный треугольник или прямоугольный треугольник, паттерна клина, такого как восходящий клин или падающий клин, паттерна расширения и канала тренда.
Этот индикатор исследует исторические паттерны, а также текущие паттерны. Это лучший индикатор для тех, кто пытается сэкономить время, вручную рисуя линию тренда или треугольник, и хочет использовать это для автоматического анализа построения лучших патт
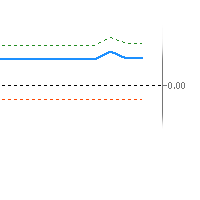
An imbalance indicator that marks imbalance on the chart with zones and gives the amount of imbalance as an oscillator value. There's one line for the amount of short imbalance, one line for the long imbalance and the combined imbalance as a thicker line. The combined imbalance goes above 0 if there's more imbalance above than below the current price and vice versa. The blue thicker line, shows (imblance above - imbalance below). The greeen dotted line shows imbalance above The red dotted line s
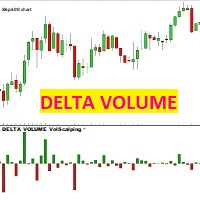
ДЕЛЬТА ОБЪЕМА Volscalping Этот индикатор для каждой ценовой свечи рисует дельта-свечу, которая представляет собой разницу между купленными и проданными контрактами. Свеча будет красной и отрицательной, если контракты, торгуемые по цене бид (проданы), превышают контракты по аску, и наоборот, свеча будет зеленой и положительной, если контракты, торгуемые по аск (покупаются), превышают контракты по ставке.
ВНИМАНИЕ: Индикатор работает только с брокерами, которые обеспечивают реальный поток рыно
The indicator, Support and Resistance Detect Signal automatically detects support and resistance levels and trend lines, emitting a signal whenever the condition is met, as configured.
It reads support and resistance drawn manually or automatically built into the chart by other external indicators.
Note: Support and Resistance Detect Signal is compatible with almost all external indicators that draw on the chart, support and resistance levels, in addition to trend lines.
Discover our Elit

The indicator "JAC Trend Color Candle" for Meta Trader 5, was created to visually facilitate the trend for the trader. It is based on three parameters, which identifies the uptrend, downtrend and non-trending market. The colors are trader-configurable, and the average trader-configurable as well. trend parameters cannot be configured as they are the indicator's differential.

Element - стрелочный индикатор Форекс, реализует разновидность технического анализа, основанную на идее о том, что рынок имеет циклическую природу. Отслеживает рыночный тренд с хорошей надежностью, игнорируя резкие колебания рынка и шумы вокруг средней цены. Таким образом, все точки пересечения будут оптимальными точками, в которых изменяется движение с учетом периода индикатора. Ловит тренд и показывает благоприятные моменты входа в рынок стрелками. Отображает сигналы просто и наглядно!
Точ

This indicator shows your daily profit for each chart. Please let me know in the comment section or via the MQL5 chat if you want find any problem, or if you want any specific features for this indicator. How to use:
Attach the indicator to the chart you want to see your profit. You can change the color of the indicators. (Currently positive figures are green, and negative are red) You can display the profit for pair it is attached, or for the whole account (all the pairs)
Automatic trend lines. Type 1. With two extremums. 1) From the current bar "go" to the left and look for the first (right) extremum point with the InpRightExmSide bars on both sides. 2) From the first point again "go" to the left and look for the second (left) extremum point with the InpLeftExmSide bars on both sides.
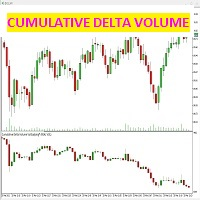
этот индикатор определяет разницу между контрактами, заключенными при покупке и продаже (агрессия) для каждой отдельной свечи.
индикатор показывает в специальном окне под ценовым графиком свечи, точно определяемые разницей между проданными и купленными контрактами, которые генерируют объемную силу рынка.
можно (см. на скриншотах) как выбрать только кумулятивный график дельты свечи, или даже с линией тренда самих свечей: при выборе второго поля u "НЕТ" линия тренда не будет нарисована, а при
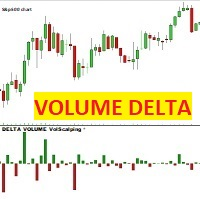
ДЕЛЬТА ОБЪЕМА Volscalping Этот индикатор для каждой ценовой свечи рисует дельта-свечу, которая представляет собой разницу между купленными и проданными контрактами. Свеча будет красной и отрицательной, если контракты, торгуемые по цене бид (проданы), превышают контракты по аску, и наоборот, свеча будет зеленой и положительной, если контракты, торгуемые по аск (покупаются), превышают контракты по ставке.
ВНИМАНИЕ: Индикатор работает только с брокерами, которые обеспечивают реальный поток рыно
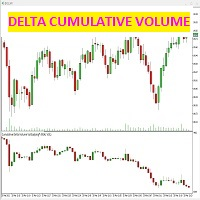
этот индикатор определяет разницу между контрактами, заключенными при покупке и продаже (агрессия) для каждой отдельной свечи.
индикатор показывает в специальном окне под ценовым графиком свечи, точно определяемые разницей между проданными и купленными контрактами, которые генерируют объемную силу рынка.
можно (см. на скриншотах) как выбрать только кумулятивный график дельты свечи, или даже с линией тренда самих свечей: при выборе второго поля u "НЕТ" линия тренда не будет нарисована, а при
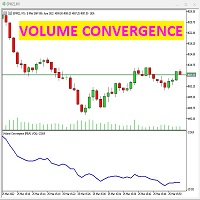
этот индикатор показывает силу реального объема по отношению к цене. если график цены и тренд объема имеют одинаковую тенденцию, значит, все закономерно. если индикатор расходится с ценовым графиком, значит разворот близок. когда цена идет вверх, а график «конвергенции объема» идет вниз, это означает, что деньги уходят с рынка, продавцы продают на подъеме, и цена вскоре должна начать стремительно падать. и наоборот, если график «конвергенции объема» идет вверх, а график цены идет вниз, это озна
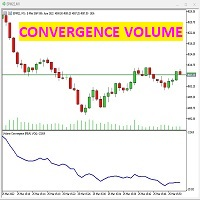
этот индикатор показывает силу реального объема по отношению к цене. если график цены и тренд объема имеют одинаковую тенденцию, значит, все закономерно. если индикатор расходится с ценовым графиком, значит разворот близок. когда цена идет вверх, а график «конвергенции объема» идет вниз, это означает, что деньги уходят с рынка, продавцы продают на подъеме, и цена вскоре должна начать стремительно падать. и наоборот, если график «конвергенции объема» идет вверх, а график цены идет вниз, это озна

KT Risk Reward shows the risk-reward ratio by comparing the distance between the stop-loss/take-profit level to the entry-level. The risk-reward ratio, also known as the R/R ratio, is a measure that compares the potential trade profit with loss and depicts as a ratio. It assesses the reward (take-profit) of a trade by comparing the risk (stop loss) involved in it. The relationship between the risk-reward values yields another value that determines if it is worth taking a trade or not.
Featur
KT Forex Session shows the different Forex market sessions using meaningful illustration and real-time alerts. Forex is one of the world's largest financial market, which is open 24 hours a day, 5 days a week. However, that doesn't mean it operates uniformly throughout the day.
Features
Lightly coded indicator to show the forex market sessions without using massive resources. It provides all kinds of Metatrader alerts when a new session starts. Fully customizable.
Forex Session Timings I
MetaTrader Маркет - торговые роботы и технические индикаторы для трейдеров, доступные прямо в терминале.
Платежная система MQL5.community разработана для сервисов платформы MetaTrader и автоматически доступна всем зарегистрированным пользователям сайта MQL5.com. Ввод и вывод денежных средств возможен с помощью WebMoney, PayPal и банковских карт.
Вы упускаете торговые возможности:
- Бесплатные приложения для трейдинга
- 8 000+ сигналов для копирования
- Экономические новости для анализа финансовых рынков
Регистрация
Вход
Если у вас нет учетной записи, зарегистрируйтесь
Для авторизации и пользования сайтом MQL5.com необходимо разрешить использование файлов Сookie.
Пожалуйста, включите в вашем браузере данную настройку, иначе вы не сможете авторизоваться.