Смотри обучающее видео по маркету на YouTube
Как купить торгового робота или индикатор
Запусти робота на
виртуальном хостинге
виртуальном хостинге
Протестируй индикатор/робота перед покупкой
Хочешь зарабатывать в Маркете?
Как подать продукт, чтобы его покупали
Платные технические индикаторы для MetaTrader 5 - 20

Панель предназначена для быстрого визуального нахождения и отображения внутренних баров по всем периодам и на любых выбранных валютных парах одновременно. Цвет сигнальных кнопок, указывает на направление паттерна. По клику на сигнальную кнопку, осуществляется открытие графика с данным паттерном. Отключить не используемые периоды, можно кликом по его заголовку. Имеется поиск в истории (по предыдущим барам). Прокрутка (scrolling) панели, осуществляется клавишами "UP" "DOWN" на клавиатуре. Имеется

Renko Graph Индикатор Ренко в основном окне графика в месте с текущей ценой. Индикатор отображает изменения цены в форме прямоугольников («кирпичиков») на фоне обычного графика котировок. Движение цены вверх, на заданное в настройках количество пунктов, отмечается добавлением выше предыдущего очередного прямоугольника, а движение вниз — ниже предыдущего прямоугольника. Индикатор создан для наглядного определения основного тренда. Используется для определения ключевых уровней поддержки и сопротив

BinaryPinMt5 - индикатор, разработан и адаптирован специально для торговли краткосрочными бинарными опционами. Алгоритм индикатора, прежде чем выдать сигнал анализирует множество факторов, такие как волотильность рынка, ищет патерн PinBar, расчитывает вероятность успеха при совершении сделки. Устанавливается индикатор обычным способом. Сам индикатор состоит из информационного окна, где отображается имя торгового инструмента, значение вероятности совершения успешной сделки, непосредственно сам с

Price action is among the most popular trading concepts. A trader who knows how to use price action the right way can often improve his performance and his way of looking at charts significantly. However, there are still a lot of misunderstandings and half-truths circulating that confuse traders and set them up for failure. Using PA Trend Reversal will be possible to identify high probability exhaustion moves of a trend. Features The indicator gives alerts in real-time when the conditions are me

Market profile was developed by Peter Steidlmayer in the second half of last century. This is a very effective tool if you understand the nature and usage. It's not like common tools like EMA, RSI, MACD or Bollinger Bands. It operates independently of price, not based on price but its core is volume. The volume is normal, as the instrument is sung everywhere. But the special thing here is that the Market Profile represents the volume at each price level.
1. Price Histogram
The Price Histogram

This is a complete and customizable Trading HUD (Head-Up Display) combining all important tools and information for professional trading in one window. Features:
1. Display key indicators that most professionals consider for their trading decisions Current daily, weekly and/or monthly Pivot Points with 7 Levels (PP, S1, S2, S3, R1, R2, R3) Complete history of daily, weekly and/or monthly Pivot Points Current level of exponential moving averages (EMAs) from different timeframes. The User can de

Description
The base of this indicator is an ZigZag algorithm based on ATR and Fibo retracement. The ZigZag can be drawn like a classic ZigZag or like Arrows or needn't be drawn at all. This indicator is not redrawing in sense that the ZigZag's last shoulder is formed right after the appropriate conditions occur on the market. The shoulder doesn't change its direction afterwards (can only continue). There are some other possibilities to show advanced information in this indicator: Auto Fibo on
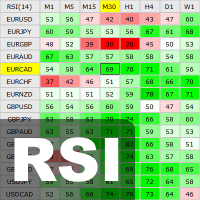
This indicator shows the current RSI values for multiple symbols and multiple timeframes and allows you to switch between timeframes and symbols with one click directly from the matrix. With this indicator, you can analyze large number of symbols across multiple timeframes and detect the strongest trends in just a few seconds.
Features Shows RSI values for multiple symbols and timeframes simultaneously. Colored cells with progressive color intensity depending on the RSI values. Ability to chan
Назначение Индикатор создан для ручной мультивалютной торговли по системе Три Экрана Элдера. Индикатор работает с любыми символами, находящимися в окне Обзор Рынка МТ5, - валютами, металлами, индексами и т.д. Количество инструментов ограничено лишь разрядностью параметров МТ5. Но при желании можно создать несколько окон с разным набором инструментов и параметров.
Принцип работы Индикатор использует модифицированную систему Три Экрана, по которой на третьем экране определяется направление тренд
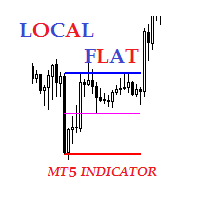
Описание Индикатор локального флета . Индикатор предоставляет возможность поиска локальных флетов в следующих опциях: Ширина каналов не более определенного количества пунктов Ширина каналов не менее определенного количества пунктов Ширина каналов не более и не менее определенного количества пунктов Индикатор отображает середину, верхнюю и нижнюю границы флета. Многократная загрузка индикатора на график с разными диапазонами приводит к отображению системы каналов на графике. Возможные варианты пр
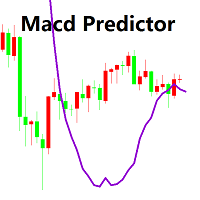
Macd's main chart indicator
1. You can determine the price at which the MACD will change from buy to sell, and vice versa. It is the cousin of the oscillator predictor. If you know a position at the time, then the exact price, current and next (future) columns will need to reach the MACD crossover. You can also see how far the market has to go before your current position is helped or blocked by the next MACD crossover force. You can do this in all time frames because the predictor is updated

Swing Points are those places on the chart where price changes direction. This is an MT5 version of my MT4 Swing Points Indicator. Found on the code base at https://www.mql5.com/en/code/15616 and in the market at https://www.mql5.com/en/market/product/22918
The beginning input parameters allow you to configure your alerts. Turn on screen alerts allows you to turn on and off screen alerts. True is on, false is off. Turn on push to phone alerts allows you to turn on and off push to phone ale

This indicator uses volume and volatility information to indicate the trend or to indicate the market reversion/correction. There are 2 indicators in one. The indicator works in two styles: values per candle and accumulated values. Using the volume and volatility information, when well adjusted, this indicator has a good probability to indicate the right direction, both in lower (M1, M2, M5) and higher (M15, M30) timeframes.
Strategy 1: Trend indicator Indicates the operation direction. To u
Технический индикатор Angry Alligator является расширенной авторский интерпретацией индикатора от B. Williams’а. Данный индикатор имеет такие же принципы работы, что и классический индикатор Alligator и основан на тех же параметрах. Ключевым отличием и преимуществом данного индикатора заключается в том, что в нем реализован дополнительный торговой сигнал в виде ещё одной линии. Продолжая тему B. Williams’а сигнал отображает «укус» котировок индикатором - Alligator’s Bite. Дополнительный параметр
Технический индикатор Awesome Oscillator является классической реализацией торгового подхода Билла Вильямса. Индикатор имеет те же параметры что и интерпретация в МТ5 (отображает дельту между МА с периодом 5 и 34 рассчитанную по средним ценам). Ключевым отличием является графическое отображение каждого торгового сигнала, что позволяет более качественно провести анализ актива и получить звуковое оповещение о появлении сигнала. Торговые сигналы индикатора: 1. Crossed zero line : данный торговый с
Технический индикатор Bollinger Bands классически отображается двумя линиями, которые демонстрируют отклонение котировок от МА 20. Для этого используется стандартное отклонение, параметр которого собственно и задаёт динамику двум полосам. Так как индикатор отображает момент повышенной волатильности на рынке, закрытие котировок за полосами свидетельствует об импульсном направлении рынка или же выхода с длительной зоны проторговки. Таким образом, работа на пробой позволяет войти в момент отклонени

Технический индикатор широко известен читателям и поклонникам стратегии «черепах». Отображается линией по нижней/верхней точке цены за определенный интервал времени. Значение ценового канала также используют для определения зон поддержки и сопротивления. Если котировки актива прорывают и закрываются ниже/выше канала, то это является сигналом работы в сторону пробоя. Способы применения: Индикатор является самодостаточным и не требует дополнительных фильтров для начала работы. Однако для надёжност

Технический индикатор Price Channel & Bollinger Bands является комбинацией двух наиболее популярных канальных индикаторов. Данный индикатор отображает моменты пробоя как каждого канала по отдельности, так и генерирует сигналу в момент одновременного закрытия цен за линиями поддержки/сопротивления. Каждый пробой подсвечивает свечу определенным цветом, что позволяет убрать линии для более комфортной работы с графиком. В случае одновременного пробоя PC и BB, индикатор также отобразит необходимый ма

Технический индикатор Universal Oscillator является комбинацией торговых сигналов самых популярных и широко используемых осцилляторов. Индикатор представлен гистограммами, а также линиями fast и slow MA, что позволяет расширить список получаемых торговых рекомендаций и работать как по тренду, так и в боковом движении рынка. Таким образом, гистограммы позволяют определить момент пробоя ценовых значений и движение в новой фазе рынка, а линии указывают на зоны перекупленности и перепроданности. Ос
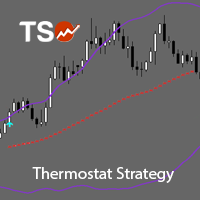
TSO Thermostat Strategy is an indicator that can adapt to the current market conditions by switching from a trend-following mode to a short-term swing mode, thus providing the best possible entry/exit signals in any situation. It is based on the Thermostat Trading Strategy as presented in the book Building Winning Trading Systems with TradeStation by G. Pruitt and J. R. Hill. Strategy The Thermostat Strategy uses different entry and exit conditions based on the current situation of the market
Полезный инструмент, который будет уведомлять вас, когда он обнаруживает возможное движение по объему.
Принципиально в фьючерсах.
Обнаруживает области NO OFFER / NO DEMAND.
Сравните объем свечи в процессе с предыдущими.
Если объем уменьшался, когда текущие контракты превышают предыдущий, ALERT!
- Он может быть загружен в основной графический файл или окна.
- За любую временность.
- Он предупреждает вас всплывающим окном, на котором загорается сигнал тревоги.
- Когда п
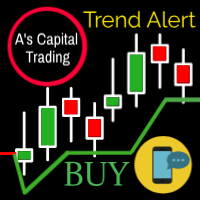
A's Capital Line is a complex algorithm that detects 100% of the trends .
This line marks the following information: The entrance to the trend. Stop of loss. Supports and resistances. When to take Profit.
Send alerts to your cell phone through metatrader It works perfect on any instrument (stocks, forex, crypto, commodities, indices, etc). Also in any time frame to adjust to any trading style. Please see Screenshots for examples and Follow us on instagram. Image 1 Line settings are difere

Мультивалютный и мультитаймфреймовый индикатор Fractals. Отображает последние два фрактала — их последовательность (и кто из них пробит), или же дистанцию между ними. В параметрах вы можете указать любые желаемые валюты и таймфреймы. Также панель может отправлять уведомления при пробое фрактала. По клику на ячейке с периодом будет открыт данный символ и период.
Параметры Calculation of fractals based on — режим поиска фракталов;
— standart indicator — по стандартному индикатору;
— us

KT Momentum Arrows Indicator is based on a momentary breakout which is calculated using the bands deviation and emerging volatility in a certain direction. A buy signal is generated when the price closes above the upper band and a sell signal is generated when the price closes below the lower band. A magnitude coefficient is used as the input which affects the band deviation and volatility at the same time. The coefficient value should be carefully selected and analyzed based on the instrument a

Introduction This indicator detects volume spread patterns for buy and sell opportunity. The patterns include demand and supply patterns. You might use each pattern for trading. However, these patterns are best used to detect the demand zone (=accumulation area) and supply zone (=distribution area). Demand pattern indicates generally potential buying opportunity. Supply pattern indicates generally potential selling opportunity. These are the underlying patterns rather than direct price action. T

Reliable Scalping Indicator RELIABLE SCALPING INDICATOR ( RSI ) As the name implies, this indicator gives reliable BUY and SELL signals on your chart. NO FANCY INDICATORS, NO MESSING WITH YOUR CHARTS. IT DOES NOTHING TO YOUR CHARTS EXCEPT TO SHOW ARROWS FOR BUYS AND SELLS. It DOES NOT repaint and has alerts and notifications which you can allow. It has chart notifications, mobile and email notifications and alerts. THIS INDICATOR PRODUCES ABOUT 85% ACCURATE SIGNALS WHICH IS VERY ENOUGH TO MAKE
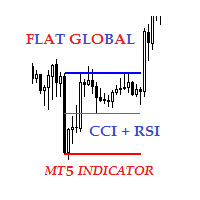
Описание Индикатор локального флета для индикаторов CCI и RSI. Пользователю предоставляется возможность выбора финансового инструмента. Индикатор предоставляет возможность поиска локальных флетов в следующих опциях: Ширина каналов не более определенного диапазона Ширина каналов не менее определенного диапазона Ширина каналов не более и не менее определенного диапазона Индикатор отображает середину, верхнюю и нижнюю границы флета. Возможные варианты применения индикатора показаны на скриншотах. Н
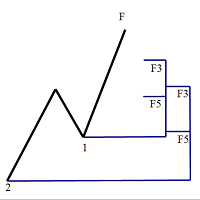
Fibonacci Expansion and Retracement PRO
Fibonacci retracing and extended line tools for the MT5 platform, ideal for traders who use the Golden Section trading Demo: https://www.mql5.com/zh/market/product/35884 The main function:
1. You can draw multiple sets of Fibonacci retracements directly, and the relationship between important return points is clear at a glance.
2. Can draw Fibonacci extensions
3. The Fibonacci foldback and extension of the line can be moved left and right for eas

Панель предназначена для быстрого визуального нахождения и отображения внешних баров по всем периодам и на любых выбранных валютных парах одновременно. Цвет сигнальных кнопок, указывает на направление паттерна. По клику на сигнальную кнопку, осуществляется открытие графика с данным паттерном. Отключить не используемые периоды, можно кликом по его заголовку. Имеется поиск в истории (по предыдущим барам). Прокрутка (scrolling) панели, осуществляется клавишами "UP" "DOWN" на клавиатуре. Имеется Pus

TeaCii trend is a LEADING NON-LAG indicator to trade Ranged Markets or Breakouts. The indicator marks support and resistance at the moment they are formed . It has only one setting for the ATR. We recommend leaving default.
This is not an indicator that draws lines from the highs or lows and regards them as SR. It creates actual SR levels way before the market even shows the level as SR. Often 5 to 10 candles before the naked eye can see it. Look at the first dot and know that SR was declared

Deposit Supercharger: Оптимизированный индикатор тренда Этот индикатор основан на трех технических аналитических индикаторах и двух фильтрах, обеспечивающих более точные сигналы. Описание: Технические индикаторы: Индикатор работает на основе трех технических аналитических индикаторов, которые помогают определить направление тренда и возможные точки разворота. Фильтры: Для фильтрации сигналов установлены минимумы и максимумы цены за последние два дня (уровни поддержки и сопротивления), а также ин

Принцип построения - поверх любого количество баров установленного пользователем строится канал с линиями максимума и минимума таким образом, чтобы бары касались максимума и минимума канала не более и не менее чем в трех точках. Из этого принципа следует название индикатора. Обе вертикальные линии могут перемещаться по графику пользователем, таким образом задавая период, на котором строится канал. После заданного периода рисуются лучи канала, которые задают канал, в котором может двигаться цена

Индикатор FourierExtrapolationMA трансформирует и экстраполирует функцию Moving Average методом Быстрого Преобразования Фурье (Fast Fourier Transformation). 1. Период трансформации устанавливается двумя вертикальными линиями, по умолчанию первая синяя линия и вторая розовая. 2. По умолчанию линия Moving Average (MA) рисуется красным цветом. 3. Путем Преобразования Фурье индикатор строит модель из N гармоник, которая максимально близка значениям МА. Модель по умолчанию рисуетс

This indicator uses VWAP and projects this VWAP into up to 3 levels, shifted by a percentage of the chart's symbol.
How to configure: Choose the symbol and desired graphic time Set the start time of the symbol (in bovespa, WIN and WDO start at 9 o'clock). This time is used as the cutoff reference for VWAP. Check which VWAP period fits the chart better: Ideally, a period when VWAP is not too distant from the chart Set percentage levels: Ideally, you should set levels based on history, so that l

Pivots Points are significant levels traders can use to determine directional movement, support and resistance. Pivot Points use the prior period's high, low and close to formulate future support and resistance. In this regard, Pivot Points are predictive and leading indicators. Pivot Points were originally used by floor traders to set key levels. Floor traders are the original day traders. They deal in a very fast moving environment with a short-term focus. At the beginning of the trading day,

Индикатор рисует канал построенный на уровнях экстремумов баров из старшего периода установленного в настройках, также отображает уровень цен закрытия. Для корректной работы индикатора, текущий период, на который будет установлен индикатор, должен быть меньше установленного периода в настройках индикатора. Описание настроек индикатора: TimeFrame - выбор периода для построения уровней индикатора. По умолчанию установлен дневной период графика. LevelClose - включить или выключить отображение уровн
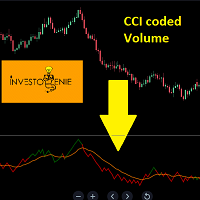
The Indicator is based on Commodity Channel Index (CCI) coded on Volume. The concept is to try and analyze the movement of Volume and Price in a certain direction
Concept:
If the Price of the indicator moves below the threshold price, it turns RED indicating the direction downwards is getting strong.
If the Price of the indicator moves above the threshold price, it turns GREEN indicating the direction upwards is getting strong.
The moving average acts as a great filter to decide entry/exi

Индикатор Advanced Trend Scalper MT5 разработан как для начинающих, так и для профессиональных трейдеров. Индикатор анализирует рынок и формирует сигналы на покупку и продажу. Он не использует никакие другие индикаторы, работает исключительно с ценовым действием. Сигнал появляется сразу после закрытия свечи и не перерисовывается. Эффективный алгоритм обеспечивает высокую степень достоверности таких сигналов. Версия Advanced Trend Scalper для терминала MetaTrader 4 : https://www.mql5.com/ru/m

Самотестируемый и самооптимизируемый и ндикатор Matreshka: 1. Я вляется интерпретацией Теории Волнового Анализа Элиотта. 2. За основу взят принцип индикатора типа ZigZag, а волны строятся на принципе интерпретации теории ДеМарка. 3. Фильтрует волны по длине и высоте. 4. Рисует до шести уровней ZigZag одновременно , отслеживая волны разных порядков. 5. Отмечает Импульсные и Откатные волны. 6. Рисует стрелки для открытия позиций 7. Рисует три канала. 8. Отмечает уровни поддержки и сопротивления. 9

This positions risk visualization indicators, indicators allow you to clearly know price go back will be generated how much account Loss Percent. This is very useful indicator for Controlling Risk when account is open positions, attach this indicator to the chart of the open positions, this indicator will draw three Lines, the three Line of Loss Percent default value is 10% 30% 50% user can define their own Loss Percent value. Loss Percent corresponding Back Point will show in the upper

Индикатор RSI magic kjuta5 .
Пользовательский Индикатор ( RSI magic kjuta ) на основе стандартного Индикатора Силы ( Relative Strength Index, RSI ) с дополнительными настройками и функциями. К стандартной линии RSI добавлены линии максимального и минимального значения RSI на графике. Теперь можно визуально наблюдать прошедшие максимумы и минимумы RSI , а не только значения по закрытию баров, что позволяет избежать путаницы при анализе торгов. Например, советник открыл или закрыл ордер, но

HV Models - Индикатор содержащий в себе 4 метода расчета исторической волатильности выбранного актива. Волатильность - одна из основополагающих величин описывающих изменения базового актива. В статистике ее принято измерять как стандартно - квадратическое отклонение, однако это не единственный вариант. График цены насчитывает 4 величины (Open High Low Close) рассчитывая волатильность по стандартном у индикатору используется лишь одна из данных величин, либо их усреднение, что дает либо искаже

Market Sentiment is an indicator for MT5. Market sentiment is the feeling or tone of a market . Also called investor sentiment, it is generally described as being bullish or bearish : When bulls are in control, prices are going up . When bears are in control, prices are going down . Markets being driven by emotions, the market sentiment is about feelings whereas fundamental value is about business performance .
Settings : Range in bars : numbers of bars used for the calculation, at your own

TeaCii Auto Fibonacci MTF is an implementation of Fibonacci Levels The indicator is simple and yet more powerful than those in the market
IMPORTANT: UNIQUE SELLING POINTS - The Levels are set automatically - You can see ANY TIMEFRAME Levels in ANY Chart. E.g. Watch H1 on M1. Watch M1 on H1 - The Levels are available in Buffers for EA Use - Helps you to get an edge early in by using multi timeframe
Parameters TimeFrame : The timeframe of the indicator. It can be same, higher or lower than t
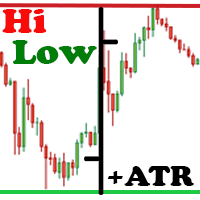
Индикатор Hi Low Last Day ( Hi Lo Last Day ) показывает максимум и минимум прошлого торгового дня и второго торгового дня. Существует множество торговых стратегий по дневным уровням. Этот индикатор незаменим при использовании таких торговых стратегий. На самом деле, в торговле все просто, нужно только это понять и принять для себя. Есть только цена!!! А что такое цена? На графике это уровень. Уровень - это цена, которую сдерживает покупатель и продавец. Какую цену сдерживает контрагент? Цен

KT COG is an advanced implementation of the center of gravity indicator presented by John F. Ehlers in the May 2002 edition of Technical Analysis of Stocks & Commodities magazine. It's a leading indicator which can be used to identify the potential reversal points with the minimum lag. The COG oscillator catches the price swings quite effectively.
MT4 version of the same indicator is available here KT COG Advanced MT4
Calculation of COG The COG indicator is consist of the two lines. The mai
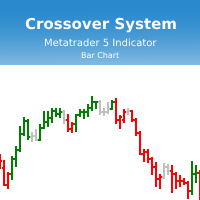
Индикатор Crossover System основан на трех скользящих средних, который изменяет цвет баров в зависимости от определенных условий скользящих средних. Этот индикатор позволит реализовывать системы из одной скользящей средней, из двух скользящих средних и из трех скользящих средних. Параметры индикатора: fastperiod - период быстрой скользящей средней fastMethod - метод построения быстрой скользящей средней fastPrice - метод вычисления быстрой скользящей средней fastshift - сдвиг быстрой скользя

Engulfing Candlestick Bulkowski The engulfing candlestick is a well-known candle pattern composed of two candles. This indicator for showing engulfing candlestick that describe by Thomas Bulkowski.
If you need for MetaTrader 4 version, please visit here: https://www.mql5.com/en/market/product/34193
Feature Highlights Show bullish engulfing and bearish engulfing. Customizable "Up Symbol". Customizable "Down Symbol". Customizable symbol distance from candlestick. Customizable "Down Color". Cus

Индикатор рисует дневные линии поддержки и сопротивления на графике, а также уровень Pivot (уровень разворота). Адаптирован под работу в МТ5 Стандартный таймфрейм для расчета уровней поддержки и сопротивления - D1.
Можно выбрать другие таймфреймы, согласно Вашей стратегии (например для M1-M15 оптимальный таймфрейм для расчетов - H1) Обновлена функция расчета уровней поддержки и сопротивления, в данном варианте расчетов учитываются уровни фибоначи, соответственно для каждого из таймфреймов. Пар

Outside Days Candlestick Bulkowski The Outside days candlestick is a well-known candle pattern composed of two candles. This indicator for showing outside days candlestick that describe by Thomas Bulkowski.
If you need for MetaTrader 4 version, please visit here: https://www.mql5.com/en/market/product/34411
Feature Highlights Show outside days candlestick. Customizable "Symbol". Customizable symbol distance from candlestick.
Input Parameters Symbol - Input symbol code from "wingdings" for
WindFlow is a powerful solution for manual traders that will drive your trading decisions in no time. I designed this indicator taking into account three main concepts: momentum, break of recent trend and volatility. Just like the wind's flow any trend can have small correction or major change in its direction based on the main trend's strength, so at glance you can have a very good idea on the next "wind's direction" when you look at your charts.
How to properly use WindFlow? WindFlow is the

KT Pin Bar identifies the pin bar formation which is a type of price action pattern which depicts a sign of reversal or rejection of the trend. When combined with support and resistance, BRN and other significant levels, Pin Bar pattern proved to be a very strong sign of reversal.
Basically, a pin bar is characterized by a small body relative to the bar length which is closed either in upper or lower 50% part of its length. They have very large wicks and small candle body.
A pin bar candlest

KT Psar Arrows plots the arrows on chart using the standard Parabolic SAR indicator. A bullish arrow is plotted when the candle's high touch the SAR. A bearish arrow is plotted when the candle's low touch the SAR. The signals are generated in the real-time without waiting for the bar close.
Features
A beneficial tool for traders who want to experiment with the trading strategies that include the use of Parabolic Sar indicator. Can be used to find turning points in the market. Use custom PSA
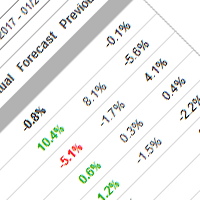
Индикатор отображает историю и будущие экономические новости по валютным инструментам с сайта fxstreet.com и позволяет вам торговать на новостях, закрывать или хеджировать позиции до выхода новостей. Посмотрите видео ниже о том как протестировать демо версию. Для загрузки данных экономического календаря используйте скрипт Economic news calendar loader . Основные возможности: История экономических новостей с 2001 года с сайта Уведомления в терминале, push на телефон или письмо на email за настр
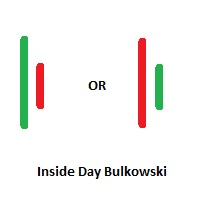
Inside Days Candlestick Bulkowski The Inside days candlestick is a well-known candle pattern composed of two candles. This indicator for showing outside days candlestick that describe by Thomas Bulkowski.
If you need for MetaTrader 4 version, please visit here: https://www.mql5.com/en/market/product/34725
Feature Highlights Show inside days candlestick. Customizable "Symbol". Customizable symbol distance from candlestick.
Input Parameters Symbol - Input symbol code from "wingdings" for ins
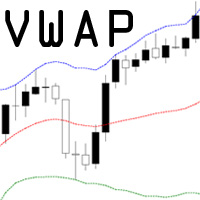
VWAP = Volume Weighted Average Price The concept of VWAP is not equal to a normal Moving Average. The VWAP starts always with zero at the beginning of a new day and successively forms an average to the traded volume relative to price. Professional trading firms and institutions use VWAP for a measure of the real weighted trend of an underlying. With the addition of the standard deviation you can spot support and resist at the outer boundaries.

Minions Labs' Candlestick Pattern Teller It shows on your chart the names of the famous Candlesticks Patterns formations as soon as they are created and confirmed. No repainting.
That way beginners and also professional traders who have difficulties in visually identifying candlestick patterns will have their analysis in a much easier format. Did you know that in general there are 3 types of individuals: Visual, Auditory, and Kinesthetic? Don't be ashamed if you cannot easily recognize Candlest

ini adalah indikator khusus digunakan untuk trading di binary.com dengan pair volatility 75. indikator ini sangat simpel dan mudah digunakan baik untuk yang sudah profesional atau pun yang baru dalam dunia trading terutama yang baru di market volatility 75.indikator ini lebih bertujuan untuk scalping trader dan menggunakan timeframe M1 sebagai acuan untuk entry. adapun jika ingin mempelajari lebih lanjut bisa menghubungi di telegram https://t.me/shadowbreakerfx . untuk SOP lengkap silahkan klik
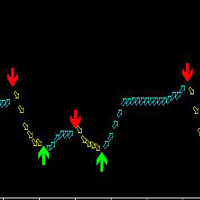
этот показатель подходит для любой сорта MT5, а также для любого цикла, но наиболее подходящим циклом является 30 - е и 4 - х - х, использование проста, стрелы не меняются, не пушки.
принцип этого показателя состоит из АТР - и самодельных MA, а также смешанных расчетов, а также высокой точностью.
покупка: зеленая стрелка вверх по зеленой
продажа: следы красной стрелки
появляются стрелы, которые могут быть сразу же сразу же!
предлагая два цикла, это будет более точным, то ест

Magic Moving MT5 это профессиональный индикатор для торговой платформы MetaTrader 5. В отличие от Moving Average , Magic Moving дает более качественные сигналы и способен выявлять длительные тренды. В индикаторе есть возможность настроить уведомления (алерт, почта, телефон), что поможет вам не пропустить торговый сигнал. Версия Magic Moving для терминала MetaTrader4 : https://www.mql5.com/ru/market/product/26544 Преимущества индикатора Индикатор прекрасно подходит для скальпинга. Дает мин
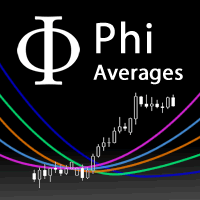
A fan of special weighted moving averages, able to predict tendency reversal and give references about price movements during consolidation and drawbacks. This special moving average is based on Phi fractals and is not available on others indicators. Reproduce this method with another kind of average will not have the same results. The fan has the following averages: 17: Purple 34: Blue 72: Orange 144: Green Blue 305: Dark Blue 610: Grey How to use the fan to analyze price behaviour: If the pric

KT Advance Ichimoku plot the arrows and provide alerts for the four trading strategies based on Ichimoku Kinko Hyo indicator. The generated signals can be filtered by other Ichimoku elements.
Four Strategies based on the Ichimoku Kinko Hyo
1.Tenkan-Kijun Cross Buy Arrow: When Tenkan-Sen cross above the Kijun-Sen. Sell Arrow: When Tenkan-Sen cross below the Kijun-Sen. 2.Kumo Cloud Breakout Buy Arrow: When price close above the Kumo cloud. Sell Arrow: When price close below the Kumo cloud.

KT Volatility oscillator analyze the past and current market data with a mathematical formula to display the result in a form of an oscillator. The growing and deteriorating waves are equivalent to high and low volatility in the asset. In a nutshell, volatility is simply a measurement of the price fluctuation of an asset over a certain period of time. Without volatility, there would not much movement in the market and traders would not be able to profit from the price movements.
Use of Volati
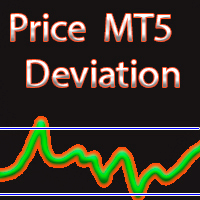
Price deviation from MA Индикатор в отдельном окне отображает значение отклонение цены ( % ) от заданного значения скользящей средней ( Moving Average ). Можно использовать как для фиксирования позиций, так и открытия новых позиции. Входные параметры: 1. Период усреднения для вычисления скользящего среднего. 2. Метод усреднения. Может быть любым из значений ENUM_MA_METHOD: MODE_SMA – Простое усреднение; MODE_EMA – Экспоненциальное усреднение; MODE_SMMA – Сглаженное усреднение; MODE_LWMA

Ultimate Engulfing Bar Scanner (Multi Pair And Multi Time Frame) : ---LIMITED TIME OFFER: NEXT 25 CLIENTS ONLY ---46% OFF REGULAR PRICE AND 2 FREE BONUSES ---SEE BELOW FOR FULL DETAILS Nothing is more important than institutional price action and order flow.
And a strong engulfing candle is a clear indication that the institutions have flipped their sentiment.
Engulfing bar patterns are widely used by institutional traders around the world. As they allow you to manage
your trades withi

Ultimate Correlation Scanner (Multi Pair And Multi Time Frame) : ---LIMITED TIME OFFER: NEXT 25 CLIENTS ONLY ---46% OFF REGULAR PRICE AND 2 FREE BONUSES ---SEE BELOW FOR FULL DETAILS Correlations exist because of ongoing patterns in global capital flows.
Correlations are a fundamental market principle that underpin the markets.
And correlations will never go away. Global capital tends to flow (in unison) in and out of risk sensitive currencies.
While at the same time flowing in and out o

Ultimate Moving Average Scanner (Multi Pair And Multi Time Frame) : ---LIMITED TIME OFFER: NEXT 25 CLIENTS ONLY ---46% OFF REGULAR PRICE AND 2 FREE BONUSES ---SEE BELOW FOR FULL DETAILS Institutional traders use moving averages more than any other indicator. As moving averages offer a quick
and clear indication of the different phases of a trend. Such as expansion, pullback, consolidation and reversal.
And viewing the market through the same lens as the institutions is a critical part of y

Ultimate Volatility Scanner (Multi Pair And Multi Time Frame) : ---LIMITED TIME OFFER: NEXT 25 CLIENTS ONLY ---46% OFF REGULAR PRICE AND 2 FREE BONUSES ---SEE BELOW FOR FULL DETAILS Volatility expansion and contraction is a fundamental market principle that will NEVER go away.
And some of the largest institutions in the world invest enormous amounts of capital into various
types of volatility strategies. Not only for profit driven trading strategies, but also for risk control.
VOLATILITY

An indicator for finding patterns of candles. Through this indicator it is possible to recognize several patterns of candlesticks: hammer, inverted hammer, doji, maximum swallow, minimum swallow and inside bar. The patterns can be found by modifying the values of the indicator parameters. In this way it becomes possible to recognize an infinity of patterns.
How to use: Add the indicator to the chart.
Parameters: [doji -> max body size] represents the maximum body size of the doji (difference

It is an indicator that works with oscillations based on golden proportions. Through this indicator it is possible to operate using the proportions of the number of gold to elaborate strategies with the golden ratio. In this way, it is possible to make market analyzes respecting the proportions of Fibonacci. How to use: The closer the lines are to each other, the greater the possibility of retraction or inversion of the movement, the same is true for the distance of the lines. Nearby lines, sug
MetaTrader Маркет предлагает каждому разработчику торговых программ простую и удобную площадку для их продажи.
Мы поможем вам с оформлением и подскажем, как подготовить описание продукта для Маркета. Все продаваемые через Маркет программы защищаются дополнительным шифрованием и могут запускаться только на компьютере покупателя. Незаконное копирование исключено.
Вы упускаете торговые возможности:
- Бесплатные приложения для трейдинга
- 8 000+ сигналов для копирования
- Экономические новости для анализа финансовых рынков
Регистрация
Вход
Если у вас нет учетной записи, зарегистрируйтесь
Для авторизации и пользования сайтом MQL5.com необходимо разрешить использование файлов Сookie.
Пожалуйста, включите в вашем браузере данную настройку, иначе вы не сможете авторизоваться.