Смотри обучающее видео по маркету на YouTube
Как купить торгового робота или индикатор
Запусти робота на
виртуальном хостинге
виртуальном хостинге
Протестируй индикатор/робота перед покупкой
Хочешь зарабатывать в Маркете?
Как подать продукт, чтобы его покупали
Технические индикаторы для MetaTrader 5 - 54
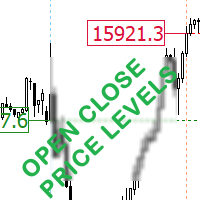
This indicator displays the open and closing price for the selected number of days. Easily identify market open and close Gaps. Select the Day icon to show the open and closing price line. Select the Time icon to show the open and closing hours. Indices and stocks are not a 24hour market as shown on MT5 charts, they open and close at specific times. Marketplace
Time Zone
Trading Hours
New York Stock Exchange (NYSE)
EDT
9:30 a.m. to 4:00 p.m.
Nasdaq Stock Market
EDT
9:30 a.m. to 4
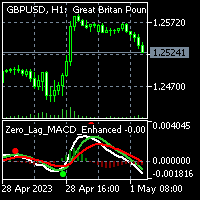
To get access to MT4 version please click here . This is the exact conversion from TradingView: "Zero Lag MACD Enhanced - Version 1.2" by " Albert.Callisto ". This is a light-load processing and non-repaint indicator. All input options are available. Buffers are available for processing in EAs. You can message in private chat for further changes you need. Thanks

The fate of a trade depends on knowing the direction of the price trend. Whatever style you trade, you must know that the direction of the main market trend is in the hands of buyers or sell
YZD Trend indicator helps you to find the main direction by using mathematical parameters and ATR This indicator is a good supplement for your strategy, especially price action, which can reduce your trade losses.
How to use: YZD Trend indicator consists of two ranges in the form of bands, when th

Indicator introduction: A channel and trend line indicator, which is a good tool for manual trading, and also can be used for creating new EAs, without drifting or repainting. It applies to any timeframes and any symbols. The work of the indicator is shown in the screenshots. For any novice and programming trading friend, you can write the signal into the EA to play freely, buffer 0 corresponds to the bold trend line, buffer 4 and 5 respectively corresponds to the channel's upper and lower f
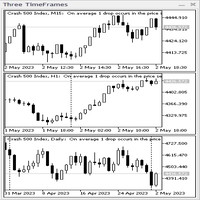
Three TimeFrames indicator-panel. The indicator is made in the form of a panel based on the CAppDialog class. The panel can be minimized or moved around the current chart using the mouse. The indicator shows three timeframes of the current symbol in the panel. In the current version, the indicator has a minimum number of settings - these are the parameters of three timeframes: "Younger timeframe", " Middle timeframe " and " Older timeframe ". When launched, the indicator-panel autom

Nadaraya-Watson Envelope Indicator convert to MT5 Nadaraya Watson Envelope Indicator is one of the monst popular indicator in TradingView. TradingView(Chrome, Edge) eats a huge of CPU, so I convert this to MT5 version.
As you can see the screenshot, it's good with Schaff trend RSI Indicator (or others) If you want to get Schaff trend RSI Indicator , Link: https://www.mql5.com/en/market/product/98011
Window Size - determines the window size for calculating smoothed values. A larger window

There are many linear regression indicators out there, most of them draw lines or channels, but this one actually draws a chart. The beauty of the indicator like Heiken Ashi is it removes a lot of market noise. 4 (OHLC) arrays are filled with Linear Regression(LR) values of each price for the LR period (default=14). The period of the Linear Regression is adjustable dependant on the market conditions. The SMA (default=14) also has period adjustment. Candles are generated with Green for 'Up' cand

Schaff trend RSI indicator (It is related with EMA and RSI) It is suited for sub-Indicator to undertand trend(or direction change)
As you can see the screenshot, it's good with Nagaraya-Watson Envelope Indicator (or others) I am using this indicator as Screenshot setting. (Schaff value is default value. 23, 50, 9, close) If you want to get Nagaraya-Watson Envelope, Link: https://www.mql5.com/ko/market/product/97965

The Super Trend is one of the best trend-following indicator for MT5 platforms. It's working fine for real-time trend alerts and accurate signals and it help to identify the best market entry and exit positions. This indicator is the tool you can refers to a trend following overlays. It contains two major parameters: the period and the multiplier. Besides, traders should consider default values that include 10 for every true range aтd 3 for the multiplier. 2 Types TP SL you set in input Point
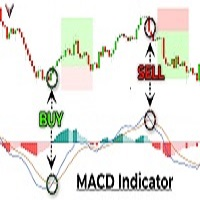
The MACD Gold Scalping Indicator is a powerful tool designed to help traders like you extract profits from the gold market. This indicator is based on the popular Moving Average Convergence Divergence (MACD) indicator, but it's been customized specifically for trading gold. When you use this indicator, you'll be able to quickly identify key entry and exit points in the gold market. It uses a combination of trend analysis, momentum indicators, and support and resistance levels to generate highly

The Off Trend MT5 Forex Indicator is a trend-following tool. Its signals are presented in the cloud. When the cloud is green, the trend momentum is bullish, and traders should take buy opportunities. Conversely, the trend momentum is bearish when the cloud is pink, and traders should take sell opportunities. The Off Trend mt5 Forex Indicator fits all timeframes and mt4 currency pairs.
Introducing our groundbreaking Forex indicator, specifically designed to help traders master the art of identifying critical support and resistance zones, as well as double top and double bottom patterns with unprecedented accuracy. Say goodbye to guesswork and hello to a powerful tool that will revolutionize your trading experience. Our proprietary indicator leverages cutting-edge technology to recognize key price levels where buying and selling pressures are poised to shift the market dynamics

--- StudentK RVI --- 1. Advanced strategy based on RVI 2. EA adapted (especially for StudentK's EA)
--- Context --- StudentK is not indicated as a master or K Sir for knowledgeable person who claims for winning all the time. (But lots of traders should know the fact that it is rarely truth, especially in fluctuated period of time)
StudentK is a group of years-experienced traders who want to share amazing tools in Free and Paid versions. Aiming helping people getting out of "The Rat Race" by
--- StudentK CCI --- 1. Advanced strategy based on CCI 2. EA adapted (especially for StudentK's EA)
--- Context --- StudentK is not indicated as a master or K Sir for knowledgeable person who claims for winning all the time. (But lots of traders should know the fact that it is rarely truth, especially in fluctuated period of time)
StudentK is a group of years-experienced traders who want to share amazing tools in Free and Paid versions. Aiming helping people getting out of "The Rat Race" by

--- StudentK MACD --- 1. Advanced strategy based on MACD 2. EA adapted (especially for StudentK's EA)
--- Context --- StudentK is not indicated as a master or K Sir for knowledgeable person who claims for winning all the time. (But lots of traders should know the fact that it is rarely truth, especially in fluctuated period of time)
StudentK is a group of years-experienced traders who want to share amazing tools in Free and Paid versions. Aiming helping people getting out of "The Rat Race"
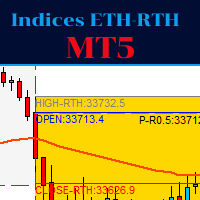
This indicator is for trading indices.
The RTH sessions (regular trading hours) where the underlying cash market is open are distinguished from ETH: for example for the American indices from 9:30 to 16:15 East Coast (New York) time, while for the Dax from 09:00 to 17:35 CET.
For the ETH session (outside RTH) the Fibonacci levels are plotted, as well as sensitive levels such as 25,50,75% retracement from the minimums and maximums.
Also for the RTH session the Fibonacci levels are graphed,
JPYTraderSR is a simple support and resistance indicator with Fibonacci retracement and extension levels added to provide even more trade signal confluence. It provides extra confirmations by indicating support and resistance levels shaping the market structure at any given time, in relation to harmonic trade concepts facilitated by Fibonacci ratios. The JPYTrader Expert Advisor (v1.0) utilizes an older version of this indicator (v1.0), which in turn leads to fairly accurate price action retrace

Market Viewer gives a quick glance on correlation and direction. This indicator takes a list of symbols (max 8) Leave a symbol setting empty if you wish not to use that many - like in the defaults… It will check for each timeframe (Monthly, Weekly, Daily, H4, H1, 30min, 15min, 5min and 1min) if the current candle on that timeframe is bullish or bearish. This will give a good indication of the direction for us to trade in. We need to be in sync with the bigger timeframes.
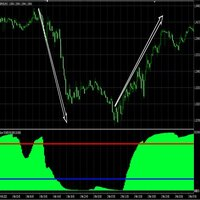
Absolute High Low indicator is a discretionary tool for assessing extremes in the price. It is very self-explanatory, and you can test against other default oscillators to see the difference. Combine with your trend following systems to master entry and exit at extremes. Back test and study the indicator to see the results up against a system or indicator. The indicator calculates a number of max bars so a gap will appear at the end, and it will restart. MT4 Version: https://www.mql5.com/e
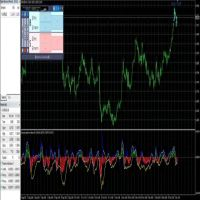
This is a predictive indicator ( leading indicator ) that uses Bayes' formula to calculate the conditional probability of price increases given the angular coefficient. The indicator calculates the angular coefficient and its regression and uses it to predict prices.
Bayes' theorem is a fundamental result of probability theory and is used to calculate the probability of a cause causing the verified event. In other words, for our indicator, Bayes' theorem is used to calculate the conditional pr
To get access to MT4 version please click here . This is the exact conversion from TradingView:"HIGH AND LOW Optimized Trend TrackerHL OTT" by "kivancozbilgic" This is a light-load processing indicator. It is a non-repaint indicator. All input options are available. Buffers are available for processing in EAs. You can message in private chat for further changes you need. Thanks.

Pinbar Outside Pattern indicator shows in a table symbol, time frame and direction of the last price candle if it matches outside pinbar input parameters. Outside pinbar means that the candle is extreme in the chosen time frame. By clicking ' Open chart ' button you can view drawn pattern. You can choose to scan through all the symbols in Market Watch or enter your favorite symbols, and also you can enter time frames you need to scan. ---------Main settings-------- Select all symbols from Market

It is one of the famous indicator in TradingView platform. Supertrend indicator shows the trend of the market intuitively . You can use it for understanding the trend or get insight about the market.
------- Value & Color -------- You can change the colour (line, filled). Default value is the same as Tradingview Supertrend default value ( period 10, ATR multiplier 3.0)
Добро пожаловать в индикатор Provlepsis
"Provlepsis" - это высокоуровневый индикатор, разработанный для рынка MQL. Анализируя предыдущие бары в тот же самый час дня, он точно рассчитывает потенциальный диапазон движения рынка, предоставляя ценную информацию о будущих колебаниях цен. В отличие от традиционного индикатора ATR, "Provlepsis" учитывает фактор времени, что делает его более мощным инструментом, адаптирующимся к различным рыночным условиям. В ночное время индикатор предсказывает более

Pack Volatility 75 1/3 In this indicator stage 1 I am pleased to present you the volatility 75 Buy/Sell Professional indicator. where in each temporary structure it will mark a sale and a safe purchase to operate manually, where the strategy is based on the lines EMA of 7 exponential periods and the EMA of 50 exponential periods. where purchasing a product comes 2 as a gift (it's the pack) purchasing any of the 3 products will be sent the remaining indicators, to be able to apply the strategy we
On this occasion I am pleased to present the (Boom 300 Professional Pack) where it consists of 4 indicators for the Boom 300 index of synthetic indices (Deriv Broker) Acquiring this indicator enables you the pack of the 4 boom 300 indicators where the rest of the indicators will be sent, This indicator is 1 of the 4 that includes the Buy/Sell strategy, sending you clear alerts where there buy or sell the pair It is recommended to use in a period of 15 minutes, to have a greater profit since the
Professional Pack Crash 300 Indicators, On this occasion I present the trend indicator that is for the crash index 300 (Deriv Broker) The indicator consists of a strategy where trends are caught in periods of 15 minutes, very clearly the indicator shows the purchase marking the tip of red until the trend develops, and then mark the green point of purchase, it is very simple to use, It is recommended to use in that temporality since it serves to catch longer trends and increase profit, the indica
Channel Stochastic Boom 1000 I am pleased to present the pack (Tendence Boom 1000) where on this occasion I present the Channel Stochastic Boom 1000 indicator for (Deriv Broker) where is 1 of the 4 indicators that the pack brings! The indicator consists of the sthochastic strategy, where it reaches the point of (0 Level) the purchase is made, taking advantage of hunting spike, where it reaches the point of (90 Level) the sale is made taking advantage of the trend candles! It is used in 1 minute

The Fisher Transform is a technical indicator created by John F. Ehlers that converts prices into a Gaussian normal distribution. The indicator highlights when prices have moved to an extreme, based on recent prices. This may help in spotting turning points in the price of an asset. It also helps show the trend and isolate the price waves within a trend. The Fisher Transform is a technical indicator that normalizes asset prices, thus making turning points in price clearer. Takeaways Turning poi

"Advanced Daily VWAP with Standard Deviation and Trading Bands" Description: "The 'Advanced Daily VWAP with Standard Deviation and Trading Bands' indicator offers a comprehensive view for traders who wish to make the Volume Weighted Average Price (VWAP) the crux of their trading strategy. It not only calculates the VWAP on a daily basis but also incorporates standard deviation to give an accurate representation of market volatility. The trading bands are calculated using a 1.5% multiplier for th

This MT5 indicator is my newest trading indicator which gives traders an accurate entry to buy or to sell. This can be used to scalp or swing-trade on longer time-frames but you will need to set your own stop loss and profit targets as the markets are unpredictable. This indicator can always provide the trader with at least a few pips of profit from scalping. Buy when you see a green arrow and sell when you see a red arrow. It's as easy as that.
TrendPlator: Мощный индикатор прогнозирования тренда для оптимизированных торговых стратегий Откройте для себя мощь нашего нового индикатора! Способность вычислять трендовые линии более крупных таймфреймов и проецировать их прямо на ваш текущий таймфрейм обеспечивает стратегическую поддержку, привлекающую внимание всех трейдеров. Эти точки становятся мощными уровнями поддержки или сопротивления для ваших сделок, способствуя улучшению вашей торговой стратегии. Представьте себе индикатор, который

Индикатор Trading Hours рисует на графике рамки, представляющие часы открытия и закрытия конкретной биржи. Входы: Входной параметр `сдвиг часового пояса UTC` устанавливает сдвиг часового пояса пользователя относительно UTC, Другие параметры используются для отображения или скрытия рамок или установки цвета. Функции: Рисует рамки, которые представляют часы открытия и закрытия конкретной биржи на диаграмме, Показать/скрыть кадры для выбранного обмена, Устанавливает цвет для выбранного обмена, Под

A visual Order Book is a powerful tool used in the financial market to provide a detailed view of buy and sell orders in a given financial instrument in real time.
This visual representation allows traders to observe the liquidity available in the market, identify the supply and demand levels at different prices and follow the evolution of orders as they are placed, modified or withdrawn.
By analyzing the visual Order Book, traders can identify trading patterns, detect possible reversal poi
Crash Scalper Gold It is an indicator, where it marks points of purchase and points of sale As the name says, it is used to scalp in the pairs of (Crash) 1000/500/300 where it sends you signals of sale/Sell and purchase/Buy at level points (90) he sends you the sell signal, (Spike) at the level point (27) it sends you the buy signal, (Trend Candles) It is very simple and easy to use. to make the best tickets possible! For this period it will remain on sale! Without further ado, enjoy! Good profi
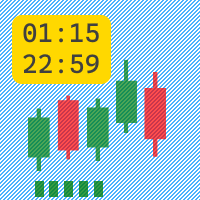
Индикатор Active Session отображает в отдельном окне активную торговую сессию в виде зеленых свечей.
Параметры индикатора: Monday = true/false - торговать в понедельник, если параметр равен true. Tuesday = true/false - торговать во вторник, если параметр равен true. Wednesday = true/false - торговать в среду, если параметр равен true. Thursday = true/false - торговать в четверг, если параметр равен true. Friday = true/false - торговать в пятницу, если параметр равен true.
StartHour -
Xau/Usd Scalper It is a unique indicator where it counts the low/high to make buy and sell entries! where you mark the entries with arrows next to the lows and highs used in m15/H1 to make longer and more valuable entries It is very simple and easy to use It also works for forex pairs and synthetic indices! Without further ado, enjoy! good profit World Investor!!

Индикатор средневзвешенной цены по объему — это линейный индикатор, который отображается в главном окне графика MT5. Индикатор отслеживает типичную цену, а затем торговый объем, используемый для автоматического смещения линии индикатора в направлении интенсивно торгуемых цен. Именно по этим ценам было продано наибольшее количество контрактов (или лотов). Затем эти взвешенные цены усредняются по прошлым периодам, и индикатор показывает линейное исследование по этим ценам.
Индикатор в этом пост
Step Scalper , It is an indicator with alerts, where it sends you buy and sell alerts accompanied by a moving average of 21 periods It is very easy and simple to use. where on the path of the green period marks the purchase of the asset , and the path of the red period marks the sale of the asset, It is used for scalping on M5/M15 but it is also recommended use it in periods of 1 hour since it captures the buying or selling trend, to get more profit! no more to enjoy good profit World Investor!
Индикатор Logarithmic Moving Average представляет собой скользящее среднее, которое инвертирует формулу экспоненциального скользящего среднего.
Известно, что многие трейдеры используют логарифмические графики для анализа продолжительности ценовых колебаний. Индикатор в этом посте можно использовать для анализа логарифмического значения цены на стандартном графике с временной шкалой.
Трейдер может задать следующие входные параметры:
MAPeriod [по умолчанию: 9] — установите большее чи

If you have been anywhere near Forex forums or social media lately, you have no doubt been hearing people talk about Smart Money Concepts (SMC) trading. You may be wondering what SMC is, and whether it deserves all the hype. In this post, we will introduce Smart Money Concepts trading to you so you can make an informed decision about whether or not to give this strategy a try in your own trading. What is SMC Forex trading? Smart Money Concepts (SMC) is one of many forex trading methods. SMC
Volumen del especulador Es un indicador que captura la fuerza del volumen de compra y venta. donde es muy fácil de usar, mostrándote la fuerza alcista y la fuerza bajista. En este gráfico está el claro ejemplo de cómo se utiliza, en el par VOLATILITY 75 donde esta la tea verde junto con la flecha que indica la compra, y ahí está la vela roja con la flecha marcando la venta del par, los parámetros a utilizar son Volumen : 5 Tiempo : 1000 para que capte toda la tendencia y se note mejor cuando co
Индикатор Volume Change отображает в отдельном окне изменение объема и направление движения цены в виде линии.
Параметры индикатора: VolumeTimeframe - таймфрейм на котором индикатор берет данные . VolumeApplied - тип объема: Tick volume/Real volume. VolumePeriod - период скользящей средней на таймфрейме VolumeTimeframe, относительно которой рассчитывается изменение объема.
Данный индикатор может использоваться для построения торговой системы, основанной на отслеживании движени
Представляем индикатор Draw On Chart: раскройте свою креативность на графиках!
Устали бороться с проблемами аннотирования ваших торговых графиков, пытаясь понять свои анализы или эффективно передать свои идеи? Вам больше не придется искать решение! Мы рады представить индикатор Draw On Chart - революционное средство, позволяющее легко рисовать и аннотировать непосредственно на графиках всего лишь несколькими щелчками или движениями вашего пера.
Наш инновационный индикатор Draw On Chart разр

Moving Average Band is a tool designed to provide traders with a more comprehensive and realistic perspective when using moving averages in their technical analysis. Unlike conventional moving averages plotted as lines, Moving Average Band introduces a unique approach by representing the moving average as a dynamically adjusting band based on market volatility.
Volatility is an intrinsic characteristic of financial markets, and understanding how it impacts trends and price movements is essent

The MultiTimeframe Volume Zones Indicator is a powerful tool designed to provide traders with comprehensive insights into market dynamics. It combines several essential features, including volume analysis, Dow Zones, buy and sell arrows, candle timer, and market movement across different time frames. This all-in-one indicator equips traders with valuable information to make informed trading decisions. Key Features: Volume Analysis: Gain a deep understanding of market sentiment and strength by an

Вы устали упускать выгодные рыночные тренды? Вы хотели бы иметь надежный инструмент, который мог бы точно и точно определять продолжение тренда?
Не смотрите дальше! Наш индикатор продолжения тренда призван усилить вашу торговую стратегию и помочь вам опережать конкурентов.
Индикатор продолжения тренда — это мощный инструмент, специально созданный для помощи трейдерам в выявлении и подтверждении паттернов продолжения тренда на различных финансовых рынках.
Независимо от того, торгуете ли в
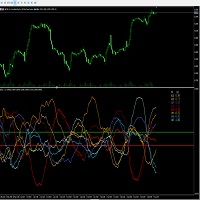
Качественный индикатор рассчитывает разницу между валютными парами USD, EUR, GBP, AUD, JPY, CHF, NZD, CAD. Расчёт ведётся в онлайн режиме вычисляет спрос и предложение между собой в различных связках. Отображение можно наблюдать в двух режимах общий всех восьми пар а также конкретно по выбранной паре. Важным показателем индикатора является нулевая ость что указывает общий тренд валют и их преимущество по отношению друг к другу. Индикатор работаем во всех режимах времени.
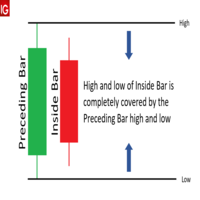
The Inside bar indicator can detect where inside bars occur in the charts and will change the color of the candle based on user inputs. Please note that the color can differ based on the current color of the candle due to supposition of the colors. Here are the characteristics of an inside bar pattern: High: The high of the bearish candle is lower than the high of the previous bullish candle. Low: The low of the bearish candle is higher than the low of the previous bullish candle. Body: The bo
Market screener: Spread and Swap, for selected Symbols. You can customize the list: set only the Symbols (currency pairs) that are needed. The number of Symbols is unlimited. The list can be sorted in ascending or descending order (Symbol name). The panel can be moved to any place on the chart. You can also minimize the panel. Displayed values: Current market price (BID); Spread size; Swap, for Long positions; Swap, for Short positions; Overall P/L of the entire account; My #1 Utility : includ

To get access to MT4 version please click here . This is the exact conversion from TradingView: "[SHK] Schaff Trend Cycle (STC)" by "shayankm". This is a light-load processing indicator. This is a non-repaint indicator. Buffers are available for processing in EAs. All input fields are available. You can message in private chat for further changes you need. Thanks for downloading

Индикатор обнаруживает начало нового тренда не прямым способом, а сравнением двух прогнозных значений, построенных с учетом доступной истории. Его действие основано на предположении о том, что прогнозируемая (исторически нормальная) цена и реальная цена отличаются вследствие появления “новой” силы (несбалансированного воздействия на рынок), как правило такое воздействие при неустойчивом рынке приводит к существенной коррекции рынка. Устойчивость рынка индикатор не отслеживает, поэтому рекоме
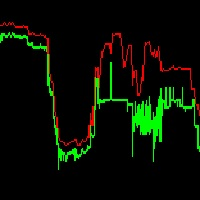
It is super imporant to know what the spread is on your charts!
This indicator displays the Ask High of the past bars, similar to that of the backtester. This allows you to see the spread of bars in real time.
The spread of the bar is the ask-bid price. The spread of a bar is the minimum spread of any ticks found within that bar. I hope this makes sense.
If you have any questions or feedback, let me know - thank you.

This is one of my preferred indicators where it plots on the chart Railroad Track candles, i.e. candles that have similar size. It is a very good indicator for trend direction. In the settings there is an option for Max candle size and Min candle size and also for the percentage for the tolerance between the Min and Max candle size. The candles values are calculated for High and Low. Have fun and enjoy trading! P.S. Please send me a message or leave a comment with any suggestions or improvements

XP Speed Meter the best indicator that measures the price/tick’s currency speed for you. It will give you the ability to know when the pair moving fast or slow . So, you can trade or not trade. It’s very important tool for scalper traders – news traders. Even for trend traders it will be useful to know if the market is trending fast or slow . XP Speed Meter is better than the volume type indicators of course. Because it shows the currency speed on the run-time without any lacking like what the v

This will find a possible reverse area and show entry signal and this strategy is using every candle and calculate them
buyer should us e with other indicators to get the best trade entry like Macd , RSI , or EMA . SMA.
Make sure try demo first it will supprise you all because how good it is
i hope you guy enjoy it but my coding is not good, so i cant code any EA for this , my own strategy
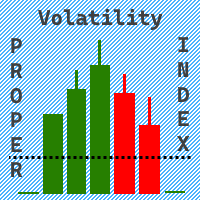
Индикатор Volatility Proper Index отображает в отдельном окне индекс волатильности торгового символа. Для расчета волатильности используется расчет отклонений цены от скользящей средней.
Параметры индикатора: Period - количество последних баров для которых производится расчет индекса волатильности . MinThreshold - минимальное отклонение цены от скользящей средней, при котором это отклонение учитывается в расчетах .
AveragePeriod - период скользящей средней , по умолчанию = 30 послед

To test the adviser, do you open a separate account for each of them? this is very inconvenient, but thanks to this indicator, this is no longer a problem!
Do not be too lazy to read the full description and do not close the page ahead of time, this indicator is needed by almost every trader, no matter if he trades with his hands or uses advisors.
Buying this indicator as a gift you will receive an adviser with not bad results.. if you have already received a gift from me from othe

Super Trend Plus is a trading system that uses four Supertrends set with different parameters. The idea behind this system is that when three Supertrends move in the same direction, there is a strong trend confirmation, but entry occurs only when the fourth Supertrend also moves in the same direction as the other three. For example, the first Supertrend could be used with a volatility multiplier of 3 and a period of 10, the second Supertrend with a volatility multiplier of 3 and a period of 12,

To get access to MT4 version please click here . This is the exact conversion from TradingView: "RedK_Supply/Demand Volume Viewer v3.0" by "RedKTrader" This is a light-load processing and non-repaint indicator. All input options are available. Buffers are available for processing in EAs. You can message in private chat for further changes you need. Thanks for downloading
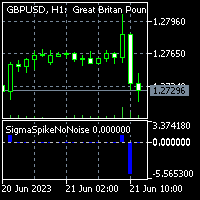
To get access to MT4 version please click here . This is the exact conversion from TradingView: "Sigma Spikes No Noise" by "irdoj75" This is a light-load processing and non-repaint indicator. All input options are available. Buffers are available for processing in EAs. You can message in private chat for further changes you need. Thanks for downloading...

Creating an Index: Importance, Customization, and Weighting Options for MT5 Trading Indicator Designing your index is crucial for efficient symbol tracking in the world of trading. With a powerful MT5 trading indicator, you gain the flexibility to construct an index that suits your preferences, whether it's an equal weighted or custom weighted one. Unlike widely-known indexes like the S&P 500, which heavily favor certain winners, this indicator empowers you to curate a basket of symbols and assi
The Scalper v2 will give you accurate guidance to trade with. It has indications with arrows and it sends notifications. This software was built based on the RSI,MACD,Martingale, Ema 50 and 200, Aligator, SMA 30,50, ADX, Volumes percent range, variable dynamics and fibonacci levels. all of these indicators have something in common, it allows analysis, support and resistance, accurate signals for buy and sell, overbought and oversold market analysis. I have combined all of these indicators into o
The Adaptive EMA consists of 3 lines: Yellow, Blue and Red If a yellow line appears, it means the market is entering Consolidation, Range, Contraction and no opportunities are available. If a Blue line appears, It means prices are accumulating, and now being marked up, so you are now entering a buy market with a strong Bullish trend. If a Red line appears, it means prices are now being marked down, price distribution is underway, so you are now entering a Sell market with a strong Bearish trend.

Представляем нашу последнюю новинку в индикаторах MetaTrader 5, созданную для значительного улучшения вашего торгового рабочего процесса с помощью высокой функциональности и простоты использования. Он включает в себя мощный набор функций, разработанных для того, чтобы помочь вам оптимизировать анализ графиков и максимально использовать ваши торговые решения. Вот краткий обзор его потрясающих возможностей: Быстрое рисование объектов : Сэкономьте драгоценное время с функцией быстрого рисования. П
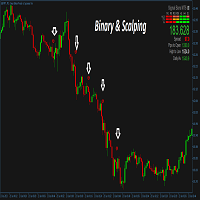
This is a trend following system for Binary options traders and forex scalpers. It is carefully crafted and recognizes periods of WATERFALL in the market and gives the trader the advantage and opportunity of riding with the momentum. It works on all timeframes and currency pairs especially high liquidity pairs. Avoid news events 15mins before and after. Always have your money management script or system in place. Tested on Deriv synthetics as well, please check screenshots. The mt4 version can b

Smart Currency Strength is a powerful yet simple indicator that measures the strength of individual currencies.
It features a graphic panel that lists the main currencies and their strength in each timeframe, ranging from 0 (most oversold) to 100 (most overbought). The strength for all currencies in the current timeframe is also shown in a separate window as a multi-line graph, where each currency is represented with a different color, this allows you to monitor the evolution of strength tre

SourcePoint是一个很好的中长线交易指示器,他能独立使用,也可以去其他趋势型指标独立使用,可以很好的指出最佳的buy和sell位置,指标不含有未来函数,不会重新绘制,不仅能够应用到自己的手动交易过程中,还能完全可以写入到自己的EA中。建议配合BS TrendLine( https://www.mql5.com/zh/market/product/96476?source=Site+Market+My+Products+Page ) 一起使用。 (如果你感觉到这个指标能够帮助你进行更准确的交易,请帮忙给个好评,希望我的作品能够帮助更多有需要的人) ===================参数列表===================== fastP: 12 slowP:26 avgP:9 =================参考使用方法=================== 此指标可以适用于任何交易品种,能够用在任何周期。 每次形成一个交点,就是一个交易机会,同时也是一个持仓平仓点位。建议配合大小周期一起使用,这样更容易让你找到更精准的入场位置和出场位置

Moving Average Crossover Indicator. Add this Easy Indicator to your charts. The indicator indicates when to buy and when to sell. When the line is orange that is a sell signal. When the line is green that is a buy signal. Easy to use and colors can be changed so suit your charts. Easy to use. Follow the indicator and enter your buy and sell signals. Work on any market and on any timeframe.

Easy to use buy and sell signals with arrows. Non Repainting indicator. Non Lagging indicator. Down Arrows indicate sell and up arrows indicate buys. Works on any market and on any time frames. Arrow colors can be changed to match chart colors. Audible alerts. Periods can be changed to phase out false signals. Please remember to follow the trend like with any indicator.
А знаете ли вы, почему MetaTrader Market - лучшее место для продажи торговых стратегий и технических индикаторов? Разработчику у нас не нужно тратить время и силы на рекламу, защиту программ и расчеты с покупателями. Всё это уже сделано.
Вы упускаете торговые возможности:
- Бесплатные приложения для трейдинга
- 8 000+ сигналов для копирования
- Экономические новости для анализа финансовых рынков
Регистрация
Вход
Если у вас нет учетной записи, зарегистрируйтесь
Для авторизации и пользования сайтом MQL5.com необходимо разрешить использование файлов Сookie.
Пожалуйста, включите в вашем браузере данную настройку, иначе вы не сможете авторизоваться.