 MetaTrader 5
 Эксперты
 Индикаторы
 Библиотеки
 Утилиты
 Виджеты
 Правила
Смотри обучающее видео по маркету на YouTube
Как купить торгового робота или индикатор
Запусти робота на
виртуальном хостинге
виртуальном хостинге
Протестируй индикатор/робота перед покупкой
Хочешь зарабатывать в Маркете?
Как подать продукт, чтобы его покупали
Технические индикаторы для MetaTrader 5 - 234
 На основании сигналов технических индикаторов принимаются решения относительно открытия или закрытия сделки на фондовом и форекс-рынках. Суть индикаторов заключается в математическом преобразовании цены и/или объемов финансового инструмента для прогнозирования изменений цен в будущем.
Протестируйте технические индикаторы, чтобы лучше предсказывать поведение рынка и зарабатывать на этом.

ROCKET4 SUPER TREND CHANNEL See the Trend. Read the Market. Identify Trading Opportunities. Stop guessing the market direction. Start reading it with confidence. ROCKET4 SUPER TREND CHANNEL is a professional multi-layer trend analysis indicator designed to help traders understand market direction, visualize dynamic price channels, and identify potential trading opportunities directly on their MetaTrader 5 charts. Whether you trade short-term moves or follow longer market trends, ROCKET4 provi

High Volume Pivot SR Zones Advanced Volume-Based Support & Resistance Indicator for MetaTrader 5 High Volume Pivot SR Zones is an advanced technical analysis indicator designed to identify important market support and resistance areas using pivot levels, price action, and volume-based analysis. The indicator helps traders identify potential market reversal zones, breakout opportunities, breakdown levels, and support/resistance retests directly on the chart. By combining pivot-based price levels
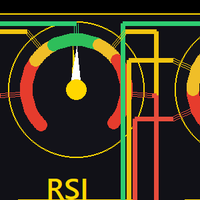
One chart. Five classic indicators. Three periods each. No sub-window clutter.
The Five-Stack Panel displays RSI, CCI, ATR, ADX and MFI at three periods simultaneously (defaults 7 / 18 / 28, all adjustable) in a compact on-chart panel, with a plain-language state tag for each reading:
- **RSI** — tag: OVERBOUGHT (≥70) / MID / OVERSOLD (≤30) - **CCI** — tag: STRETCH UP (>+100) / STRETCH DN (<−100) - **ATR** — shown in price units at your symbol's precision - **ADX** — tag: CHOP (<20) / WEAK TRE

Draws one Monday buy arrow and one exit arrow per week, based only on the bar time. Designed for GBPJPY H1.
This indicator marks one trade idea per week.
On Monday, it draws a buy arrow at the open of the 11:00 bar. On the same Monday, it draws an exit arrow at the open of the 23:00 bar, and a dotted line joins the two. Both times are server time on the reference clock (GMT+2 in winter, GMT+3 in summer).
The arrows depend only on the bar time and use the bar open price. An arrow never moves

Marks a buy signal when the 8-period EMA crosses above the 21-period EMA on a closed bar, with take-profit and stop-loss lines. Designed for gold H1.
This indicator shows one simple rule on the chart. It does not open or close trades.
When a bar closes and the fast exponential moving average (EMA, 8 periods, close price) has crossed above the slow one (21 periods), an up arrow is drawn under that bar. The idea is to buy at the open of the next bar. A green line shows the take-profit level (4.

Gemina Signals shows the trades of the Gemina Expert Advisor on your chart, for traders who prefer to place their orders themselves: an arrow where each trade starts, its stop loss and take profit, where it ended, and an alert when a new one comes. It uses exactly the same fixed settings as the EA. Checked trade by trade against the EA's own backtest (MT5 Strategy Tester, real ticks, January 2019 to October 2026): all 69 gold trades and all 70 USD/JPY trades start at the same bar in the same dir

IndexDip Signals shows the trades of the IndexDip Expert Advisor on your S&P 500 or Nasdaq 100 daily chart: where it buys, where it sells, how those trades did over the chart's history, and the state today. For traders who want to see the signals, or place the orders themselves. The settings are fixed and the same as the EA's, so the arrows are the EA's trades: the same entries and exits as the EA's own backtest on the same data. What you see An arrow under each bar where a trade starts and one
FREE

What this is Draws the high and low of a configurable session window together with the recent range history, so the levels that price has repeatedly reacted to are visible without hand-drawing them every day. What it does Marks the high and low of a configurable session window and keeps the last N sessions on the chart as boxes, with breakout levels extended to the right and each box labelled with its range in points. Session structure on demand at any hour window, drawn as the actual tradable b

What this is An ATR value of 12 points means very different things on EURUSD H1 and on gold M5. This indicator turns ATR into a percentile: the current ATR is ranked against the previous bars, and the result is plotted on a 0 to 100 scale with four bands. 20 means the market is quieter than 80 percent of the recent past; 90 means it is near the most volatile reading of the window. What it does Plots the percentile rank of ATR over a lookback window as a 0-100 oscillator with LOW / NORMAL / ACTIV

Название: Volume Profile with Low Volume Nodes
Краткое описание: Профиль объема с уровнями POC, Value Area, HVN и LVN. Автоматический размер шага цены для любого символа. Буферы для советников.
Полное описание: Volume Profile с LVN показывает распределение торгового объема по ценовым уровням и автоматически определяет зоны низкой плотности объема (LVN) и высокой плотности объема (HVN).
Что вы получаете: - Гистограмму профиля объема для каждого дня, недели, месяца, пользовательской сессии или
FREE

MelloVWAP draws VWAP and volume profile on the chart from one indicator. Values on closed bars never change, so what you see in history is what you would have seen live. It needs no DLL and no external service.
VWAP - Session, weekly and monthly VWAP - Anchored VWAP: drag the vertical line to any bar and the line recalculates - Two deviation bands on the session VWAP - Session start can be shifted from server midnight - Session VWAP is hidden on D1 and above, where it has no meaning
Volume pro
FREE

MelloLiquidity maps two things on the chart: fair value gaps that have not been filled, and liquidity levels that have not been taken. When a bar wicks through a level and closes back, it marks a sweep. Everything is decided on closed bars, so history shows what you would have seen live. It needs no DLL and no external service.
Fair value gaps - A three-bar imbalance, with a minimum size in ATR so small gaps are ignored - Stays on the chart until filled. You choose what filled means: touched, m

Trend Range Breakout Pro автоматически находит на графике боковые зоны (консолидации) и показывает момент, когда цена выходит из них.
ЧТО ВЫ УВИДИТЕ НА ГРАФИКЕ • Боковые зоны: когда цена замедляется в узком диапазоне, индикатор рисует прямоугольник, который растягивается свеча за свечой, пока зона не закончится. • Линия тренда: линия на основе скользящей средней, которая меняет цвет: зелёная — тренд растёт, красная — тренд падает, серая — цена находится внутри боковой зоны. • Стрелки пробоя: к

Volume Profile OrderFlow Suite puts volume profiles, VWAP and tick order flow on one MetaTrader 5 chart, with one panel. It also measures how price actually reacted at the profile levels on your symbol, so you can see from your broker's own data whether a level has been worth watching. The panel always shows which data is used. Forex and CFD symbols in MT5 only have tick volume (the number of price changes), so on those symbols the buy/sell side is an estimate. Symbols with exchange trades use r
All classic chart patterns, with a track record. The indicator finds double and triple tops and bottoms, head & shoulders and inverse head & shoulders, ascending, descending and symmetrical triangles, rising and falling wedges, flags, pennants, rectangles and 1-2-3 reversals on your chart and on dozens of symbols and timeframes at once. Every pattern is drawn with its neckline or boundary lines, the breakout level , the invalidation (stop) level and the measured-move target - and the panel shows

Short description Auto trendlines, channels and regression plus multi-timeframe FVG, Order Blocks, Liquidity Sweeps, CHoCH and Fib, with trend-colored candles. Non-repainting, Renko-ready. Full description Hybrid Analysis — Structure, Smart Money Zones & Auto Trendlines in One Indicator Hybrid Analysis combines automatic trendline analysis with multi-timeframe Smart Money Concepts on a single chart, so you can read trend, structure and key zones without stacking several indicators. WHAT IT DRAWS

MarketStructure – Smart Money Concepts & Trading Analysis for MT5 Understand market movements, identify key trading zones, and make more informed trading decisions with MarketStructure. MarketStructure is an all-in-one Smart Money Concepts (SMC) indicator designed for MetaTrader 5. It combines market structure, liquidity analysis, order blocks, fair value gaps, and multi-timeframe trend analysis into one powerful trading tool. Instead of switching between multiple indicators, MarketStructure bri

VWAP Sentinel — это комплексная система анализа VWAP , объединяющая несколько уровней расчета VWAP, постоянные исторические уровни VWAP, анализ отклонений и динамическую многосимвольную матрицу VWAP в единый интегрированный торговый инструмент. Это больше, чем просто обычный индикатор VWAP. VWAP Sentinel использует многоядерную вычислительную структуру, которая сохраняет предыдущие значения VWAP и уровни их отклонения, поддерживая их видимыми на графике до тех пор, пока цена не достигнет этих зн

Данный индикатор показывает наиболее вероятное на данный момент, прогнозное значение движения цены с целью сбора ликвидности. Главное преимущество - индикатор без перерисовки. Маленькими стрелками на графике обозначены каждые сигналы о направлении цены. Большими/Длинными стлелками указано направление цены к определенным уровням указанным на графике. С помощью данного индикатора можно реализовать стратегию "Охота на стопа / лося".

Торгуйте, когда спред низкий. Spread Monitor показывает текущий спред простыми словами (normal, a bit high, HIGH), обычный спред вашего брокера и лучшие и худшие часы дня, измеренные у вашего брокера за последние 20 дней. Спред — это расход в каждой сделке: на EURUSD один лишний пипс стоит 10 USD на лот. Около ночного ролловера и в тихие часы он может вырасти в разы, и стопы срабатывают из-за одного спреда. Теперь видно, когда ваш брокер дешёвый. ЧТО ВЫ ВИДИТЕ Спред сейчас со словом: normal, a b
FREE

Тестовый продукт. Пожалуйста, НЕ ПОКУПАЙТЕ! Тестовый продукт. Пожалуйста, НЕ ПОКУПАЙТЕ! Тестовый продукт. Пожалуйста, НЕ ПОКУПАЙТЕ! Тестовый продукт. Пожалуйста, НЕ ПОКУПАЙТЕ! Тестовый продукт. Пожалуйста, НЕ ПОКУПАЙТЕ! Тестовый продукт. Пожалуйста, НЕ ПОКУПАЙТЕ! Тестовый продукт. Пожалуйста, НЕ ПОКУПАЙТЕ! Тестовый продукт. Пожалуйста, НЕ ПОКУПАЙТЕ!
MetaTrader Маркет - единственный магазин, где можно скачать демоверсию торгового робота и подвергнуть его проверке и даже оптимизации на исторических данных.
Прочитайте описание и отзывы других покупателей на заинтересовавший вас продукт, скачайте его прямо в терминал и узнайте, как протестировать торгового робота перед покупкой. Только у нас вы можете получить представление о программе, не заплатив за неё.

Вы упускаете торговые возможности:
- Бесплатные приложения для трейдинга
- 8 000+ сигналов для копирования
- Экономические новости для анализа финансовых рынков
Регистрация
Вход
Вы принимаете политику сайта и условия использования
Если у вас нет учетной записи, зарегистрируйтесь