 MetaTrader 5
 Experts
 Indicateurs
 Bibliothèque
 Utilitaires
 Widgets
 Règles
Regardez les tutoriels vidéo de Market sur YouTube
Comment acheter un robot de trading ou un indicateur
Exécutez votre EA sur
hébergement virtuel
hébergement virtuel
Test un indicateur/robot de trading avant d'acheter
Vous voulez gagner de l'argent sur Market ?
Comment présenter un produit pour qu'il se vende bien
Indicateurs techniques pour MetaTrader 5 - 234
 Les signaux provenant des indicateurs techniques jouent un rôle crucial dans l'ouverture et la clôture des transactions sur les marchés boursiers et les marchés forex. L'essence des indicateurs est une transformation mathématique du prix d'un symbole financier visant à prévoir les changements de prix futurs. Testez les indicateurs techniques pour mieux prédire le comportement du marché et en tirer profit.

ROCKET4 SUPER TREND CHANNEL See the Trend. Read the Market. Identify Trading Opportunities. Stop guessing the market direction. Start reading it with confidence. ROCKET4 SUPER TREND CHANNEL is a professional multi-layer trend analysis indicator designed to help traders understand market direction, visualize dynamic price channels, and identify potential trading opportunities directly on their MetaTrader 5 charts. Whether you trade short-term moves or follow longer market trends, ROCKET4 provi

High Volume Pivot SR Zones Advanced Volume-Based Support & Resistance Indicator for MetaTrader 5 High Volume Pivot SR Zones is an advanced technical analysis indicator designed to identify important market support and resistance areas using pivot levels, price action, and volume-based analysis. The indicator helps traders identify potential market reversal zones, breakout opportunities, breakdown levels, and support/resistance retests directly on the chart. By combining pivot-based price levels
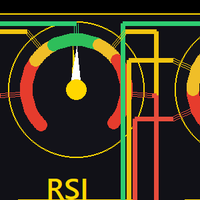
One chart. Five classic indicators. Three periods each. No sub-window clutter.
The Five-Stack Panel displays RSI, CCI, ATR, ADX and MFI at three periods simultaneously (defaults 7 / 18 / 28, all adjustable) in a compact on-chart panel, with a plain-language state tag for each reading:
- **RSI** — tag: OVERBOUGHT (≥70) / MID / OVERSOLD (≤30) - **CCI** — tag: STRETCH UP (>+100) / STRETCH DN (<−100) - **ATR** — shown in price units at your symbol's precision - **ADX** — tag: CHOP (<20) / WEAK TRE

Draws one Monday buy arrow and one exit arrow per week, based only on the bar time. Designed for GBPJPY H1.
This indicator marks one trade idea per week.
On Monday, it draws a buy arrow at the open of the 11:00 bar. On the same Monday, it draws an exit arrow at the open of the 23:00 bar, and a dotted line joins the two. Both times are server time on the reference clock (GMT+2 in winter, GMT+3 in summer).
The arrows depend only on the bar time and use the bar open price. An arrow never moves

Marks a buy signal when the 8-period EMA crosses above the 21-period EMA on a closed bar, with take-profit and stop-loss lines. Designed for gold H1.
This indicator shows one simple rule on the chart. It does not open or close trades.
When a bar closes and the fast exponential moving average (EMA, 8 periods, close price) has crossed above the slow one (21 periods), an up arrow is drawn under that bar. The idea is to buy at the open of the next bar. A green line shows the take-profit level (4.

Gemina Signals shows the trades of the Gemina Expert Advisor on your chart, for traders who prefer to place their orders themselves: an arrow where each trade starts, its stop loss and take profit, where it ended, and an alert when a new one comes. It uses exactly the same fixed settings as the EA. Checked trade by trade against the EA's own backtest (MT5 Strategy Tester, real ticks, January 2019 to October 2026): all 69 gold trades and all 70 USD/JPY trades start at the same bar in the same dir

IndexDip Signals shows the trades of the IndexDip Expert Advisor on your S&P 500 or Nasdaq 100 daily chart: where it buys, where it sells, how those trades did over the chart's history, and the state today. For traders who want to see the signals, or place the orders themselves. The settings are fixed and the same as the EA's, so the arrows are the EA's trades: the same entries and exits as the EA's own backtest on the same data. What you see An arrow under each bar where a trade starts and one
FREE

What this is Draws the high and low of a configurable session window together with the recent range history, so the levels that price has repeatedly reacted to are visible without hand-drawing them every day. What it does Marks the high and low of a configurable session window and keeps the last N sessions on the chart as boxes, with breakout levels extended to the right and each box labelled with its range in points. Session structure on demand at any hour window, drawn as the actual tradable b

What this is An ATR value of 12 points means very different things on EURUSD H1 and on gold M5. This indicator turns ATR into a percentile: the current ATR is ranked against the previous bars, and the result is plotted on a 0 to 100 scale with four bands. 20 means the market is quieter than 80 percent of the recent past; 90 means it is near the most volatile reading of the window. What it does Plots the percentile rank of ATR over a lookback window as a 0-100 oscillator with LOW / NORMAL / ACTIV

Nom : Volume Profile with Low Volume Nodes
Description courte : Volume Profile avec niveaux POC, Value Area, HVN et LVN. Taille de ligne automatique pour tout symbole. Buffers pour EAs.
Description complète : Volume Profile avec LVN indique où le volume de transaction s'est accumulé à chaque niveau de prix et identifie automatiquement les zones de faible volume (LVN) et de fort volume (HVN).
Fonctionnalités : - Histogramme de profil de volume par jour, semaine, mois, session personnalisée ou
FREE

MelloVWAP draws VWAP and volume profile on the chart from one indicator. Values on closed bars never change, so what you see in history is what you would have seen live. It needs no DLL and no external service.
VWAP - Session, weekly and monthly VWAP - Anchored VWAP: drag the vertical line to any bar and the line recalculates - Two deviation bands on the session VWAP - Session start can be shifted from server midnight - Session VWAP is hidden on D1 and above, where it has no meaning
Volume pro
FREE

MelloLiquidity maps two things on the chart: fair value gaps that have not been filled, and liquidity levels that have not been taken. When a bar wicks through a level and closes back, it marks a sweep. Everything is decided on closed bars, so history shows what you would have seen live. It needs no DLL and no external service.
Fair value gaps - A three-bar imbalance, with a minimum size in ATR so small gaps are ignored - Stays on the chart until filled. You choose what filled means: touched, m

Trend Range Breakout Pro détecte automatiquement les zones de consolidation (latéralisation) sur le graphique et indique le moment exact où le prix sort de ces zones.
CE QUE VOUS VEREZ SUR LE GRAPHIQUE
Zones de consolidation : lorsque le prix ralentit dans une fourchette étroite, l'indicateur trace un rectangle qui s'étend bougie après bougie jusqu'à la fin de la zone.
Ligne de tendance : une ligne basée sur une moyenne mobile qui change de couleur : vert — tendance haussière, rouge — tendan

Volume Profile OrderFlow Suite puts volume profiles, VWAP and tick order flow on one MetaTrader 5 chart, with one panel. It also measures how price actually reacted at the profile levels on your symbol, so you can see from your broker's own data whether a level has been worth watching. The panel always shows which data is used. Forex and CFD symbols in MT5 only have tick volume (the number of price changes), so on those symbols the buy/sell side is an estimate. Symbols with exchange trades use r
All classic chart patterns, with a track record. The indicator finds double and triple tops and bottoms, head & shoulders and inverse head & shoulders, ascending, descending and symmetrical triangles, rising and falling wedges, flags, pennants, rectangles and 1-2-3 reversals on your chart and on dozens of symbols and timeframes at once. Every pattern is drawn with its neckline or boundary lines, the breakout level , the invalidation (stop) level and the measured-move target - and the panel shows

Short description Auto trendlines, channels and regression plus multi-timeframe FVG, Order Blocks, Liquidity Sweeps, CHoCH and Fib, with trend-colored candles. Non-repainting, Renko-ready. Full description Hybrid Analysis — Structure, Smart Money Zones & Auto Trendlines in One Indicator Hybrid Analysis combines automatic trendline analysis with multi-timeframe Smart Money Concepts on a single chart, so you can read trend, structure and key zones without stacking several indicators. WHAT IT DRAWS

MarketStructure – Smart Money Concepts & Trading Analysis for MT5 Understand market movements, identify key trading zones, and make more informed trading decisions with MarketStructure. MarketStructure is an all-in-one Smart Money Concepts (SMC) indicator designed for MetaTrader 5. It combines market structure, liquidity analysis, order blocks, fair value gaps, and multi-timeframe trend analysis into one powerful trading tool. Instead of switching between multiple indicators, MarketStructure bri

VWAP Sentinel est un système d'analyse VWAP complet , combinant plusieurs couches de calcul VWAP, des niveaux VWAP historiques persistants, une analyse des écarts et une matrice VWAP multi-symboles dynamique dans un seul outil de trading intégré. Il s'agit de bien plus qu'un indicateur VWAP classique. VWAP Sentinel utilise une structure de calcul multicœur qui conserve les références VWAP précédentes et leurs niveaux d'écart, en les gardant visibles sur le graphique jusqu'à ce que le prix les at

This indicator shows the most probable current price movement, predicting the price movement for the purpose of collecting liquidity.
The main advantage is that the indicator does not repaint.
Small arrows on the chart indicate each price direction signal. Large/long arrows indicate the price direction toward specific levels indicated on the chart. This indicator can be used to implement the "Stop Hunt" strategy.

Moving Average ATR Channel Dynamic price channel around a Moving Average by applying Average True Range multiples. The channel consists of an inner and outer boundary on both the upper and lower side of the moving average, creating a visual “tunnel” that expands and contracts with market volatility. Default parameter values are completely untested and are not derived from any back-tested strategy or recommended trading system. They serve only as a starting point. All inputs — period, channel si

Click Anchored VWAP An interactive multi-anchor VWAP indicator that lets you place anchors directly on the chart with a single click. The Volume Weighted Average Price is calculated and drawn from the selected candle forward in real time. Click any existing VWAP line to remove it instantly. You can place multiple independent VWAPs at the same time, each with its own color, line width and style.

Trade when the spread is low. Spread Monitor shows the spread now in plain words (normal, a bit high, HIGH), the usual spread of your broker, and the best and worst hours of the day, measured on your own broker over the last 20 days. The spread is a cost on every trade: on EURUSD one extra pip costs 10 USD per lot. Around the daily rollover and in quiet hours it can jump many times, and stops get hit by the spread alone. Now you can see when your broker is cheap. WHAT YOU SEE Spread now with a w
FREE

This is the test product. Please, DO NOT BUY IT! This is the test product. Please, DO NOT BUY IT! This is the test product. Please, DO NOT BUY IT! This is the test product. Please, DO NOT BUY IT! This is the test product. Please, DO NOT BUY IT! This is the test product. Please, DO NOT BUY IT! This is the test product. Please, DO NOT BUY IT! This is the test product. Please, DO NOT BUY IT!
Découvrez comment acheter un robot de trading sur le MetaTrader Market, le magasin d'applications de la plateforme MetaTrader.
e système de paiement de MQL5.community prend en charge les transactions via PayPal, les cartes bancaires et les systèmes de paiement populaires. Nous vous recommandons vivement de tester le robot de trading avant de l'acheter, pour une meilleure expérience client.

Vous manquez des opportunités de trading :
- Applications de trading gratuites
- Plus de 8 000 signaux à copier
- Actualités économiques pour explorer les marchés financiers
Inscription
Se connecter
Vous acceptez la politique du site Web et les conditions d'utilisation
Si vous n'avez pas de compte, veuillez vous inscrire