 MetaTrader 5
 Эксперты
 Индикаторы
 Библиотеки
 Утилиты
 Виджеты
 Правила
Смотри обучающее видео по маркету на YouTube
Как купить торгового робота или индикатор
Запусти робота на
виртуальном хостинге
виртуальном хостинге
Протестируй индикатор/робота перед покупкой
Хочешь зарабатывать в Маркете?
Как подать продукт, чтобы его покупали
Новые технические индикаторы для MetaTrader 5 - 156
 На основании сигналов технических индикаторов принимаются решения относительно открытия или закрытия сделки на фондовом и форекс-рынках. Суть индикаторов заключается в математическом преобразовании цены и/или объемов финансового инструмента для прогнозирования изменений цен в будущем.
Протестируйте технические индикаторы, чтобы лучше предсказывать поведение рынка и зарабатывать на этом.

Price and Spread Indicator
Version: 1.0 Developer: Creative Tech Solutions Website: https://www.creativetechsolutions.co.uk
Overview The Price and Spread Indicator is a great tool for MetaTrader 5 that displays the Ask and Bid prices along with the spread directly on the chart. This indicator provides real-time updates and allows traders to make informed decisions based on accurate price information.
Features - Real-time Price Updates: Continuously updates Ask and Bid prices. - Spread Disp
FREE

MT5用 サブウィンドウにスプレッドとBUY SWAP(BS)とSELL SWAP(SS)を表示するインジケーターです。
表示の文字フォントの大きさと色の設定、スプレッドの表示をPIPS表示もしくはPOINTS表示切替が可能ですので、チャートの色設定などに合わせて、お好みでご利用いただけます。 サブウィンドウの表示サイズに合わせて、その中央に表示するようになっています。
(ご協力お願いします!) こちらは無料でご利用いただけます。どうぞご自由にご利用ください。 もしよければ MS High Low indicator も紹介していますので、どうぞご参照の上、DEMO版のダウンロードをお試しください!
Happy Trading :)
FREE
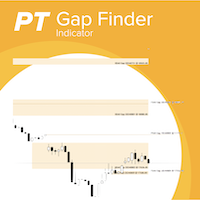
With the gaps finder indicator gaps between trading session are automatically added to you chart and you will never miss a gap which you can use in your trading strategies. Gaps often act as a magnet where the markets returns to or when a gap is closed often constitutes a reversal point.You don't have to draw manually gaps anymore. Key Features: Support for multiple trading sessions in a single chart, e.g market session and future session Configurable number of days to look back for gaps Highly

Elder Impulse Indicator Overview: The Elder Impulse Indicator is a powerful tool designed for traders who want to combine the strengths of trend-following and momentum strategies. Developed by Dr. Alexander Elder, this indicator helps traders identify potential entry and exit points by analyzing both price direction and momentum. It’s an essential tool for making informed decisions in various market conditions, whether you're trend-trading, swing trading, or looking for momentum shifts. Key Fea
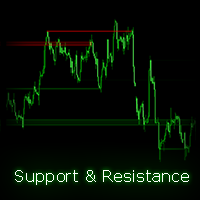
Автоматически находит и отображает каналы поддержки и сопротивления (S/R) на вашем графике, что облегчает идентификацию ключевых уровней. Индикатор поддерживает несколько таймфреймов, позволяя отображать каналы из разных таймфреймов на вашем текущем графике. Кроме того, он предлагает прозрачные цвета для улучшенной визуальной ясности и позволяет настроить цвета каналов по вашему усмотрению. Как работает этот индикатор? Индикатор находит точки разворота (highs и lows) в пределах диапазона, опреде

Candle Time Countdown от BokaroTraderFx
Простой, быстрый и легкий индикатор обратного отсчета свечи для MetaTrader 5.
Он показывает оставшееся время до закрытия текущей свечи, а также может отображать дневное изменение в % прямо на графике.
Функции: • Обратный отсчет свечи в реальном времени • Дневное изменение в % • Цветовая индикация положительного и отрицательного изменения • Настраиваемое положение на графике • Настраиваемый размер и цвет шрифта • Работа с различными таймфреймами MT5 • Л
FREE

The MS High Low Lines indicator is a tool designed to enhance trend visualization for MT5. It displays high and low prices as lines, using your preferred Moving Average (MA) settings (either SMA or EMA, with customizable periods). The indicator shows configured signals when prices break above or below these MAs. By setting it up with highly functional MAs, traders can better understand market trends and make trades with a statistical edge. You can modify settings and place multiple indicators o
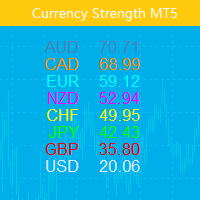
Этот индикатор показывает относительную силу 8 основных валют: USD, EUR, GBP, AUD, NZD, CAD, CHF и JPY. Значение прочности нормировано на диапазон 0-100: Значение выше 60 означает сильный. Значение ниже 40 означает слабость.
Входы Only Show Current Pair - если это правда, отображается только пара текущего графика, в противном случае отображаются все 8 кривых. Bars To Show – количество баров для отображения кривой силы. Ma Periods To Smooth Curves — периоды скользящей средней для сг

Представляем вам Support and Resistance Breakout MT5, важный торговый индикатор, разработанный специально для пользователей MetaTrader 5. Этот мощный инструмент автоматически определяет критические уровни поддержки и сопротивления, предоставляя трейдерам надежные сигналы на прорыв для сделок с высокой вероятностью на рынках forex, акций, криптовалют и товаров. С помощью Support and Resistance Breakout MT5 трейдеры получают преимущества в повышении точности выявления потенциальных разворотов и пр

VolaMetrics VSA | Мощный союзник в техническом анализе VolaMetrics VSA — это индикатор технического анализа, который сочетает в себе методологию Volume Spread Analysis (VSA) с детализированным анализом объема торгов . Он предназначен для идентификации и отслеживания значительных движений цен , используя взаимодействие между объемом и спредом цен , чтобы предоставлять ценные инсайты, которые могут помочь в принятии торговых решений. Основы Volume Spread Analysis (VSA) Volume Spread Analysis

Индикатор Balanced Work: Ваш Путеводитель в Мире Трендовой Торговли Balanced Work — это инновационный трендовый индикатор, созданный для точного определения направлений рынка и точек разворота. Этот алгоритмический инструмент рисует вдоль графика двухцветные точки, соединенные линиями, предоставляя трейдерам четкую визуальную информацию о трендах. Простота использования индикатора заключается в его цветовой кодировке: покупайте, когда появляется синяя точка, и продавайте, когда появляется красна
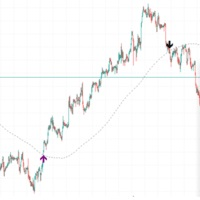
Если цена опускается выше медленной скользящей средней, может произойти прорыв. Если цена опускается ниже, на рынке может произойти откат. Об этом было известно давно, но индикаторов, сигнализирующих о событии, не так уж и много. В этом индикаторе также используется проверка свечных паттернов, поэтому сигналы не будут рисоваться на свечах доджи или небольших свечах «неопределенности». Продолжительность периода скользящего среднего может определяться пользователем (по умолчанию — 200). Количество
FREE
CLICK HERE TO JOIN OUR WHATSAPP GROUP.
This trading indicator Automatically identifies and plots contract blocks, which are essential zones marked by significant levels of support and resistance. This powerful tool provides traders with a clear and intuitive visualization of critical market points where prices are likely to bounce or reverse. The contract blocks, represented by distinct colored rectangles, highlight support zones (at the bottom) and resistance zones (at the top), enabling trad
FREE
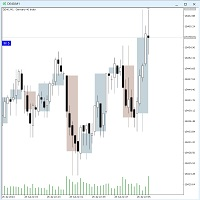
The Twotimeframe-Candles (RFrame) - Indicator for MT5 shows the candles of an higher, timeframe as an overlay on the current timeframe. You can choose the number of candles and color of the overlays. The indicator calculates the candle evevery tick. If you like the indicator, please left a comment. Version 1.1: The second time frame can now be set.
Keywords:
Candlestick, Multitimefram, Two Timeframes,
FREE

The ICT Immediate Rebalance Toolkit is a comprehensive suite of tools crafted to aid traders in pinpointing crucial trading zones and patterns within the market.
The ICT Immediate Rebalance, although frequently overlooked, emerges as one of ICT's most influential concepts, particularly when considered within a specific context. The toolkit integrates commonly used price action tools to be utilized in conjunction with the Immediate Rebalance patterns, enriching the capacity to discern conte

Простой индикатор для построения тикового графика. Этот индикатор позволит Вам отслеживать динамику спреда и поведение цены в целом. В настройках вы можете выбрать цену для отображения на графике - Бид, Аск или обе цены одновременно. Tick Chart Indicator точно будет полезн ым при использовании скальпингов ых стратегий.
Версия для МТ4 доступна здесь . Всем успехов и удачной торговли!
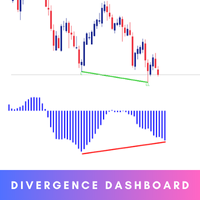
The Smart Divergence Dashboard is your ultimate tool for identifying high-probability trading opportunities. This cutting-edge indicator is meticulously designed to detect Regular Divergences, offering traders a clear and actionable advantage. MT4 Version - https://www.mql5.com/en/market/product/120702/ Key Features: Real-time Divergence Detection: Instantly pinpoints Higher High/Lower Low and Oscillator Higher Low divergences across multiple currency pairs and timeframes using Awesome Os
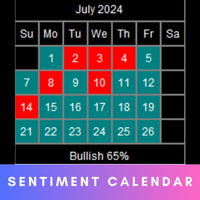
The Market Sentiment calendar provides a visual representation of market sentiment for each day or month. It will display daily and monthly BIAS . The calendar also highlights the percentage of bullish days or months within a given month or year. MT4 version - https://www.mql5.com/en/market/product/120767/ Inputs Frequency: Choose between "Daily" and "Monthly" calendar views. Sentiment Method: Select the method to determine daily or monthly sentiment: " L inear Regression ", " Accumu

The trendlines with breaks indicator return pivot point based trendlines with highlighted breakouts. Users can control the steepness of the trendlines as well as their slope calculation method.
Trendline breakouts occur in real-time and are not subject to backpainting. Trendlines can however be subject to repainting unless turned off from the user settings.
The indicator includes integrated alerts for trendline breakouts. Any valid trendlines methodology can be used with the indicator, users
Introducing the Gold Market Arrow Indicator, specifically designed for the 15-minute chart. This advanced tool provides clear and actionable buy and sell arrows, enabling traders to make timely and informed decisions in the gold market. Whether you're a seasoned trader or a novice, our indicator simplifies complex market data into straightforward signals, ensuring you never miss an opportunity to capitalize on gold price movements." This indicator works with a custom build in strategy The indic

Trend Stop Introduction Trend Stop is a simple yet powerful trend-following and stop-placement tool for MetaTrader 5.
It calculates the highest high or lowest low of the last N periods and plots a dynamic line that reacts instantly to trend changes. The result is a clean, reliable trend filter and a practical guide for placing optimal stop levels — without unnecessary noise or lag. Whether you’re a trend trader, swing trader, or scalper, Trend Stop helps you stay on the right side of the market

Easy Fibonacci — это индикатор для MT5, который позволяет легко наносить уровни коррекции Фибоначчи. Особенности До 10 уровней фибо можно задать в настройках индикатора. Каждый уровень может иметь различный стиль линии, цвет линии, ширину линии и другие настраиваемые параметры. Вы можете использовать мышь с дополнительными кнопками для отображения клавиш V и B и удобно наносить Фибоначчи. Действия кнопок: B и V: Нанесение Фибоначчи сверху/снизу на видимую область графика. N и M: Следующие и пред
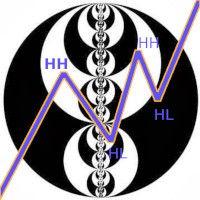
Индикатор структуры рынка на текущем таймфрейме находит: 1. Тенденцию (восходящие и нисходящие волны). Смена направления волны происходит после перебоя экстремума (снятия ликвидности с противоположной стороны). Отрисовка тенденции происходит с учетом внешних баров (на одном внешнем баре может быть 2 экстремума). Тенденция может отрисовываться с учетом минимального количества баров в волне (2 и более). Настраивается параметром QTY_bars_for_wave 2. BoS – слом структуры, обновление структурных ми

AtBot: Как это работает и как его использовать ### Как это работает Индикатор "AtBot" для платформы MT5 генерирует сигналы на покупку и продажу, используя комбинацию инструментов технического анализа. Он интегрирует простую скользящую среднюю (SMA), экспоненциальную скользящую среднюю (EMA) и индекс средней истинной амплитуды (ATR) для выявления торговых возможностей. Кроме того, он может использовать свечи Heikin Ashi для повышения точности сигналов. Оставьте отзыв после покупки и получите спе

Финансовый Индикатор SolarTrade Suite: Pluto Market Indicator - Ваш Надежный Проводник в Мире Финансовых Рынков!
Это осциллятор волатильности, который использует особые инновационные и передовые алгоритмы для рассчета своего значения, а также имеет приятный глазу дизайн.
Понять показания этого индикатора очень просто: зеленый цвет - низкая волатильность и лучшее время для открытия торговой сделки, оранжевый цвет - высокая волатильность и время подумать о закритии торговой позиции. Чем ярче цв
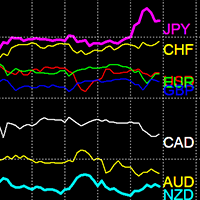
Индикатор силы валюты
Индикатор силы валюты — мощный инструмент для выявления тенденций. Он сравнивает силу и слабость различных валют и позволяет легко находить трендовые валютные пары.
Цена продажи: 49 долларов США.
Функции
Эффективно различает сильные и слабые валюты Автоматически определяет трендовые валюты Мультитаймфрейм Загружает 28 валютных пар Оптимизирована производительность
Использование индикатора Сильные валюты. Валюты выше 80 считаются сильными. Слабые валюты: Валюты ниже 20
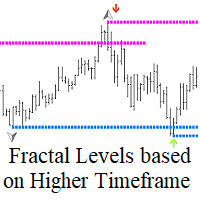
Fractal Levels based on Higher Timeframe э то мощный инструмент предназначен для построения точных уровней поддержки и сопротивления на основе фракталов со старшего таймфрейма, предоставляет вам сигналы на покупку и продажу с удобными оповещениями. Принцип работы: Индикатор анализирует фрактальные уровни на старшем таймфрейме и отображает их на вашем текущем графике. Вы можете легко настроить старший таймфрейм в свойствах индикатора, чтобы получить максимальную точность и соответствие вашим стра
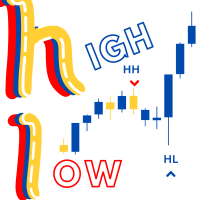
Swing High/Low Identifier Индикатор Swing High/Low Identifier для MetaTrader 5 (MT5) предназначен для выделения значимых точек разворота на вашем графике. Этот индикатор идентифицирует и отмечает высокие и низкие точки разворота на основе настраиваемого диапазона баров. Высокие точки разворота отмечаются красными стрелками над соответствующими свечами. Низкие точки разворота отмечаются синими стрелками под соответствующими свечами. Этот инструмент помогает трейдерам быстро обнаруживать важные це
FREE

IQ FX Gann Levels a precision trading indicator based on W.D. Gann’s square root methods . It plots real-time, non-repainting support and resistance levels to help traders confidently spot intraday and scalping opportunities with high accuracy. William Delbert Gann (W.D. Gann) was an exceptional market analyst, whose trading technique was based on a complex blend of mathematics, geometry, astrology, and ancient mathematics which proved to be extremely accurate. We don't offer free or bonus indic
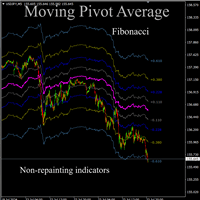
Moving pivot Average Fibonacci
The indicator compares the selected period with its counterpart from the previous period. The indicator determines the moving Fibonacci levels for the day or any time interval to assess the price movement range from the time average. The indicator helps predict the expected high or low for the day based on historical time data. The pivot line can be considered an average trend line and use it in a variety of trading strategies.
If you have any question about the
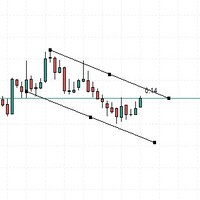
This indicator serves to give sound alerts when the price passes the manually placed line. A very useful tool, which allows you not to spend too much time sitting in front of the computer.
Note that the alert issued will always refer to the current candle, you can use multiple lines on the past chart to analyze.
This indicator will always receive better updates.
FREE

First and foremost, the Insight Flow Indicator stands out as a Non-Repainting, Non-Redrawing, and Non-Lagging tool. This makes it a prime choice for both manual and algorithmic trading, ensuring reliable and consistent signals. User Manual: Settings, Inputs, and Strategy The Insight Flow Indicator leverages price action, strength, and momentum to provide a clear edge in the market. Equipped with advanced filters, it eliminates noise and false signals, enhancing trading potential. By using multip

Session Bias This Strategy of bias useful for those who follow TRADESHARE on youtube. This script is designed by BokaroTraderFx for traders who want assistance in determining their session bias, particularly for those who trade within sessions typically represented by a single 4-hour candle. The method involves using price action to establish a daily bias, guiding decisions on whether to focus on buys, sells, or both. The analysis is based on the previous daily and 4-hour candle closes, fo
FREE

Translator MeraMera Custom Indicator for MetaTrader 5
Overview:
The MeraMera indicator is a powerful tool designed for MetaTrader 5, aimed at traders who prefer a decisive, high-risk-high-reward trading strategy. Its motto, "GO Full Margin or GO Home," encapsulates its aggressive approach to trading. This custom indicator analyzes market conditions to identify potential bullish and bearish signals, helping traders make informed decisions based on historical price patterns.
Key Features:
1. Bu

Dynamic Range and Target Indicator: Your Reliable Trading Partner
Introducing an innovative indicator that revolutionizes how you analyze markets and make trading decisions. Whether you're a beginner seeking clear guidance or an experienced trader looking to enhance your strategy, this tool is designed to meet your needs.
Key Features:
1. Dynamic Range Determination: The indicator continuously analyzes the market, identifying the most recent significant price ranges.
2. Clear Support an
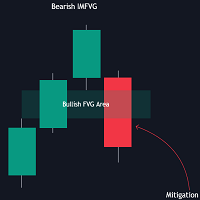
The FVG Instantaneous Mitigation Signals indicator detects and highlights "instantaneously" mitigated fair value gaps (FVG), that is FVGs that get mitigated one bar after their creation, returning signals upon mitigation.
Take profit/stop loss areas, as well as a trailing stop loss are also included to complement the signals.
USAGE Figure 1 Instantaneous Fair Value Gap mitigation is a new concept introduced in this script and refers to the event of price mitigating a fair value gap one
Here is a version for MetaTrader 5 of the famous Wave Trend indicator. Introducing the Wave Trend Oscillator Indicator for MT5 We are excited to present our Wave Trend Oscillator Indicator, exclusively designed for MetaTrader 5. This advanced tool is a must-have for traders who seek precision and efficiency in their trading journey. Our oscillator is built on the principles of wave trend analysis, capturing the ebb and flow of market trends with unparalleled accuracy. It helps traders identify p

The indicator places a buy or sell signal when the conditions of the strategy it was designed with are met. The strategy is guaranteed, strong, and has been tested for 9 years. The indicator is for binary options and can be converted into a bot by linking it to MT2Trading, where it sends the signal to this platform. This platform automatically opens a trade on the trading platform you are using, whether it is Pocket Option, IQ Option, or any other binary options platforms. The entry is on the n

The indicator places a buy or sell signal when the conditions of the strategy it was designed with are met. The strategy is guaranteed, strong, and has been tested for 9 years. The indicator is for binary options and can be converted into a bot by linking it to MT2Trading, where it sends the signal to this platform. This platform automatically opens a trade on the trading platform you are using, whether it is Pocket Option, IQ Option, or any other binary options platforms. The entry is on the ne

Version 1.5: manual color change added
This indicator helps to trade price action and momentum strategies like Guerrilla Trading or similar strategies.
The indicator displays: most recent highs and lows number of consecutive breaks past breaks of most recent highs and lows retest lines flag formations manual color change User can change colors. Go to Indictor Properties/Input, set "Auto Color" to false and change the colors. Set "Auto color" back to true to go back to pre-set colors. Please wa
FREE
This never-before-seen Indicator is a histogram of the MACD lines crossing. It has never been easier to observe a trend reversal in advance. It fixes the crossing points of the MACD lines on the chart according to your parameter settings. Ideal for anticipating trends and studying the stock market. Detailing the Indicator: It accurately indicates the crossing of the MACD and Signal lines, being later confirmed by the MACD indicator as confirmation of the trend. it confirms the macd crossing wit
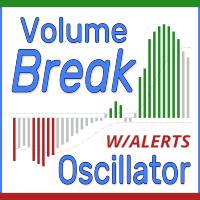
Volume Break Oscillator — это индикатор, который сопоставляет движение цены с тенденциями объема в форме осциллятора.
Я хотел интегрировать анализ объема в свои стратегии, но меня всегда разочаровывали большинство индикаторов объема, таких как OBV, Money Flow Index, A/D, а также Volume Weighted Macd и многие другие. Поэтому я написал этот индикатор для себя, я доволен его полезностью, и поэтому я решил опубликовать его на рынке.
Основные характеристики:
Он выделяет фазы, в которых цена движе

Финансовый Индикатор SolarTrade Suite: Mercury Market Indicator - Ваш Надежный Проводник в Мире Финансовых Рынков! В нашу компьютерную программу для форекса встроен мощный искусственный интеллект, который анализирует рыночные данные в реальном времени. Он точно прогнозирует изменения цен, помогая принимать обоснованные торговые решения. Благодаря продвинутым алгоритмам, наш индикатор оптимизирует стратегии и минимизирует риски для трейдеров. Это скользящая средняя, которая использует особые инн

Moving Pivot Average The Moving pivot indicator compares the selected period with its counterpart from the previous period. The indicator uses very flexible algorithm for pivot value calculating. It allows you to allocate in days a certain time intervals (custom bars) and calculate the average pivot value based on High, Low and Close prices of these bars. How many custom bars will be taken into account is determined by the "Days" setting. The pivot line can be considered an average trend line
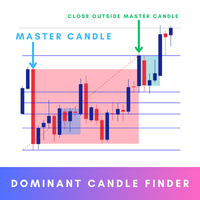
Dominant Candle Finder is a significant candlestick on a price chart that stands out due to its size, volume, or price movement compared to surrounding candles. It often indicates strong buying or selling pressure and can be used to identify potential reversal points, breakouts, or continuations in the market. Dominant candles can serve as key indicators for traders to make informed decisions, providing insights into market sentiment and potential future price movements. MT4 Version - https://w

A MUST HAVE - NON REPAINT INDICATOR - that will help you to make the decision whether to Buy or Sell , including where to set the Take Profit and Stop Loss . The Buy/Sell signal will not redraw nor repaint until the next new signal occurs. The Take Profit and Stop Loss will change following the market conditions. Our indicator will give alert to your mobile/handphone when new buy/sell signal arrive. For best result, combine this indicator with your knowledge on price action and support & resista

If you like this project, leave a 5 star review.
Follow on TikTok: @quantum.trader
[ Any Symbol Can Be ADDED ] DM me for adding any Pair symbol, crypto, index, stock or anything related. you can also DM me in TikTok [@quantum.trader] Works on [ EURUSD-GBPUSD-GBPJPY-USDJPY-XAUUSD-US30-BTCUSD-ETHUSD-SOLUSD ]
This indicator calculate and draw the Prediction or Forecast the peaks of the current day ( forecast high - forecast low - forecast middle - forecast upper q - forecast lower q

Rivoluziona il Tuo Trading con l'Indicatore di Segnali Scalping su Timeframe Multipli Scopri il segreto del successo nel trading con il nostro esclusivo indicatore di SEGNALI scalping su timeframe multipli. Questo strumento avanzato è progettato per trovare segnali efficienti e precisi, aiutandoti a massimizzare i profitti e a ridurre i rischi associati al trading veloce L'indicatore di segnali Alien Scalper MTF è uno strumento di analisi tecnica altamente efficace, progettato per identificare

Price Sessions is an exclusive MetaTrader 5 indicator that integrates symbol information and trading sessions into your chart. It does not link to any account information or external sources, ensuring user safety. Main Features: 1. Symbol Information Current Symbol Live Price Live Spread 2. Trading Sessions (Time zone UTC/GMT+0) Tokyo session London session New York session If you find this utility helpful, please rate it. If you encounter any issues or have suggestions, pleas
FREE
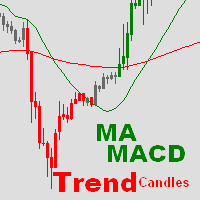
COLORED TREND MA / MACD CANDLES draw MA Candles above/below Moving Average draw MACD Candles above and below 0 and Signal-Line
Your Advantage: a simple view of the trend direction a simple view over the higher trend direction a calmer chart for the eye clear rules can be defined Settings: Value Quick-Set : pre-Settings MACD 3 / 9 / 6 MACD customize MA Candles Fast EMA : 12 Slow EMA : 26 MACD SMA : 9 1. MA Period : default 14 and 20, which are my favorite for all timeframes, I believe in the 14
FREE
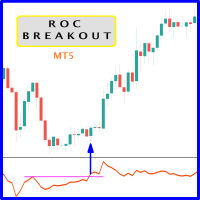
When prices breakout resistance levels are combined with Rate of Change oscillator "ROC" oscillator breaks out its historical resistance levels then probability emerges to record farther prices. It's strongly encouraged to confirm price breakout with oscillator breakout since they have comparable effects to price breaking support and resistance levels; surely, short trades will have the same perception. Concept is based on find swing levels which based on number of bars by each side to confirm
FREE
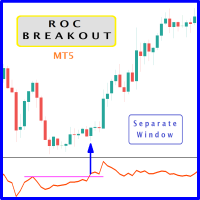
When prices breakout resistance levels are combined with Rate of Change oscillator "ROC" breaks out its historical resistance levels then higher chances emerges to record farther prices. It's strongly encouraged to confirm price breakout with oscillator breakout since they have comparable effects to price breaking support and resistance levels; certainly short trades will have the same perception. Concept is based on find swing levels which based on number of bars by each side to confirm peak or
FREE
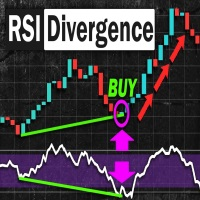
RSI Divergence Signal
The RSI Divergence Signal is a technical analysis tool used in financial markets to identify potential trend reversals. It compares the Relative Strength Index (RSI) with price action to detect divergences. When the RSI moves in the opposite direction of the price, it signals a potential change in momentum, suggesting that the current trend may be weakening. This divergence can indicate a buying opportunity in a downtrend or a selling opportunity in an uptrend. Traders u
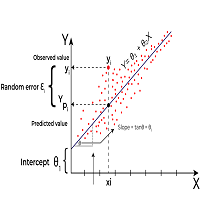
Linear Regression is a statistical method used to model the relationship between two or more variables. The primary goal of Linear Regression is to predict the value of one variable (called the dependent variable or outcome variable) based on the value of one or more other variables (called independent variables or explanatory variables) Linear Regression can be applied to technical analysis, and it is indeed one of the tools used by traders and analysts to make predictions and identify trends i
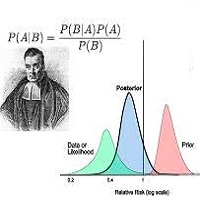
Bayesian methods can be effectively applied to predict price trends in financial markets, including Forex, stocks, and commodities. Here’s how Bayesian techniques can be used for trend prediction: 1. Bayesian Linear Regression Bayesian linear regression can be used to model the relationship between time and price. This method allows for the incorporation of prior beliefs about the trend and updates the trend as new data comes in. Example: Suppose you want to predict the price trend of a currency
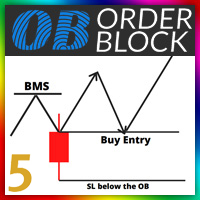
Orde Block Detector: The order block detector can automatically identify the breakthrough of the market structure. After the trend framework breaks through, the order block area can be drawn automatically. In order to draw the OB area more accurately, we also automatically find the candle on the left and right sides of the original candle according to its trading principle, and draw a more accurate ob area through more subtle quantitative rule judgment. Futures : 1. Customize the BMS color, a
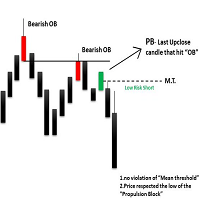
The ICT Propulsion Block indicator is meant to detect and highlight propulsion blocks, which are specific price structures introduced by the Inner Circle Trader (ICT). Note: Multiple Timeframe version avaiable at here
Propulsion Blocks are essentially blocks located where prices interact with preceding order blocks. Traders often utilize them when analyzing price movements to identify potential turning points and market behavior or areas of interest in the market.
USAGE (fingure 1)

Description The Profit and Loss Indicator by Creative Tech Solutions is a robust and comprehensive tool designed to help traders monitor their trading performance in real-time. This indicator provides detailed metrics on profits and drawdowns, ensuring traders are always informed about their trading activities and performance. With customisable alerts and display settings, this indicator is an essential tool for any serious trader. Features Real-Time Metrics : Monitor profit and drawdown percent
FREE
This indicator will draw lines for previous day Highs and Lows, current day open price and current day price plus and minus ATR. This will provide an overview of the support and resistance for the price movement of the current trading day. The ATR is fixed to the 1 day period, so this indicator is suitable for the time frames lower than 1 day, i.e. 4HRTF, 1HRTF or 15MTF.
You can change the indicator looks but this is only applicable on Windows Platform. It will not work in Linux/Wine environme
FREE
Этот новостной помощник предназначен для получения необходимых трейдерам экономических событий из основных издательских источников, которые публикуют новости в режиме реального времени на основе «Обзора рынка» терминала с различными и простыми фильтрами.
Трейдеры Форекс используют макроэкономические индикаторы для принятия обоснованных решений о покупке и продаже валют. Например, если трейдер считает, что экономика США будет расти быстрее, чем экономика Японии, он может купить доллар США и про
FREE

Этот продукт предназначен для отображения торговых сессий 15 стран на основе часового пояса вашего брокерского сервера и различных режимов отображения на основе желаемых вами настроек для предотвращения перегрузки графиков и возможности установки сессии в желаемое пользователем время.
На рынке Форекс никогда не заходит солнце, но его ритм танцует в такт отдельным торговым сессиям. Понимание этих сессий, их совпадений и их уникальной атмосферы имеет решающее значение для любого трейдера форекс,
FREE

ObieTrader представляет собой индикатор краткосрочных сигналов. Используется для внутридневной торговли. ObieTrader определяет краткосрочный тренд, используя индикатор процента R Уильямса и средний истинный диапазон. Когда индикатор подтверждает краткосрочный тренд, он отображает на столбце семафоры, показывающие тренд. Столбцы с красными точками указывают на нисходящий тренд, а столбцы с синими точками указывают на восходящий тренд.
Когда тренд определен, открывайте позиции в направлении трен

Наш индикатор BOOM SELL ALERT специально разработан для анализа свечей на BOOM 1000. BOOM 500 — это инструмент, оптимизированный для таймфрейма M1 (1 минута), гарантирующий получение своевременной и действенной информации. Индикатор представляет собой комбинацию многих индикаторов. - АО-осциллятор - Стохастик КАК ИСПОЛЬЗОВАТЬ ЭТОТ ПОКАЗАТЕЛЬ Чтобы хорошо использовать этот индикатор, необходимо использовать SCHAFF TREND RSX (5 MIN OR M5). ЕСЛИ тренд SCHAFF RSX ЗЕЛЕНЫЙ, и у вас есть сигнал, тогда

Insight Pro is a comprehensive tool for market analysis. It offers various features such as trend analysis, resistance and support levels, and distribution analysis, suitable for both novice and experienced traders. Features Trend Analysis Detects and visualizes market trends. Suggests potential entry and exit points based on trends. Customizable trend lines for clear market direction. Displays extreme levels based on standard deviation. Positive slope indicates buy orders; negative slope indic
Contact me for instruction, any questions! Introduction V Bottoms and Tops (or Fibonacci Retracement) are popular chart patterns among traders due to their potential for identifying trend reversals. These patterns are characterized by sharp and sudden price movements, creating a V-shaped or inverted V-shaped formation on the chart . By recognizing these patterns, traders can anticipate potential shifts in market direction and position themselves accordingly. V pattern is a powerful bul
Unlock the power of Fibonacci with our advanced indicator!
This tool precisely plots Fibonacci levels based on the previous day's high and low, identifying the next day's key support and resistance levels. Perfect for day trading and swing trading, it has consistently generated weekly profits for me.
Elevate your trading strategy and seize profitable opportunities with ease.
NOTE: In the Input section make sure the draw labels are set to "True" so you can see each levels.
Overview: Elevate your trading strategy with the Advanced SuperTrend Buy Sell Signals Indicator! Designed for both novice and professional traders, this indicator provides clear and accurate buy/sell signals based on the popular SuperTrend algorithm, enhanced with customizable parameters and visual alerts. Features: Clear Trend Visualization: Identifies UpTrends (green line) and DownTrends (red line) with precision. Customizable Parameters: Adjust ATR period and multiplier to fit your trading s
FREE

Magnified Price Experience trading like never before with our Magnified Price indicator by BokaroTraderFx , designed exclusively for MetaTrader 5. This revolutionary tool provides traders with instant insights into price movements, offering a clear advantage in today's fast-paced markets.
Key Features: 1. Real-time Precision: Instantly magnify price action to uncover hidden trends and patterns. 2. Enhanced Visibility: Clear visualization of price movements with adjustable zoom levels. 3. User
FREE
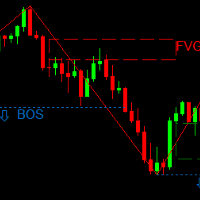
Contact me for any queries or custom orders, if you want to use this in an EA. Key Features: Pattern Recognition : Identifies Fair Value Gaps (FVGs) Spots Break of Structure (BOS) points Detects Change of Character (CHoCH) patterns Versatile Application : Optimized for candlestick charts Compatible with any chart type and financial instrument Real-Time and Historical Analysis : Works seamlessly with both real-time and historical data Allows for backtesting strategies and live market analysis Vis

The indicator is based on the relationship between two sets of Stochastic lines. The first set consists of 6 Stochastic with periods: 5, 8, 10, 12, 14, 16. The second set consists of 6 Stochastic with periods: 34, 39, 44, 50, 55, 60. These periods are customizable. Input parameters Stochastic MA Method Method of calculation ===== Short-term ===== Stochastic #1 %K Period Stochastic #2 %K Period Stochastic #3 %K Period Stochastic #4 %K Period Stochastic #5 %K Period Stochastic #6 %K Period Short
FREE
А знаете ли вы, почему MetaTrader Market - лучшее место для продажи торговых стратегий и технических индикаторов? Разработчику у нас не нужно тратить время и силы на рекламу, защиту программ и расчеты с покупателями. Всё это уже сделано.

Вы упускаете торговые возможности:
- Бесплатные приложения для трейдинга
- 8 000+ сигналов для копирования
- Экономические новости для анализа финансовых рынков
Регистрация
Вход
Вы принимаете политику сайта и условия использования
Если у вас нет учетной записи, зарегистрируйтесь