Смотри обучающее видео по маркету на YouTube
Как купить торгового робота или индикатор
Запусти робота на
виртуальном хостинге
виртуальном хостинге
Протестируй индикатор/робота перед покупкой
Хочешь зарабатывать в Маркете?
Как подать продукт, чтобы его покупали
Торговые роботы и индикаторы для MetaTrader 4 - 56
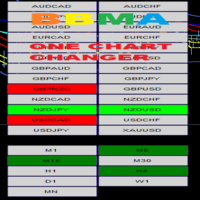
This is Mini Dashboard of BBMA with Reentry Signal and Trends. *More convenience to change any symbols in One Chart. *Multipairs and Multi Timeframe
Reentry Signal : Are based on BBMA Method . You can select any Time Frames to scan the current signals of Reentry. RED BUTTON = REENTRY SELLS GREEN BUTTON = REENTRY BUY
Trends : Multi Time Frames Are based on BBMA Method. GREEN BUTTON = TREND UP RED BUTTON = TREND DOWN.
Inputs: MultiPairs : any list of symbols. Options to attach indicator on
This Relative Strength Index version using four different Period. Calculate on Timeframe M1, M5, M15, M30, H1, H4 and D1. Each using median price for valid average calculation.
How to use this indicator, as follows; 1. This indicator design for FOLLOW THE TREND, not using for Overbought or Oversold, but if you want to use it as Reversal trades, is up to you. 2. You can see on pictures attachment, it produce three type of signal, LONG, SHORT and SIDEWAYS. 3. Recommended for trading, Open trad
One Shoot Expert Advisor. This expert advisor was designed specifically for the USD / JPY Forex market. Its operation is based on a multi time frame moving average strategy, so it can be classified as a trend expert. When the trend has consolidated on one direction the algorithm buys or sells the currency pair. In the event of a trend inversion, there is a fixed stop loss, while the take profit is variable with the trailing stop function. For this reason the platform must always be connected to

Hello and welcome to Parabolik EA developed by OPTIMIZFX!
Parabolik EA was created to take advantage of the Parabolic SAR and uses Moving Averages to determine the Correct Trend for entry. Parabolik can be used on any time frame and any pairs, the higher the time frame (1H to 4H) the better the entry but the slower the profits. M5 is recommended, M1 you can expect poor entries, the recovery system makes up for poor entries.
3 WAYS TO TRADE PARABOLIK EA - FIXED LOT SIZE | Leave Multiplier ON
Super Oscillator is an ea based on the super oscillator indicator. https://www.mql5.com/es/market/product/59070 This ea uses the indicator's trend exhaustion signal to initiate a countertrend strategy. The system has a costly lotage, although it can have more than one operation open at a time It does not require large capital or margin requirements to be operated.
You can download the demo and test it yourself. Very stable growth curve as result of smart averaging techniques.
"Safety firs

Индикатор Reversal Trend , который пересчитывает значения за новый период, не изменяя предыдущие. По статистике, более 85% трейдеров, предпочитающих агрессивную торговлю, терпят убытки. Спешка и желание получить прибыль немедленно заставляют их часто открывать ордера наудачу, что очень похоже на игру в казино. Итог неутешителен: несколько сделок, возможно, и принесут прибыль, а затем убытки. Чтобы понимать динамику рынка и использовать ее для получения прибыли, необходимо научиться пользоваться

This version of the MACD named MACD Platinum is the MACD indicator calculated with ZeroLag moving averages (ZLEMA) .
ZLEMA is an abbreviation of Zero Lag Exponential Moving Average . It was developed by John Ehlers and Rick Way. ZLEMA is a kind of Exponential moving average but its main idea is to eliminate the lag arising from the very nature of the moving averages and other trend following indicators.

Индикатор тренда Trend Logic дает возможность классифицировать направление ценового движения, определив его силу. Решение этой проблемы помогает вовремя войти в рынок и получить хорошую прибыль. Для любого трейдера крайне важно правильно определить направление и силу трендового движения. К сожалению, единственное верное решение этой задачи отсутствует. Множество трейдеров торгуют на различных временных интервалах. По этой причине получаемые сигналы воспринимаются субъективно. Индикатор достаточ
Super Oscillator , is a powerful indicator that vibrates along with the market, resulting in a very useful tool to improve and decide your trading.
You can download the demo and test it yourself.
In a versatile indicator that in a single graph shows us information about four different aspects of the market
1) 4 operational zones. The indicator divides the screen into 4 zones that allows us to properly assess the moment of the market. a) Pullback Buy Trend. If the indicator is above 80,

This indicator automatically plots Yearly High , Yearly Low and Yearly Average price levels from the previous year. It also builds two additional equidistant parallel levels ( Extended Highs R2 , R3 / Extended Lows S2 , R3 ) extended from previous Year High / Low. Extended High R3 / Low S3 is 100 percent Low-to-High extension ( as in Fibonacci 100 % extensions ) above / below the previous Year H/L and is the final reversal level with a sure reaction. Extended High/Low R3/S3 represent the ulti
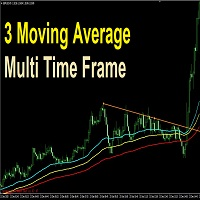
The simplest and profitable strategy is to break the trend of the small time frame in the direction of the big time frame.
3 moving average multi time frame is for those who trade on a 5-minute frame and want to enter with the direction of the hour; Or trade on the hour and want to enter with the daily trend, or the minute with the quarter hour trend.... This indicator draw three moving averages that show the direction of the big trend and help to enter with the end of the correction ,and re

Trend Anthropoid - трендовый индикатор который позволяет эффективно определять направление текущего тренда, а также выявлять потенциальные точки его разворота. Индикатор дает возможность классифицировать направление ценового движения, определив его силу. Решение этой проблемы помогает вовремя войти в рынок и получить желаемый результат.
Начнем с преимуществ. Позволяет определить текущий тренд. Вы можете достаточно быстро понять, какая именно тенденция в данный момент развивается на рынке; Мож

DNA is an indicator that allows us to operate both in favor of a trend and a pullback. You can download the demo and test it yourself.
Trend trading is above zero and pullback trading is below zero.
The direction of the operation is marked by the color of the line.
If the line is green it corresponds to purchases.
If the line is red it corresponds to sales.
For example, if the green line is above zero and growing, we will have an uptrend operation. If the red line is above zero and
Hundreds of possible combinations and only two strategies. By using automated software like an EA, you can benefit from the following advantages: it can trade while you are sleeping, it is not susceptible to emotions and you can quickly run backtests. However, it is hard to ascertain whether an EA will help you to achieve consistent profits. Lots of EAs are profitable on a demo account, but for some unknown reason, when the trader tries to apply it on a live account with their own funds, suddenl
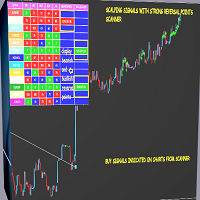
REVERSAL SIGNALS SCALPER SCANNER
Indicator is a multi purpose tool and very useful to know the EXTREME TURNING POINTS of any pair / stock/ commodity. The extreme levels can be input and it will show you when those levels have reached . So that you can plan your EXTREME REVERSAL TRADES . It is a MULTI TIME FRAME TREND ANALYSIS TOOL AND IT WILL suggest probable changes in the trend and swing . It is very useful for day trading , scalping, and swing trading .
SPECIAL FEATURE - CLICK ON THE RE
Dual Trend Scalper
Advantages You Get
Easy, visual and effective trend detection. you can find the IMPULSE COLOR PANEL FOR QUICK TREND DETECTION Gives you the ability to filter and further improve your trading strategies. YOU HAVE TREND DETECTION IMPULSE FILTER , AS WELL AS 2 LEVELS OF SUPERTREND. Enhanced statistics calculation following the entry point, take profit and exit signal. ENTRY CAN BE AS PER VARIATION OF SETTINGS AND PARAMETERS, SL AND TARGETS ALSO CAN BE ADJUSTED Neve
REVERSAL AREA INDICATOR
This Indicator will generate signals on top and bottom of the swings .
It will check for some support and resistance found and generate the signals at such areas. There is high probability of the price moving in favorable directions as they are signals when there is support and resistance . The advantage is that the entries will have small stop loss and high risk to reward ratios as they are near tops and bottoms. 1. This is an indicator that will provid

You ask yourself the question every time you open your charts: how to win in trading? Will using a lot of indicators work? well know that I also asked myself the same questions when I first started trading. After testing many indicators, I realized that winning trading is simple and accurate trading. after several months of thinking and optimizing I was able to find my solution: Candle Good Setup Candle Good setup is a trend and entry timing indicator analyzing the market in multi-frame to g
Pullback Probability It is an indicator that shows us the probability that the price will t urn around and we can operate that market turn.
The indicator marks a line that oscillates between a percentage of 0% to 100%.
The one indicated in the upper left corner shows us a help in which it informs us of the area in which the price is in real time, as well as the percentage that the candle is open. You can download the demo and test it yourself.
The indicator marks 6 work zones. 1) Ab
Supply and Demand Dashboard
Supply and Demand Dashboard is a forex system that can help you generate lucrative profits from forex easily without having to work hard to learn forex knowledge because this Dashboard is complete with all the needs and functions that are sophisticated and effective for a forex trader.
This system is made based on Supply and Demand techniques to measure Market Direction (trend) more accurately than using indicators such as Moving Average, MACD, trendline and so

SureWIN is a very simple either "trend-following" or "trend reversal" trading program you can use. There are only few input values you may need to modify. This EA ensures the correct trend is being checked. SureWIN can generate profit in the long run even with just a 100 trading capital. Capital can be in US dollars or in US cents (USD or in any currency you prefer). Based on tests, it would be best to have 1000 capital for every pair you are trading. (Ex. 3 pairs = 3000 balance.) Visit my M

Chef Moving Power
Chef Moving Power brings to your door step the exact strategies the big companies, CTAs(Commodity Trading Advisors), trend followers or managed futures traders uses. its an Expert Advisor that utilizes the power of moving Average to its fullness. 80% of indicators and Expert Advisor carries Moving Average and therefore it has more control of price than any indicator in the market. Chef Moving Power brings 3 moving average strategy that suite your taste of trade , these strate
LordMACDSignal is an indicator for META TRADER that uses the MACD trend of the financial market by default and principle.
LordMACDSignal has been optimized with MACD indicator to analyze the trend through candles and detect the next movement.
LordMACDSignal sends signal alerts about a trend of upward or downward divergence, and also reports possible reverse situations in overloaded pairs. Made with love and care, Join Telegram Group: https://t.me/expertlord

B I G C H I E F P R E M I U M
Big Chief is an Expert Advisor that runs its own 2 proprietary analysis & algorithms. No indicator is used to analyze the entry point in the first method and the second method has an Ichimoku Indicator with proprietary settings. For the exit plan, it uses the proprietary Sequence Method & implement the cutlosses-let-profit-run strategy. You will be surprised that at the closing of all trades, almost most of them are having a positive profit and a

This MACD Magic indicator coded due to inspired in a another similar indicator ,Here Macd Magic calculate Double trend confirmation. With ATR Ratio Based TP point , ATR value input are available in input settings . MACD Magic indicator provides Accurate signals on all Major currency pair and stocks. This indicator Very easy to analysis trend and set target point
This is Supply Demand Indicator based on Fractal , RSI and Stochastic Oscillator . It have Six Cover Option, you can do adjust your needed by set to true or set to false: ------------------------ Option 1: UseTrendFractal = true; UseRSI = false; UseStochastic = true; ------------------------ Option 2: UseTrendFractal = true; UseRSI = true; UseStochastic = false; ------------------------ Option 3: UseTrendFractal = false; UseRSI = false; UseStochastic = true; ------------------------ Option 4: Us

MoMo Trade MT4 (MT5 версия https://www.mql5.com/ru/market/product/59093 ) - это торговая система реализующая одну из стратегий моментума. С помощью простых и проверенных инструментов, таких как гистограмма MACD и EMA советник ищет точки входа. Стратегия ориентирована на разворотные модели после трендового участка. Советник рассчитан для работы на М5 таймфрейме и ориентируется на краткосрочные цели по прибыли. Также есть возможность работы на других таймфреймах. Расчет объема
Значение лота либо

STRATEGY : INVEST 1/3 Withdraw 1/3 each Balance DOUBLING / TRIPLING !!!! EA works on trend and trend reversal on any timeframe : results given on M5 Timeframes with moving average from 500 to 1000 EA works on any symbols and gave good results : I made lot of testing on EURUSD EA opens trades with trend using moving averages you Set the Lot Risk " LotSafety " input : 1 High risk lot --> High Profit but also you will STOP OUT so that you will must use the "Invest 1/3 Withdraw 1/3 Strategy"

THE SOUND OF MARKET is an indicator designed to detect the sound produced for the market movement. This system detects the background sound produced by market movements in real time to decide in your operation. In addition, by analyzing the sound recorded in the indicator, we can detect operational patterns. You can download the demo and test it yourself.
The indicator has a text help in the upper right corner, in which it shows whether the indicator has a bullish or bearish backgro

T I P T O P P R E M I U M
Tiptop is an Expert Advisor that runs its own proprietary analysis & algorithm. No indicator is used to analyze the entry point. It based it only with each price bar movement & closing price. Same logic w/ Volatility Watcher. For the exit plan, it uses the proprietary Sequence Method & implement the cutlosses-let-profit-run strategy. You will be surprised that at the closing of all trades, almost most of them are having a positive profit and almost
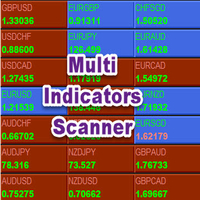
Multi Indicators Scanner Indicator Scan ADX ,Moving Average ,ENVELOPE ,SAR , MACD ,RSI and ATR . We can change all input parameters in chart window. scanner works Multiple Time Frame we can change Timeframe . Symbol button based on Trend color , we can click button and open chart . We can also save templates in input. Default settings Time Frame 1Hour Templates Name Default Auto Arrange Chart true
Asa Line Alert is support horizontal line and trend line when the price touch some horizontal or trend line in the graph they will alert you with Line Notify Application.
Main Features Ability to check and alert horizontal line
Ability to check and alert trend line.
Easy to use .
How to use
STEP 1 : Make Group for Alert
Create group LINE in your LINE Application
STEP 2 : Create Token for Line Notify
Go to https://notify-bot.line.me/ login and create a token
STEP 3 : Invite Line No

Introducing High Fly - the Ultimate Trading Ace! This fully automated trading system is designed to elevate your trading game with its advanced algorithm and innovative features. High Fly utilizes a unique combination of technical analysis, artificial intelligence, and machine learning to provide traders with reliable and profitable trading signals. High Fly's powerful entry and exit logic operates solely on Bar Close, eliminating market noise, optimizing speed, and avoiding stop loss hunting,
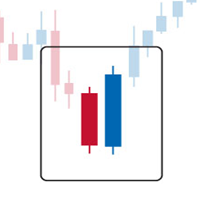
Engulfing Dashboard is a forex system that can help you generate forex profits easily without having to work hard to learn forex knowledge because this Dashboard is complete with all the facilities and functions that are sophisticated and effective.
This system is made based on Supply and Demand techniques to measure Market Direction (trend) more accurately than using indicators such as Moving Average, MACD, trendline and so on. It is made using a certain formula so that the accuracy of the m

Cloud Stair is an Indicator has 2 Cloud (Up Trend and Down Trend). Cloud will turn Red when trend go down. Cloud will turn Blue when trend go up. You can use this indicator as a Support and Resistance level. Trend very strong when there are no opposite side. Open Buy position when the indicator show blue cloud and no red cloud. Open Sell position when the indicator show red cloud and no blue cloud.

The San Andres Fault is an indicator designed to detect the movements that make the market tremble. This system detects a tremor and marks its intensity in real time to decide in your operation. In addition, the recording of the sismic signal allows us to interpret movement patterns that help us in decision making You can download the demo and test it yourself.
The indicator has a text help in the upper right corner, in which it shows whether the indicator has a bullish or bearish b

GOLDTRON is a Trend Momentum Algorithm Expert Advisor, specializing on GOLD. It tries to only look for trades on safer periods of the day.
Extremely SIMPLE & EASY-TO-USE, with settings optimized at the backend already. Just set to your desired Risk level and go!
Most of the time, the trades will TP with 1 entry. Like a experienced human trader, It can utilize several grid averaging trades to gain a overall winning edge.
BACKTEST SETTINGS (make sure u have 90-99% tick quality from history

Это трендовый индикатор без перерисовки Разработан вместо стратегии бля бинарках опционов (по цвету свечи мартингейл) Так же хорошо работает в торговле на рынке форекс
Когда открывать сделки ( бинарные опционы )
Сигнал появится в месте с свечой сигналит на текущую свечу Открывать сделку стоит на одну свечу текущего таймфрейма рекомендуется м1 и М5 При появлении синей точки открываем сделку вверх При появлении красной точки открываем сделку в низ.
Как открывать сделки на Форекс.
При полу
Magic Panel for MT4 is a Menu based Trading Panel. with the help of Magic Panel traders will be able to access various trading tools right from Menu Panel in MetaTrader Chart. All tools are one click to activate and another click to deactivate its that simple. Current version of Magic Panel comes with. - Trend Scanner. - Five in One Pivot Point. - Currency Strength Meter. - Multi Symbol Heat Map Scanner. - Auto Trend Line. - Symbol Search Box. - Symbols Dropdown Menu. - One click object Clear
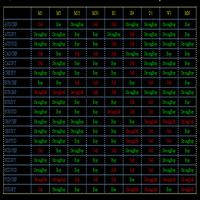
MACD MULTI TIME FRAME WITH MULTI SYMBOLS INDICATOR MACD MTF Indicator visualize all MT4 time frame and trend based on Moving Average Convergence Divergence (MACD) strategy . Indicator have settings for MACD customizing and variable "Symbols "EURUSD,USDCHG,...", which is used to define symbols. , Signals are displayed Buy , Strong buy , Sell, Strong Sell, ### - No Trend Strong Description The Moving Average Convergence/Divergence indicator is a momentum oscillator primarily used to tr
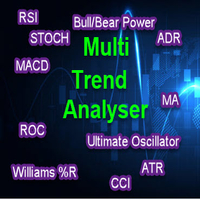
Multi Trend Analyzer MT4 indicator provides signals from the following technical trading indicators: RSI, STOCH, STOCHRSI, MACD, ADX, Williams % R, ATR, Oscillator, ROC and Bull/Bear Power. It supports all time frames, from the 1 minute up to the monthly charts. You can change all indicator inputs. Indicator provide total trend summary. We can easily analysis and study market movement .

The background trend is an indicator that helps us to know the trend that is dragging the market. The indicator has 2 possibilities: 1) If the indicator is above zero the trend is buying and the indicator will be green.
2) If the indicator is below zero, the trend is selling and the indicator will be red.
You can download the demo and test it yourself.
The indicator has a text help in the upper right corner, in which it shows whether the indicator has a bullish or bearish background trend

Megalith is an Expert Avisor that contains within it different types of trading, its particular formulas, dynamically detect supports and resistances, inserting pending orders or multiple pending orders in these specific points. This flexibility allows Megalith to be able to carry out level trading with price action, trend and scalping trades, with megalithic stability and solidity
The dynamic entry of pending orders on S and R makes Megalith extremely safe, due to the fact that positions

EA based on Trend and Support Resistance Levels option usage of Auto SL and AutoLot with variable risks results given on EURUSD H1 for last 2.5 years *** used parameters on H1 timeframe bars 25 shift 5 ma index 0.85 open OrdersTotal = 2 Profit Per = 3 % profit to Equity to close trades for lower time frames Inputs will me doubled or tripled ... for higher time frames inputs should me divided / minimized you can use manual entered Lot and Disable AUTOLOT Or you can enable Auto-Lot and

Exciting Black Friday Deals have been activated for this Tools Shop Now: Old price was 170$ and now 85$
Brief Many traders don't trust robots... they Just use technical analysis and make manual orders. So what happens if this technical analysis for make the best decision, working AUTOMATIC! Yes. We do that.
What is it? the Trend Scalp pro Trend Scalp Pro is achieved from 10 years of experience and research on thousands of strategies, By combining them to make Real Smar

The 4 headed dragon is an indicator that has two functions. 1) Set the background trend. 2) Mark the predominant trend. By combining these two indicator signals, we will be able to trade for or against the trend, adapting the signals to your reading of the market.
You can download the demo and test it yourself.
1) Set the background trend.
Define four possibilities of trend that are the four heads of the dragon, marked by colors on the indicator, marking a) Powerful buying trend. b)

DNA is an indicator that allows us to operate both in favor of a trend and a pullback. You can download the demo and test it yourself.
Trend trading is above zero and pullback trading is below zero.
The direction of the operation is marked by the color of the line.
If the line is green it corresponds to purchases.
If the line is red it corresponds to sales.
For example, if the green line is above zero and growing, we will have an uptrend operation. If the red line is above zero and
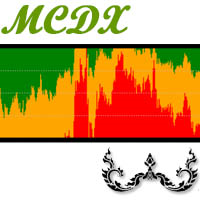
MCDX is an indicator based on specific formula to detect Buy and Sell momentum Red Bar means Price go up and Buy momentum. Green Bar means Price go down and Sell momentum" Height of RED bar > 50% means Bull is in control. i.e. RED more than GREEN to go buy. Lower of Green bar < 50% means Bear is in control. i.e. GREEN more than RED to go sell. DARKER RED COLOR - STRONG Up Trend or Strong Bullish Power
LIGHTER RED COLOR - WEAK Up Trend or Weak Bullish Power
LIGHTER GREEN COLOR - STRONG Down

This indicator will create bars in 4 deference colors. The Green Bar is Up Trend. The Red Bar is Down Trend. Lite Green Bar is No Trend (corrective or sideway) but still in Up Trend. Pink Bar is No Trend (corrective or sideway) but still in Down Trend. You can just looking at the Bar's Color and Trade in Green Bar for Long Position and Red Bar for Short Position. You can change all the colors in your way.
1. Alert function : Will popup Alert Windows and play sound when the Bar was changed. 2.

Limited number of copies will be sold on MQL5 market. Price $69.99 4 of 10 left at this Price Next 10 copies $149.99. Expert will be available on sale untill 1 of January. Unbrekeable for XAUUSD is a fully automated EA designed to trade GOLD only. It is based on machine learning analysis and an incredible trend detection system. This EA tries to win 1% of the account in each of the trades!!!! works like magic :) EA contains self-adaptive market algorithm, which uses XAUUSD in 2015-2020

Genetic Code, is an indicator that differentiates two types of market: the market in range and the market with volatility.
This indicator allows the trader to choose whether to use a range trade or a volatility trade. You can download the demo and test it yourself.
When observing the trace of the indicator it shows us narrow areas that correspond to market ranges.
These ranges always end with a volatility process, so you can work with two conditional pending orders.
When the two DNA str

This is MT4 version of StochScanner It scans Stochastic from Multi Symbols and Multi Timeframes and displayed on the dashboard on a single chart. . 4 scanning modes: 1. Mode OverBought/OverSold Indicator scans Overbought and OverSold . OverBought : current stochastic is above level 80 and OverSold : current stochastic is below level 20 2. Mode Signal It means if the previous stochastic is on OverBought or OverSold ( either Main Line and Signal Line ) and the current Main Line cross over the curr

HAWA GOLD Advanced trading indicator with realistic pre-defined entry and exit levels with almost 80% win rate. The system focuses only Small and Steady Profits . It uses fixed stop loss for every signal to keep money management in place. As compare to other available indicators in market, HAWA gold has unique feature of displaying total profit and loss in terms of points where 1PIP=10points and Minimum profit is 10 pips. Its smart and advanced algorithm detects trend and trend strength usin
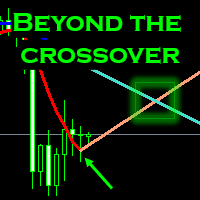
Do you want to anticipate to the crossover movements? Raise your change of success? With this program t he Crossovers can be anticipated before its appearance and thus get a better price. Developed a MA line that anticipated the crossovers and also it can be used for support and resistance level. Check in the backtesting and get the reversal at the beginning. Description MA beyond the crossover is an average price calculation over a certain time period causing a faster reaction b

This is a price action trading robot, the EA will stick to the medium term trend and price to deliver trades. Orders are always protected by the user set stop loss points. With the capital management system, it will help that EA operates in accordance with its purpose. Telegram : https://t.me/trungtqIT
Timeframe is M5,M15. Minimum account balance: $30. Attention is Important: EA only test live on demo or real accounts. Backtest results are just random and inaccurate.
Features: Every trade is
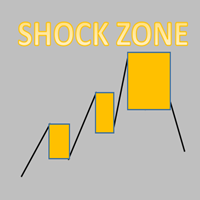
Every trading shock range is a point of gaining momentum!
The stop loss is generally the height of the shock zone.
Take profit depends on personal preference and market position. Generally at least double the height of the shock zone. Being in a good market position, it can have a profit-loss ratio of 5-10
Necessary for traders: tools and indicators Waves automatically calculate indicators, channel trend trading Perfect trend-wave automatic calculation channel calculation , MT4 Perfect
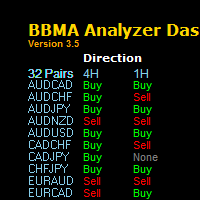
" The one of keys to trading success is a System Technique , MUST HAVE THIS SYSTEM!"
BBMA Analyzer Dashboard
BBMA is a popular technique that uses a combination of 2 indicators in MetaTrader 4 or MT4 which using Bollinger Band and Moving Average Indicator. Summary of BBMA Techniques has the basic elements:
RE-ENTRY
Formed after fall or price increase.
Price will form a Sideway to enable Re-Entry. CSAK (Strong Direction Candle)
The strong direction candle is a close candle directio
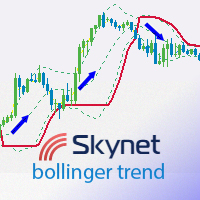
Данный индикатор отображает точки входа в рынок с помощью лент Боллинжера и точки выхода, которые определяются по заданному расстоянию в пунктах от точки входа. Линия индикатора выше цены говорит о медвежьем тренде. Если линия ниже цены, то на рынке присутствует бычий тренд. Информационная панель показывает результаты работы индикатора, чтобы можно было его настроить более точно и видеть, как параметры влияют на результат. Оповещение о точках входа и выхода приходит на телефон. Преимущества Пр
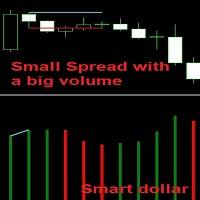
When the current candle is smaller than the previous candle but its volume is greater than the previous one, it means that the market maker is blocking the trend, means that it is in the process of (buying or selling). So when the price closes above that candle, we buy and if it closes below that candle we sell as well. Note that this candle becomes a strong zone as resistance or support. The indicator draws two lines on the divergence spread volume candle, you have to wait for the price to clo
Trend PRO and Breakout EDGE Expert Advisor is developed using the PipFinite Trend PRO and Breakout EDGE Indicators, the best indicators on the market so far. PipFinite Trend Pro's smart algorithm detects the trend, filters out market noise and gives entry signals with exit levels. Whereas PipFinite Breakout EDGE follow a step-by-step system that detects the most powerful breakouts, discover market patterns that generate massive rewards based on a proven and tested strategy. This EA open order

Following trend indicator coached by Alina. This product made based by RSI and Oscillator. Another indicator to support this strategy will send to you free by whatsapp. Been tested this for over 3 years, over 60% winning rate. Support Eur Usd, Eur JPY , Nzd Usd, Xau Usd. Aud Jpy , Aud Usd , Eur Cad , Usd Cad , Usd Chf , Gbp Usd, Aud Cad , Aud Nzd. quality signals and can be used for everyday .

Тренд на форексе всегда был другом трейдеров, а индикаторы тренда помогают определить тренд и принимать правильные решения. Большинство торговых систем, разработанных гуру трейдинга, основываются именно на тренде. Лучше всего использовать на таймфреймах выше М30, с начала Лондонской сессии и до Америки. Следует помнить, что не существует индикаторов, которые не ошибаются. Любая стратегия требует подтверждения своих сигналов. При построении своей собственной системы, рекомендуется использовать не

Bomber is a fully automated Algorithmic Expert Advisor with multi-Strategies based on our IA optimization on different traditional strategies such as moving average , Ichimoku ,ADX, ... ,You are able to choose any one of the strategies or using all of them same as default setting together. live signal: https://www.mql5.com/en/signals/940345 Telegram group: h ttps://t.me/BomberExpert :::::::::::::::Requirement & Recommendations::::::::::::::: Please send us private message for better support.

LordTrendSignal is a financial market indicator for Meta Trader that checks signals through trends and candles, works on all TimeFrames (M1, M5, M15, M30, H1, H4, D1).
LordTrendSignal checks the signal through trends and candles and informs you via notification, alerts via email and push on the automatic screen.
The trend flexibility of LordTrendSignal is high, however, together with other of our indicators LordAutoFibonacci and LordAutoTrendLine you will be able to work very well to obtain

Индикатор показывает смену тренда и как меняется рынок. При вычислении идет взвешивание многих параметров. Поэтому возможна дивергенция между графиком и индикатором. Входные параметры: IndicatorPeriod: несколько периодов рассчета (small - краткосрочный период, medium - среднесрочный, long - долгосрочный). Торговать можно по дивергенции, анализировать на линии сопротивления и поддержки (и другие виды графического анализа), в составе других индикаторов. Tags: Stochastic, Trend.

Brief description
TrendWatch indicator analyze chart trend strength and acceleration. Analysis is based on close price SMA with configurable period. Result is given as set of two curves in the indicator window. Blue (default color) curve identify trend direction and strength. Yellow curve (default color) identify trend tendency to accelerate/deceleare. Scale of curves is normed to maximal value in given time period. Both curves can be additionally smoothed using configurable SMA and/or set to
Use our recommended broker: https://icmarkets.com/?camp=61478 What is neural breakout ea? Neural breakout ea is an advanced fractals breakout strategy with the neural network to predict market moves with high accuracy, combined with a smart averaging system. Neural breakout EA is tested on all released pairs for more then 10+ years including COVID-19 period and has been stable at all times. This is a proven strategy to provide long term account growth with minimal account risk involved. Main f

Индикатор Trend Slow использует авторский алгоритм анализа поведения цены и отображает результат сложной работы в виде линий. Для простоты алгоритм автоматически меняет цвет линии согласно своему направлению.
В индикаторе присутствует параметр для включения подачи алертов при изменении цвета, таким образом помогая трейдеру определять новые тренды рынка.
Эта система поможет найти высоковероятностные сделки в направлении сильных трендов.

1. Automated trading system 2. Follow the trend / Breakout / Price Action 3. It can be add more positions to the trend(Pyramiding)
Parameters:
EA1: Entry Strategic Settings Stop New Open Orders: false/true Strategic_ABC: TrendFollow/BreakOut/PriceAction Trade Direction: Buy_Only Sell_Only Buy_Sell Pyramid Hedge(Long+Short): true/false(add positions to both direction) Hidden SL/TP Line: It can be hidden SL/TP line
EA2: Risk Management Se
Hidden Breakout Power The market has a cycle, keeps on moving from: RANGE -> BREAKOUT -> TREND ->CONSOLIDATION ->RANGE RANGE and TREND The two major states, while the BREAKOUT refer to the short period of market breaking the range, CONSOLIDATION refer to the long consolidation of market and shrink to range. Usually oscillatory indicator performs well in RANGE states and perform poorly in trend state, while TREND indicator is the other way around, it performs will in a TREND states and but poor
MetaTrader Маркет - лучшее место для продажи торговых роботов и технических индикаторов.
Вам необходимо только написать востребованную программу для платформы MetaTrader, красиво оформить и добавить хорошее описание. Мы поможем вам опубликовать продукт в сервисе Маркет, где его могут купить миллионы пользователей MetaTrader. Так что занимайтесь только непосредственно своим делом - пишите программы для автотрейдинга.
Вы упускаете торговые возможности:
- Бесплатные приложения для трейдинга
- 8 000+ сигналов для копирования
- Экономические новости для анализа финансовых рынков
Регистрация
Вход
Если у вас нет учетной записи, зарегистрируйтесь
Для авторизации и пользования сайтом MQL5.com необходимо разрешить использование файлов Сookie.
Пожалуйста, включите в вашем браузере данную настройку, иначе вы не сможете авторизоваться.