Смотри обучающее видео по маркету на YouTube
Как купить торгового робота или индикатор
Запусти робота на
виртуальном хостинге
виртуальном хостинге
Протестируй индикатор/робота перед покупкой
Хочешь зарабатывать в Маркете?
Как подать продукт, чтобы его покупали
Платные технические индикаторы для MetaTrader 4 - 95
Индикатор для бинарных опционов без перерисовки представляет собой мощный инструмент для трейдеров. Он гарантирует надежность сигналов, не меняя их после их появления. Особенности: Неперерисовка сигналов: Индикатор обеспечивает стабильные и достоверные сигналы, которые не изменяются после формирования. Время экспирации: Сигналы появляются на открытии свечи и имеют экспирацию в течение одной свечи текущего таймфрейма. Метод перекрытия: В случае убыточной сделки рекомендуется использовать метод пе

Perfect Cross Arrows indicator is designed for signal trading. This indicator generates trend signals.
It uses many algorithms and indicators to generate this signal. It tries to generate a signal from the points with the highest trend potential.
This indicator is a complete trading product. This indicator does not need any additional indicators.
The indicator certainly does not repaint. The point at which the signal is given does not change. Signals are sent at the beginning of new can
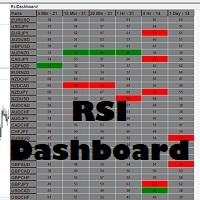
Never miss when a pair is being oversold or overbought again!! This RSI dashboard allows you to monitor RSI levels on 6 different time frames for up to 30 different currency pairs. This dashboard is packed with features including: 1. Monitoring of 6 customizable time frames (M1, M5, M15, M30, H1, H4, D1, W1, M1) 2. You can set the overbought/oversold levels you want for EACH time frame and they will be highlighted in the dashboard when a pair gets to that level
3. You can also set the RSI perio

Этот индикатор предназначен для определения времени наибольшей торговой активности внутри дня. После этого вычисления индикатор строит наиболее значимые торговые уровни. Сравнение этих уровней с реальным движением цены может дать информацию о силе и направлении рыночных тенденций.
Особенности работы индикатора Таймфрем должен быть ниже D1. Рекомендуемые таймфреймы: M15, M30 и H1. Таймфреймы выше H1 могут дать слишком грубую картину. А использование таймфремов ниже M15 может привести к появлен

1. Strictly speaking, it is not an indicator because it is a real-time position of the main force. It is only displayed through indicators, as it is real-time. 2. There is no drift or future in the indicator. The indicator has a profit of over 300 W in three months, with a winning rate of 99%. The auxiliary arrow indicator was written by me with an old foreigner and spent $5000, which is free for everyone to test.
3. The indicator is applicable to the virtual currency index of gold, crude oil
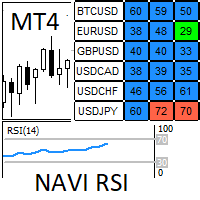
Нави RSI: Ищите сигнал относительной силы индекса в зонах перекупленности или перепроданности на каждом символе и соответствующем временном промежутке. Мы очень удобно плаваем по графикам и экономим много времени. Визуальные сигналы и уведомления появляются, когда RSI находится в зонах перекупленности и перепроданности. Визуальные сигналы и уведомления независимы как для символов, так и для временных промежутков, что очень удобно для управления уведомлениями на мобильном телефоне, когда мы отсу
What is the RVOL Indicator?
It is well established that volume (including tick volume) is a valuable indicator of trader commitment to a price movement. The challenge with using volume for intraday trading is that there is a general cycle of increasing and decreasing volume associated with the different regional trading sessions. The Relative Volume, or RVOL, indicator helps to overcome this by comparing the current volume with the average volume for that time of day, calculated over a period

Use my recommended broker: https://icmarkets.com/?camp=61478 You have most likely heard about the term "Less is more". I can tell you one thing that's also the case with the Monkey RSI on Bollinger indicator! One indicator will give you the best of both worlds, easy to determine trend, the strength of the trend and overbought and oversold levels. This indicator is very simple to follow: Green line uptrend Red line downtrend Above band overbought Below band oversold With this indicator you cou

Introducing Daily Hedge - Your Advanced Custom Hedge System for Forex Trading Unleash the Power of Daily Hedge - Your Ultimate Trading Companion Experience the next level of trading sophistication with Daily Hedge, an advanced custom hedge system designed to revolutionize your Forex trading experience. With its cutting-edge features and intelligent algorithms, Daily Hedge empowers you to make informed decisions and seize profitable opportunities like never before. Unlocking Advanced Trading Str

Great Strong System indicator is designed for signal trading. This indicator generates trend signals.
It uses many algorithms and indicators to generate this signal. It tries to generate a signal from the points with the highest trend potential.
This indicator is a complete trading product. This indicator does not need any additional indicators.
The indicator certainly does not repaint. The point at which the signal is given does not change.
Features and Suggestions Time Frame:

This Indicator is use the ZigZag to calculate the Upper and Lower Bound and the uptrend and the downtrned. Red for downtrend, Green for uptrend and Yellow is for the horizontal trend this horizontal trend also bookmarked the upper limited and the lower limited the the price swings. Or in simple the Support and the Resistance level. However, You may use the Heikin Ashi to confirm the trend of the buy sell signal above. I cannot guarantee the win rate, Nevertheless, you must study well the timef
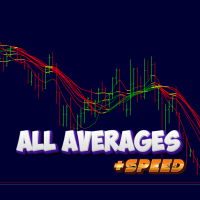
Возможно вы ранее читали в книгах по техническому анализу о таком понятии как "наклон рынка", или "наклон тренда". В метатрейдере есть такой инструмент как "трендовая по углу". Но при работе на автомасштабируемых графиках этот инструмент становится полностью абстрактным, и как следствие бесполезным. Идея этого нового параметра, включенного в индикатор AllAverages_Speed, заключается в придании такому понятию как "наклон тренда" конкретных числовых значений, а также дальнейшее использование нового

Как торговать с помощью этого индикатора: когда рисует красную стрелку - открываем сделки на продажу. когда рисует синюю стрелку - открываем сделки на покупку. Master Trend Pro - предсказывает будущее направление цены, с помощью регрессионного сглаживания стандартного мувинга. Индикатор стрелкой показывает куда будет двигаться с высокой вероятностью цена. Этот индикатор подходит для торговли по стратегии скальпинга на таймфреймах M1 и M5. Если индикатор рисовал синюю стрелку, а потом начал рисо
This is a simple arrow system based on MACD indicators Main/Base line and MACD Levels. It gives you alerts when MACD's Main Line crosses above/below certain level. Which type of alerts available? 1. It paints on chart Up/Down Arrows. 2. Popup message and sound alert in trading terminal window. 3. Push notification or Alert on your android and ios mobile phones (requires MT4 or MT5 app installed!)

This is a simple arrow system based on Engulfing Candlestick Pattern. It gives you alerts on your smartphone when there is an engulfing candlestick pattern happens. Which type of alerts available? 1. It paints on chart Up/Down Arrows. 2. Popup message and sound alert in trading terminal window. 3. Push notification or Alert on your Android and IOS mobile phones (requires MT4 or MT5 app installed!) *Note: Use it on higher timeframes like H4 (4 hours), D1 (1 Day) then find trade opportunities on s
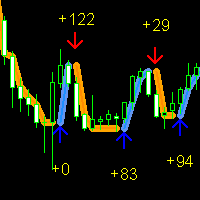
Forex Gump Signal - новый индикатор из серии ForexGump. Этот индикатор, в отличии от других, определяет точки разворота цены с помощью математического вычисления скорости стандартного мувинга. Когда скорость мувинга замедляется, индикатор интерпретирует это как сигнал на разворот тренда. Это позволяет индикатору улавливать даже самые незначительные точки разворота цены. Для того, чтобы индикатор начал анализировать более крупные точки разворота, необходимо уменьшить параметр "first_slowdown" и у
This is a MACD indicator which displays an up-arrow/down-arrow on the main chart window when MACD line cross zero and signal line. 1) The arrows on the main chart are very useful to traders because it will draw trader's attention to change of trend or momentum instantly. 2) It is definitely easier and faster than looking at the sub-window at the bottom of the screen. It is an important tool for MACD strategy. 3) User can opt for displaying the MACD cross Signal arrows which are in line with the
Amazing Pro Signal indicator is designed for signal trading. This indicator generates trend signals.
It uses many algorithms and indicators to generate this signal. It tries to generate a signal from the points with the highest trend potential.
This indicator is a complete trading product. This indicator does not need any additional indicators.
The indicator certainly does not repaint. The point at which the signal is given does not change.
Features and Suggestions Time Frame: H

Netsrac "Supply and Demand Easy" is a small but highly specialized tool for quickly finding supply & demand zones without frills. It shows the next supply and demand zone in the current timeframe. Highly efficient and fast. Works perfectly with the Netsrac "Supply and Demand Dashboard" (https://www.mql5.com/en/market/product/96511 ) Controls
Variable Description (SD01) Supply color Set your color for supply zones (default is LightCoral) (SD02) Demand color Set your color for demand zones (defa
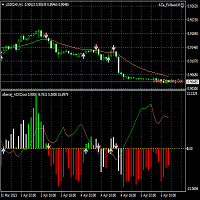
Indicador basado en ADX que permite apreciar fácilmente las señales de entrada y salida (cruces de D+ y D-) y si se producen en tendencia o sin ella. Además informa del spread actual y del tiempo de barra restante, en la ventana principal del gráfico Los inputs, time-frames, etc y la configuración es sencilla para el usuario. Muy útil por su aspecto y colorido, diferente al habitual de este indicador.

This is a very useful Oscillator based on ADX Crosses plus Double Keltner Channels Crosses too (evolution from my own indicators/oscillator ACE ADXCrosses and ACE ADXCrossOnChart). Features Colored histogram shows D+/D- crosses on trend (green up/salmon down or without trend (white) based on ADX main (over ADXon level -ie. 24-). Signals (arrows) shows high probability orders (long/short) based on D+/D- crosses. Color line (green/salmon) shows ADX main less ADXon level (ie: ADX main - 24) for tr
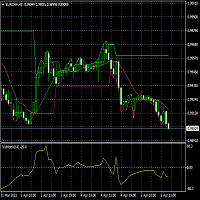
Background : Indicator On Chart based on my own oscillator ACe_Vector2016. As you can appreciate, this indicator draws two bands on the chart in order to identify long and short opportunities. When the momentum vector oscillator (ACe_Vector2016) crosses the zero line, the indicator On Chart draws a long/short signal (green/red arrow). Also you can identify the trend line on chart (MA): green colour if trend is moving up, and red colour if trend is moving down. This indicator draw up and down non

Real Strong Entry indicator is designed for signal trading. This indicator generates trend signals.
It uses many algorithms and indicators to generate this signal. It tries to generate a signal from the points with the highest trend potential.
This indicator is a complete trading product. This indicator does not need any additional indicators.
The indicator certainly does not repaint. The point at which the signal is given does not change.
Features and Suggestions Time Frame: H1

一款非常优秀的对冲策略,根据指标提示的多空顺势开单,指标不延迟,不漂移,不重画,可以单笔对冲,也可以使用马丁对冲,马丁对冲回报会更高 一款非常优秀的对冲策略,根据指标提示的多空顺势开单,指标不延迟,不漂移,不重画,可以单笔对冲,也可以使用马丁对冲,马丁对冲回报会更高 一款非常优秀的对冲策略,根据指标提示的多空顺势开单,指标不延迟,不漂移,不重画,可以单笔对冲,也可以使用马丁对冲,马丁对冲回报会更高 一款非常优秀的对冲策略,根据指标提示的多空顺势开单,指标不延迟,不漂移,不重画,可以单笔对冲,也可以使用马丁对冲,马丁对冲回报会更高 一款非常优秀的对冲策略,根据指标提示的多空顺势开单,指标不延迟,不漂移,不重画,可以单笔对冲,也可以使用马丁对冲,马丁对冲回报会更高
Единственный в своем роде индикатор квадрата 9, который соответствует реальному положению на Ганнзиле! Индикатор расcчитывает уровни цены по квадрату 9 и даты по квадрату 9. Все уровни цен и времени 100% соответствуют местоположению на квадрате 9 (Ганнзила). Данный инструмент будет отличным решением для определение уровней цены и времени используя методы легендарного трейдера Вильяма Делберта Ганна.

Индикатор ICT Implied Fair Value Gap (IFVG) является важной составляющей частью системы Smart Money Concepts (SMC). Он ищет и показывает на графике современный паттерн - Разрыв справедливой стоимости ( FVG ). Этот паттерн представляет собой формирование дисбаланса трех свечей, которое основано на обнаружении несоответствия между спросом и предложением. Так получается, когда цена быстро движется в одном направлении, не встречая сопротивления. В результате образуется разрыв, "гэп", который может б

This indicator is based the principle of breakout candle. Every candle that breaks out from the cluster may not lead to a rally. There are various factors that determine how a breakout candle will behave. This indicator calculates all those factors to suggest BUY/SELL signal once a breakout happens. This is a universal indicator that can work for all kind of instruments eg stock, currency, oil, crypto etc. This also works in every timeframe. PARAMETERS ================= move = 20 strongCandle =
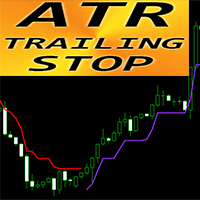
Forex Indicator " ATR Trailing Stop" for MT4 Upgrade your trading methods with great auxiliary ATR Trailing Stop indicator for MT4. This indicator is perfect for Trailing Stop purpose ATR Trailing Stop is automatically adaptive to market volatility No delays and easy set up This indicator is excellent to combine with price action entries into the direction of main trend // More great Expert Advisors and Indicators are available here: https://www.mql5.com/en/users/def1380/seller //
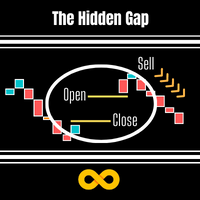
This Indicator is based on the Indice gaps between todays open price and yesturdays closing price. On Metatrader these are not shown as we only see a 24hr chart. If we want to know the gap between the open at 16:30 and yesturdays close at 23:30 on the SP500 this EA will reveal the gap. On Indices these types of Gap close approximately 60% of the time within the same day and is demonstrated on the panel which records previous gap closures and provides to the user a statistical proof of gaps clos
Индикатор Volume com является индикатором в котором организован режим контроля за движения цены с помощью тиковых объемов . Индикатор Volume com выдает сигналы которые возможно отфильтровать и получить хороший результат. Главная достоинство сигналов этого индикатора в том что они появляются как в конце тренда так и по его ходу. Индикатор работает на всех таймах.

Индикатор Volume Str это индикатор построенный на тиковых объемах. Само название индикатора " Объемная улица " указывает на использование и сортировку объемов согласно определенному алгоритму что приводит к хорошему результату на выходе. Посмотрите скриншоты и вы убедитесь какие сигналы он выдает. Индикатор не перерисовывается и использовать его сигналы можно уже по закрытию первого бара.
The Symphonie Sentiment Indicator is a technical analysis tool used in MetaTrader 4 (MT4) trading platform that helps traders identify market sentiment based on a combination of different indicators. The indicator is designed to provide a comprehensive view of the market by analyzing multiple timeframes and displaying the results in an easy-to-read format. It combines a variety of technical indicators, such as moving averages, oscillators, and trendlines, to generate trading signals that can hel
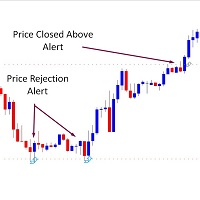
*** Introductory Offer! *** Ends soon - do not miss it! The Price Alerts 3 in 1 Indicator is part of my suite of Price and Trendline Alerts Indicators. I'm excited to introduce the Price Alerts 3 in 1 Indicator – part of my new suite of Price and Trendline Alert Indicators – fantastic tools designed to: … alerts you when 1. candles close above or below significant prices 2. price breaks above or below significant prices 3. price rejects significant prices in the markets you trade. With t
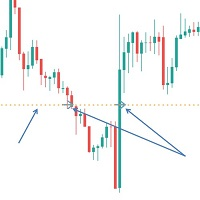
*** Introductory Offer! *** Ends soon - do not miss it! The Price Break Alerts Indicator is part of my suite of Price and Trendline Alerts Indicators .
I'm excited to introduce the Price Break Alerts Indicator – part of my new suite of Price and Trendline Alert Indicators – fantastic tools designed to alert you of any significant prices in the markets you trade. With this indicator, you can set up to 4 price alerts on any asset, allowing you to quickly spot any significant price breakouts,

Индикатор Volume mag это очередной индикатор который использует для расчета точек входа тиковый объем. Индикатор подает сигнал редко, но это можно сказать его преимущество. Сигналы индикатора не перерисовываются и не запаздывают и выдаются после закрытия текущей свечи. Индикатор не перегружает терминал и ведет расчет точек входа на протяжении величины BarsCount, которая задается в меню , по умолчанию 500 баров.
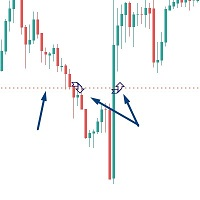
*** Introductory Offer! *** Ends soon - do not miss it! The Close Above or Below Price Indicator is part of my suite of Price and Trendline Alerts Indicators. I'm excited to introduce the Close Above or Below Price Indicator – part of my new suite of Price and Trendline Alert Indicators – fantastic tools designed to alert you when candles close above or below significant prices in the markets you trade. With this indicator, you can set up to 4 price alerts on any asset, allowing you to quic
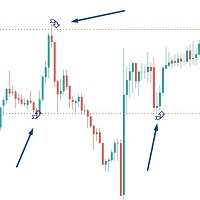
*** Introductory Offer! *** Ends soon - do not miss it! The Price Rejection Alerts Indicator is part of my suite of Price and Trendline Alerts Indicators. I'm excited to introduce the Price Rejection Alerts Indicator – part of my new suite of Price and Trendline Alert Indicators – fantastic tools designed to alert you when candles close above or below significant prices in the markets you trade. With this indicator, you can set up to 4 price alerts on any asset, allowing you to quickly spo

The Supertrend Indicator is a powerful tool for traders that provides alert, notification, and email features. With its customizable color scheme, you can easily personalize the look and feel of the indicator to fit your trading style. This indicator is designed to help traders identify trend changes and potential entry and exit points in the market. Whether you're a seasoned professional or just starting out, the Supertrend Indicator is a valuable addition to your trading toolkit. It will be av
Индикатор Volume New это основной индикатор для расчета направления движения цены по тиковых объемах. Индикатор выдает максимальное число сигналов, которые возможно фильтровать согласно своих стратегий. Индикатор не перерисовывается и не запаздывает и выдает сигнал согласно установок величины SIGNALBAR, по умолчанию 1 - после закрытия текущей свечи. Количество баров истории для расчета задается в меню индикатора величиной BarsCount, по умолчанию 500 баров.
Индикатор MT4 Выйдите впереди кривой с индикатором Wamek Trend Consult. Разработанный для определения начальных и продолжительных трендов, этот мощный инструмент дает трейдерам возможность входить на рынок в точно подходящий момент, используя мощные фильтры, чтобы уменьшить количество ложных сигналов и повысить точность ваших сделок. Путем точного анализа рыночных тенденций и фильтрации ложных сигналов с использованием своих продвинутых алгоритмов и непревзойденной точности индикатор Trend Consu

MT4 Candlestick Pattern Alert Indicator: Stay Ahead of Trading Opportunities Overview The MT4 Candlestick Pattern Alert Indicator is a robust tool designed to empower traders by detecting candlestick patterns and delivering timely alerts through notifications, emails, and pop-up alerts. This invaluable tool saves traders precious time, allowing focused analysis on patterns and potential profitable trades. Importance of Candlestick Patterns Candlestick patterns are pivotal in technical analysis,
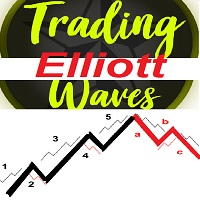
A simple Approach to Elliot waves patterns Signal generated on trend continuation when breaking the "5" level or on corrective direction after 1-5 waves detected 1-5 labeled points arrows used for signal UP/DOWN direction Chaotic patterns in Blue are drawn all times until a 1-5 Elliot wave pattern detected 1-5 Red pattern in Bull Market : UP arrow in BULL trend continuation OR DOWN arrow as a reversal DOWN direction as pattern correction 1-5 Green pattern in Bear Market :DOWN arrow in BEAR tr
This is a modern MACD indicator based on regular MACD indicator. It also has alert system included. This indicator gives you alerts when base line of MACD indicator crosses above or below Zero level so you can look for Buy or Sell opportunity. Available Alerts: 1. Audible Alerts on Chart / Trading Terminal window. 2. Alerts on your email. 3. Alerts on your mobile phone. Type of Alerts Explained: 1. Audible_Chart_Alerts - Audible alerts and Popup message on your compu

An indicator based on support and resistance levels with many signals (per candle) Can be used in all time frames Can be used in all symbol Blue lines: upward trend. Red lines: downward trend
How It work: This indicator gives signals based on support and resistance levels as well as some complex calculations. Based on past data
As you know, one of the most important trade options are support and resistance levels.
Get good signals using this indicator.
How To work: Run the indicator.
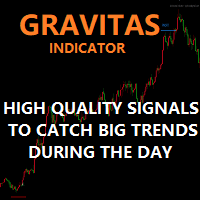
Gravitas indicator – High quality / Non-repainting Signals for day trading
If you are sick and tired of not being profitable each month or you simply want a safe earning while you are studying the markets or while you practice and master your strategy give this indicator a try. I called this indicator “Gravitas” as indication of seriousness and importance that trading is for me and respect for the market and the other traders involved in it. I developed it last
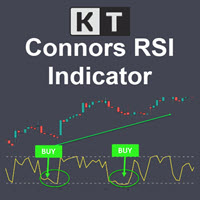
KT Connors RSI is a modified and more advanced version of the original Connors RSI developed by Larry Connors. It was designed to help traders generate trade signals based on short-term price movements.
The Connors combine the standard RSI calculation with two additional elements: a short-term RSI, ROC, and a moving average.
Features Provides more transparent and more actionable buy and sell signals using the overbought/oversold zones. Incorporates short-term RSI and moving average, provid

You can change the time period of the chart at the touch of a button. You can also change multiple charts at the touch of a button. You can also change multiple charts at the touch of a button, saving you the trouble of changing time periods.
We are live-streaming the actual operation of the system. https://www.youtube.com/@ganesha_forex
We do not guarantee your investment results. Investments should be made at your own risk. We sharll not be liable for any disadvantage or damage caused by
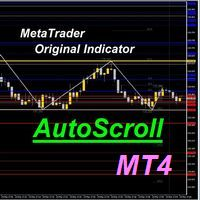
AutoScroll automatically scrolls the chart by the set width (pips). You can see the next milestone without having to operate the chart yourself. You can concentrate on trading.
We are live-streaming the actual operation of the system. Please check for yourself if it is usable. Please check it out for yourself. https://www.youtube.com/@ganesha_forex
We do not guarantee your investment results. Investments should be made at your own risk. We sharll not be liable for any disadvantage or damage
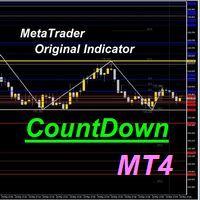
The time until the end of the bar is counted down. Therefore, you can time your order while watching the chart. You can concentrate on your trading.
We are live-streaming the actual operation of the system. Please check for yourself if it is usable. Please check it out for yourself. https://www.youtube.com/@ganesha_forex
We do not guarantee your investment results. Investments should be made at your own risk. We sharll not be liable for any disadvantage or damage caused by the use of the in

Fibonacci automatically draws Fibonacci retracement, Because Fibonacci automatically draws Fibonacci retracement, you can know at a glance the price to buy at a push or sell back. Therefore, you can trade in favorable conditions in a trending market.
We are live-streaming the actual operation of the system. Please check for yourself if it is usable. Please check it out for yourself. https://www.youtube.com/@ganesha_forex
We do not guarantee your investment results. Investments should be mad

The chart pattern is automatically drawn. It also automatically tells you the price at which you are most likely to buy or sell according to the pattern. Therefore, there is no need to memorize patterns or draw lines by yourself.
We are live-streaming the actual operation of the system. Please check for yourself if it is usable. Please check it out for yourself. https://www.youtube.com/@ganesha_forex
We do not guarantee your investment results. Investments should be made at your own risk. W

The system automatically draws resistance and support lines, The system automatically draws resistance and support lines, so you can see at a glance the price range where you are most likely to encounter resistance. Therefore, you can trade in price zones where you are less likely to encounter resistance.
We are live-streaming the actual operation of the system. Please check for yourself if it is usable. Please check it out for yourself. https://www.youtube.com/@ganesha_forex
We do not guar

Based on the Dow Theory, the system automatically draws a turning point, which is the starting point for buying or selling. It also automatically tells you whether the market is in a buying or selling condition and recognizes the environment. It is also a good tool to prevent false trades and to make profitable trades.
We are live-streaming the actual operation of the system. Please check for yourself if it is usable. Please check it out for yourself. https://www.youtube.com/@ganesha_forex

Check My Product Contact me to discover all my services
Supply and demand zones are one of the most basic things a beginner forex trader learns. These zones are so important, price reacts off of them even after years since they first developed. And with the supply and demand zones indicator, a forex trader might not need to worry about drawing all these historical zones one after the other.
The supply and demand zone indicator accurately draws the supply and demand zones of a currency pair

Fractal Advanced - отображает индикаторы Fractal и Alligator на графике цены. Обладает широкими возможностями настроек и кастомизации. Также оснащён алертами и системой горячих клавиш.
Инструкция/Мануал ( Обязательно читайте перед приобретением ) | Версия для МТ5
Преимущества
1. Индикатор не забивает весь график фракталами, а позволяет отображать только актуальные сигналы.
2. Регулировка количества фракталов осуществляется при помощи скролла мыши с зажатой клавишей Shift.
3. Мгновенное ото

Fibonacci Currency Strength Meter (FCSM) Early Access Sale!!
This new product is still in the process of adding new features and settings. For early bird buyers. The Price will be 50% Sale. In a few weeks, the product will be done. Go Grab your copy while it's still cheap. More details will be added soon. Things to be added. Alert Levels Mobile and Email Alert
From it's name, Fibonacci Currency Strength Meter is a combination of Fibonacci levels and Currency Strength Meter. The plot of Fib

If you are using naked eyes to find candlestick patterns on your chart it's a good thing but it requires your time and attention and still you miss some patterns here and there. Don't worry! This indicator will help you to find "Harami Candlestick Pattern" on your chart very easily. *Note: Default inputs are set for EURUSD H1 (1 hour) timeframe. This is an alert system which gives you alerts whenever harami candlestick pattern happens. Types of alerts it can give you are: 1. Audible Alerts -
What you get upon purchase:
-Lifetime support for the use of the system - Easy to use, clean user friendly interface with no single settings required - Arrow Signals showing where to buy and sell -Visual Arrows, Sound Alert, Email and sms alert functionalities - Customizable colors and sizes -Lifetime Updates - Both Trend and breakout signals -Appropriate signals for both Entry levels, Take profit levels and stop loss Preferred timeframe is 15 MINUTES ACCURATE SIGNALS WITH SIMPLE AND USER

GPT Candlestick T he Indicator show algorithm of Candlestick Automatically. GPT Candlestick is a MetaTrader 4 Indicator that uses a proprietary algorithm based on Price of Moving Average and Average True Range to show the Color of Candlestick on your trading. Means candlestick is going Up or Down (View Simply). I nstead, it analyzes data of market and identify entry points and opportunities. I t's also a trading tool that be used to practice and enhance your manual trading skills. GPT Candlestic

[ MT5 Version ] [ Order Blocks ] [ Kill Zones ] [ SMT Divergences ] ICT Breakers Multi TF
The ICT Breakers Multi TF indicator is currently the most accurate and customizable indicator in the market. It has been designed to give you a strategic edge for trades based on Breaker Blocks and Smart MT. Please note that the UI in the strategy tester may be laggy. However, we assure you that this is only a testing environment issue and that the indicator works perfectly in the real product. The ICT

With PA analyzer you will see a different perspective of price action , once you have unlocked the full potential of it, this tool will be essential part of your trading system. PA Analyzer enables market price analysis and automatically marks support and resistance in all time frames. This indicator makes it easy to see whether the price is in range or trend, and generates dynamic profit take targets for the current time frame and the next higher time frame. This allows you to find target co

Forex 3D - готовая торговая система для скальпинга на любой валютной паре. Рекомендуемый таймфрейм M5. Среднее количество, которое можно найти каждый день от 5 до 15. Эта торговая система подходит для торговли на всех валютных парах, включая золото и серебро. Forex 3D - это очень простая торговая система, которая подходит для новичков в форекс. Она не требует дополнительного анализа рынка с помощью других торговых инструментов. Мы тщательно изучаем технический анализ данного индикатора и рассмат
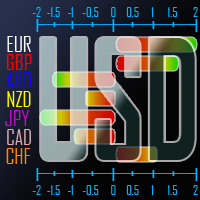
Versus USD рассчитывает изменение цены каждой основной валюты по отношению к доллару США и отображает ясное и сравнительное представление их производительности для каждого периода или бара, индексируемого курсором в текущем временном интервале диаграммы с полосами прогресса. Кроме того, он помечает стрелкой бар/период, где данная валюта испытала наибольшее или наименьшее изменение курса по сравнению с другими валютами, тем самым обеспечивая более точную оценку производительности валюты. Доллар С

"Настроения трейдеров" на финансовых рынках это тема, которая нас давно интересует. Со временем мы не смогли найти правильную формулу для определения этих настроения. Мы прошли много этапов в поисках нужной методологии - от взятия данных из внешних источников для расчета открытых позиций покупателей и продавцов до расчета тиковых объемов, но все равно нас не удовлетворили результаты. Расчет открытых позиций покупателей и продавцов из внешних источников имел несколько проблем - это была выборка з
Скальпинговый форекс индикатор, основанный на стрелочных точках разворота цены, является одним из передовых инструментов для трейдинга на финансовых рынках. Он предоставляет трейдерам возможность быстро реагировать на изменения на рынке и достаточно точно предсказывать дальнейшее направление движения цен. Индикатор основывается на использовании современных алгоритмов и технологий, которые позволяют быстро рассчитывать точки разворота цены на графике. Каждая точка обозначается стрелкой, указываю
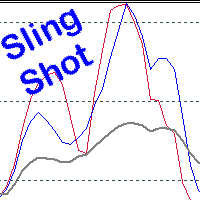
Scalping, Mean reversion or Position trading strategy
Get into an established trend on a pullback in the market. Use the Pinch in the indicator for profit taking. Use the Pinch as a mean reversion strategy, scalping back to a moving average line.
Input Parameters Fast Sling Shot configuration. Slow Sling Shot configuration. Dual Sling Shot configuration. Price line configuration. Trigger zones or levels. Example of Sling Shot trade idea: Price line sets the mood, below the baseline le
Введение BreakOut Consult, революционного инструмента, который поднимет ваше торговое мастерство на новый уровень! Наш современный алгоритм комбинирует несколько трендов и осцилляторов для генерации точных сигналов на покупку и продажу, что делает его мощным инструментом для любого трейдера. С BreakOut Consult вы можете легко выявить прорывы на рынке с помощью нашего динамического канала, который использует уровни сопротивления и поддержки для обнаружения прорывов. Наш алгоритм обнаруживает два
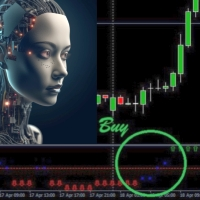
Introducing Trend Fusion 444F, a powerful MQL4 indicator designed to determine market direction using multiple trading indicators. This comprehensive tool offers a unique fusion of technical analysis techniques that help traders make informed decisions in various market conditions. Key Features: Comprehensive Analysis: Trend Fusion 444F combines several widely-used trading indicators to provide a multi-dimensional view of the market. The indicators include Moving Averages, MACD, RSI, DeMarker,

Трендовый индикатор Go Master находит текущий тренд на основе многих факторов. Простой и удобный индикатор. Пользователь может легко увидеть тренды. Он использует базовый подход торговли, широко описанный в торговой литературе.
Это первый индикатор, предназначенный для обнаружения колебаний в направлении тренда и возможных разворотов. Работает при помощи специального алгоритма и набора внутренних индикаторов. Вы можете использовать данный индикатор самостоятельно или в сочетании с другими инд
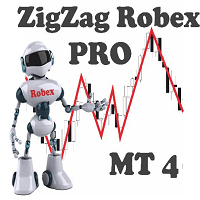
Интеллектуальный индикатор ZigZag. Имеет всего две настройки. Чем выше значения, тем более значимые экстремальные значения показывает. Область применения. Для определения тренда. Направление рисования линии. Для распознавания многочисленных паттернов. Если наложить два индикатора на один график с быстрыми и медленными значениями. Изменив цвет одного из них, то очень хорошо можно разложить движение цены на волны. Индикатор может оказаться отличным помощником для разметки графика и обозначения к
А знаете ли вы, почему MetaTrader Market - лучшее место для продажи торговых стратегий и технических индикаторов? Разработчику у нас не нужно тратить время и силы на рекламу, защиту программ и расчеты с покупателями. Всё это уже сделано.
Вы упускаете торговые возможности:
- Бесплатные приложения для трейдинга
- 8 000+ сигналов для копирования
- Экономические новости для анализа финансовых рынков
Регистрация
Вход
Если у вас нет учетной записи, зарегистрируйтесь
Для авторизации и пользования сайтом MQL5.com необходимо разрешить использование файлов Сookie.
Пожалуйста, включите в вашем браузере данную настройку, иначе вы не сможете авторизоваться.