Смотри обучающее видео по маркету на YouTube
Как купить торгового робота или индикатор
Запусти робота на
виртуальном хостинге
виртуальном хостинге
Протестируй индикатор/робота перед покупкой
Хочешь зарабатывать в Маркете?
Как подать продукт, чтобы его покупали
Технические индикаторы для MetaTrader 4 - 112

DayNight moving averages along with support and resistance make a remarkable difference if properly utilized This indicator detects trade direction and sends notification to your mobile phone so that you can enter/exit a trade without having to be seated in front of desktop computer all day and night. Although you have to execute/send an order yourself, you can setup rules through the setting made available for proper lots size base on the available balance/fund you are trading with. The opport
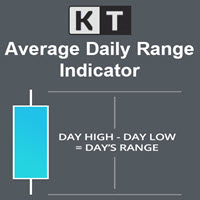
KT Average Daily Range(ADR) shows the upper and lower levels using the average daily range covered by the currency pair or the instrument. The average daily range is calculated using the chosen period in the input settings. ADR High: ADR upper level is found by adding the average daily range value to the current day's low.
ADR Low: ADR lower level is found by subtracting the ADR value from the current day's high.
Features
It shows the ADR levels with several other helpful information benefici
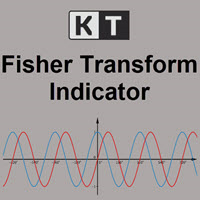
KT Fisher Transform is an advanced version of the original Fisher Transform oscillator equipped with divergence detection, crossover alerts, and many more features. Originally it was developed by John F. Ehlers. It converts the asset's price into a Gaussian normal distribution to find the local extremes in a price wave.
Features
A light-weighted oscillator that efficiently identifies the upward and downward crossovers and marks them using vertical lines. It also finds regular and hidden diverg
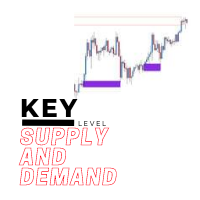
The key level supply and demand indicator is the first supply and demand indicator with options to change settings to show different zones, giving you the choice to pick the zones you see are being respected the most and saving the settings.
Advantages
The key level supply and demand DOES NOT REPAINT unlike other supply and demand currently in the market. This gives you a massive advantage to scroll back and see how price reacted on previous levels. The key level supply and demand has the opt
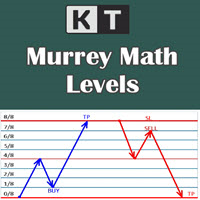
It shows the Murrey Math levels on chart and also provides an alert when price touch a particular level. T. Henning Murrey, in 1995, presented a trading system called Murrey Math Trading System, which is based on the observations made by W.D Gann.
Applications
For Murrey Math lovers, this is a must-have indicator in their arsenal. There is no need to be present on the screen all the time. Whenever the price touches a level, it will send an alert. Spot upcoming reversals in advance by speculatin
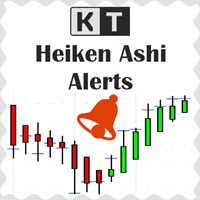
KT Heiken Ashi Alert отображает стрелки покупки и продажи и генерирует оповещения на основе стандартных свечей Heiken Ashi. Это незаменимый инструмент для трейдеров, которые хотят включить Heiken Ashi в свою торговую стратегию. Стрелка на покупку появляется, когда Heiken Ashi меняется с медвежьего на бычье состояние. Стрелка на продажу появляется, когда Heiken Ashi меняется с бычьего на медвежье состояние. Поддерживаются push-уведомления, email, звуковые сигналы и всплывающие окна.
Что такое He
KT Pip Counter — это простой и информативный индикатор, который в режиме реального времени показывает важные цифры и данные. Такое критически важное отображение может серьёзно помочь трейдеру во время напряжённой торговой сессии.
Особенности
Показывает текущую прибыль/убыток в валюте, пунктах и процентах. Отображает актуальный спред. Показывает оставшееся время до закрытия текущего бара. Различные цветовые схемы для сценариев прибыли и убытка. Положение текста и макет полностью настраиваются.

KT Pivot Points автоматически отображает уровни дневного, недельного и месячного пивота на графике с точным расчетом на основе последних данных. Пивотные точки — это широко используемый индикатор в техническом анализе, особенно на рынке Форекс.
Особенности
Отправляет уведомления, когда цена касается уровня пивота. Полностью настраиваемые параметры для каждого типа уровня пивота. Показывает дневные, недельные и месячные уровни пивота без лишних сложностей. Минимальная нагрузка на процессор д
KT Candle Timer shows the remaining time in the closing of the current bar. You can use the bar closing time for multiple purposes, including time and trade management during the trading hours.
Features
It also shows the Symbol spreads along with the remaining time. It offers two convenient timer display positions, i.e., chart corner or next to the current bar. From colors to text size, it offers full customization according to user preferences. It is optimized to work without using extensive c

Об индикаторе Lyne Lyne-это индикатор Metatrader 4 (MT4), суть которого заключается в преобразовании накопленных исторических данных. Индикатор Lyne дает возможность обнаружить различные особенности и паттерны в динамике цены, невидимые невооруженным глазом. Основываясь на этой информации, трейдеры могут предполагать дальнейшее движение цены и соответствующим образом корректировать свою стратегию. Данный индикатор хорошо зарекомендовал себя в стратегии скальпинг. Индикатор работает без перекраск
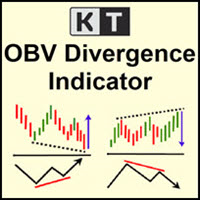
KT OBV Divergence показывает регулярные и скрытые дивергенции, возникающие между ценой и индикатором OBV (On Balance Volume).
Особенности
Несимметричные дивергенции отфильтрованы для повышения точности и снижения визуального шума. Поддерживает стратегии как на разворот тренда, так и на его продолжение. Полностью совместим и готов для встраивания в советник (Expert Advisor). Может использоваться как для входа, так и для выхода из позиции. Доступны все типы оповещений MetaTrader.
Что такое дивер
KT Bullish Bearish shows the bullish/bearish regime of the market in the form of a colored histogram representing both of the market states alternately. Bull Market (Blue Histogram): A bull market indicates an uptrend when an instrument price rises over a continued period like days, months, or years. Bear Market (Red Histogram): A bear market indicates a downtrend when an instrument price rises over a continued period like days, months, or years.
Applications
It prevents trading against the big
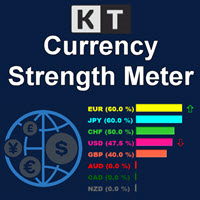
KT Currency Strength Meter измеряет силу и слабость отдельных валют с помощью агрегированной математической формулы, применяемой к основным валютным парам. Сила рассчитывается на основе бычьих и медвежьих свечей за фиксированный период. После заполнения данных об активности валют, алгоритм сортирует самые сильные и слабые валюты и обновляет порядок их расположения в режиме реального времени на основе поступающих данных.
Преимущества
Улучшите свою торговую стратегию, исключив сигналы, которые пр
KT Aroon Oscillator — это модифицированная версия оригинального осциллятора Aroon, изначально разработанного Тушаром Чанде в 1995 году. Он измеряет временной интервал между текущими максимумами и минимумами и использует эти данные для определения направления и силы рыночного тренда. Он основан на предположении, что во время восходящего тренда цена будет последовательно устанавливать новые максимумы, а во время нисходящего тренда — новые минимумы. Сигнал на покупку: когда линия Aroon Up пересека
KT TRSI — это осциллятор, построенный с помощью комбинации RSI (Индекс относительной силы), EMA (Экспоненциальная скользящая средняя) и SMA (Простая скользящая средняя). В отличие от классического RSI, TRSI благодаря сглаживающему эффекту SMA менее подвержен ложным сигналам. У него также есть все виды оповещений MetaTrader.
Простые правила входа
Покупка: когда синяя линия (RSI) пересекает вверх красную линию (TRSI). Продажа: когда синяя линия (RSI) пересекает вниз красную линию (TRSI).
Продвин
Simple indicator that supports decision makers. You will have the candles directions for different timeframes on your screen. That will allowed you to be one more scenario to analyze before you open your orders. In case you would like to have more details, just let me know.. so we can add it to the chart. Multicurrency that in inform you the directions for multi-timeframes!

Levels Pro System рассчитывает канал движения цены, учитывая волатильность инструмента, бары и тренд, - и на основании расчетных данных показывает тренд и чертит уровни поддержки/сопротивления в очень удобном визуальном представлении. В индикатор встроена система определения критических точек (критических баров), которая позволяет трейдеру значительно проще выявлять истинный пробой уровня, ложный пробой, отскок от уровня, возможный сигнал на ранней стадии движения цены итд. Таким образом, торгов
KT Bollinger Bands Alert — это модифицированная версия классического индикатора полос Боллинджера, дополненная ценовыми уведомлениями при касании и видимыми ценовыми метками для каждой полосы отдельно.
События оповещений
Когда текущая цена касается верхней полосы Боллинджера. Когда текущая цена касается средней полосы Боллинджера. Когда текущая цена касается нижней полосы Боллинджера.
Особенности Отдельные события оповещений для каждой полосы. Возможность задать пользовательский интервал между

KT SuperTrend is a modified version of the classic SuperTrend indicator with new useful features. Whether its Equities, Futures, and Forex, the beginners' traders widely use the Supertrend indicator. Buy Signal: When price close above the supertrend line.
Sell Signal: When price close below the supertrend line.
Features
A multi-featured SuperTrend coded from scratch. Equipped with a multi-timeframe scanner. The last signal direction and entry price showed on the chart. All kinds of MetaTrader
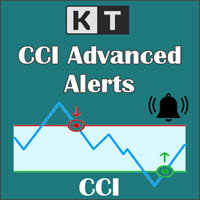
KT CCI Alerts is a personal implementation of the Commodity Channel Index (CCI) oscillator that provide signals and alerts on four custom events: When CCI enter in an overbought zone. When CCI exit from an overbought zone. When CCI enter in an oversold zone. When CCI exit from an oversold zone.
Features A perfect choice for traders who speculate the CCI movements within an overbought/oversold zone. Lightly coded without using extensive memory and resources. It implements all Metatrader alerts.

The Vortex Indicator was first presented by Douglas Siepman and Etienne Botes in January 2010 edition of Technical Analysis of Stocks & Commodities. Despite its based on a complex implosion phenomenon, the vortex is quite simple to interpret. A bullish signal is generated when +VI line cross above the -VI line and vice versa. The indicator is mostly used as a confirmation for trend trading strategies. The Vortex was inspired by the work of Viktor Schauberger, who studied the flow of water in tur
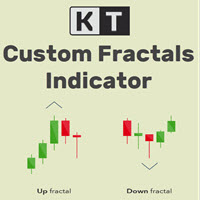
KT Custom Fractals is a personal implementation of the Fractal indicator first introduced by Bill Williams. With KT Custom Fractals you can choose a custom number of bars to allow to the left and right side of the fractal. For example, you can display the fractals that have "three" successive bars with the highest high in the middle and one lower high on both sides , or you can display the fractals that have "Eleven" consecutive bars with the lowest low in the middle and five higher lows on bot

KT Fractal Channel Breakout draws a continuous channel by connecting the successive Up and Down fractals. It provides alerts and also plots the Up and Down arrows representing the bullish and bearish breakout of the fractal channel.
Features
If you use Bill Williams fractals in your technical analysis, you must also include it in your trading arsenal. It can be very effective and useful for stop-loss trailing. A new market trend often emerges after a fractal channel breakout in a new direction.

KT Forex Volume отображает объем покупок и продаж валютной пары в виде цветной гистограммы. Объём состоит из сделок на покупку и продажу по активу. На валютном рынке: Если объем покупок превышает объем продаж, цена валютной пары растёт. Если объем продаж превышает объем покупок, цена валютной пары снижается.
Особенности Избегайте неудачных сделок, подтверждая их с помощью данных по тиковому объему. Помогает торговать в направлении крупных участников рынка. Все оповещения Metatrader включены.
И
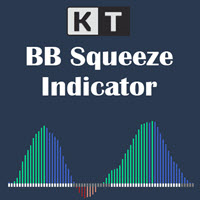
KT BB Squeeze measures the contraction and expansion of market volatility with a momentum oscillator, which can be used to decide a trading direction. It measures the squeeze in volatility by deducing the relationship between the Bollinger Bands and Keltner channels. Buy Trade: A white dot after the series of gray dots + Rising momentum above the zero line.
Sell Trade: A white dot after the series of gray dots + Rising momentum below the zero line. Markets tend to move from a period of low vola
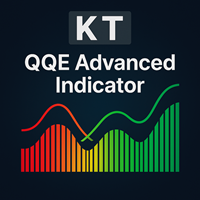
KT QQE Advanced — это модифицированная версия классического осциллятора QQE, которая отображает данные точнее с помощью цветной гистограммы и быстрых/медленных линий сопровождения (Trailing Line, TL).
В отличие от классического QQE, KT QQE Advanced представляет собой гистограмму с уровнями перекупленности/перепроданности.
Применение
Получайте быстрые сигналы на покупку/продажу на всех таймфреймах через MTF‑сканер. Определяйте направление тренда с большей точностью. Выявляйте состояния перекуп
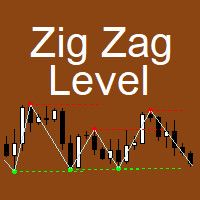
Индикатор реализует авторский подход к построению популярного индикатора "Зиг-Заг".
Преимущества "ZIg Zag Level" индикатора в том, что он отсеивает рыночный шум и показывает уровни.
"ZIg Zag Level" строится по пикам и впадинам, отображает уровни.
Эти уровни можно отключать и настраивать.
Индикатор отображает цену уровня, ценовую метку можно отключить.
Линию "зиг-заг" между точками также можно отключить.
Индикатор имеет встроенную систему оповещений.
Настройки: History_Size - размер отображ
An indicator for you follow the trend. We are providing a group of indicators that can support you decisions...
At this one you are having access to the trend indicator. Please review the others indicators for trend availables... That you give you the ability to understand the market flow and also you will be developing your pacience...
Trend the market as professional... We are using the Average True Range Indicator! Hope you enjoy.
An indicator for you follow the trend candles.
We are providing a group of indicators that can support your decisions...
At this one you are having access to the candle trend indicator. Please review the others indicators for trend availables...
That you give you the ability to understand the market flow and also you will be developing your pacience... Trend the market as professional...
We are using the Average True Range Indicator! Hope you enjoy.
MACD Pro - Features a built-from-scratch overhauled MACD indicator - Signals Buy and Sell Zones - Uses an exceptional noise cancelling filter - Signals up trends and down trends - Precise and accurate signals
MACD Pro is an indicator built from the ground up and is designed to signal optimal buy and sell zones. Take buy trades in the buy zones and sell trades in the sell zones. It includes a noise cancelation feature which rivals the best products on the market.
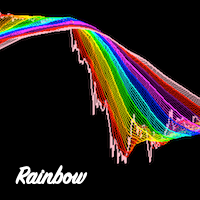
Rainbow Ribbon - Rainbow MA bands - Useful for spotting trend changes - Useful for spotting trend slopes - Useful for spotting trend acceleration - Ability to choose ribbon colors, moving averages, and distances - Provides colorful rainbow ribbons to show an array of moving averages
Rainbow Ribbon is an extremely useful indicator, it has been designed to make it easy to spot the trend and also changes within the trend before they occur. It can be used many different ways and provides the abili

TrendMMK - крайне простой индикатор
Сигнал на покупку и продажу меняется, как только индикатор переворачивает цену закрытия.
Когда тренд закрывается ниже цены, генерируется сигнал на покупку, а когда тренд закрывается выше цены, генерируется сигнал на продажу.
TrendMMK - это трендовый индикатор, и, как и все трендовые индикаторы, он хорошо работает на трендовых рынках
Тем не менее, он дает меньше ложных сигналов, чем многие другие индикаторы, и поэтому если Вы "внутридневной" трейдер, ко

KT Candlestick Patterns Scanner is a Multi-Symbol and Multi-Timeframe scanner that fetches and shows various candlestick patterns on 28 currency pairs and 9 time-frames concurrently . The scanner finds the candlestick patterns by loading the KT Candlestick Patterns indicator as a resource in the background.
Features
The scanner can find the candlestick patterns on 252* combinations of symbols and time-frames from a single chart. Open the signal's chart loaded with a predefined template with a s
Индикатор "TakeOver" простой в использовании, создавался он для удобства определения разницы между открытием и закрытием текущей свечи. "TakeOver" рекомендуется применять в скальпинге с различными стандартными индикаторами МТ4, к примеру Envelopes, ZigZag, RSI и т.д. В настройках по умолчанию установлены уровни 200 и -200, но вы можете самостоятельно изменить. Один из примеров обнаружения входа в открытие сделки изображено на скриншоте, SELL если свеча закрылась выше уровня Envelopes и гистогра
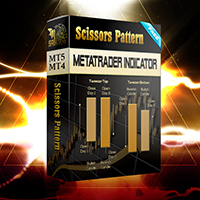
Configure scaffolding charts and signals based on the scissor pattern, which works great at low times.
Buy and sell signs based on 2 previous candle patterns
It works on the active time form, and when detecting the pattern in 4 time frames, 5 minutes, 15 minutes, 30 minutes and one hour, the alert can be set to notify us of the formation of this pattern.
MetaTrader version 5 click here
How to use:
When there is an opportunity to buy or sell, the marker places a scissors mark on the candlest

Индикатор РАННЕГО определения начала нового тренда. Кроме этого, индикатор определяет глобальное направление тренда по количеству точек: если зеленых точек больше (параметр Calculation of the global trend) - тренд вверх; если красных точек больше - тренд вниз. Индикатор не перерисовывается на первой свече. Индикатор можно использовать как самостоятельную торговую систему, и как дополнение к любой другой торговой системе. Индикатор можно использовать на любом торговом инструменте и любом таймфр

OCTO TACK TREND PRO INDICATOR Summary/Description: Trend indicator Shows signals that tell you the current market trend Shows different signals to execute orders in favor of the current trend
Get ready to have the best trend indicator you've ever tried. It does not repaint in any way, once a signal has been captured, it remains there until it is finalized. It generates clear signals and always in favor of the trend (see screenshots) Just be attentive and wait for the alert to tell you when a ne
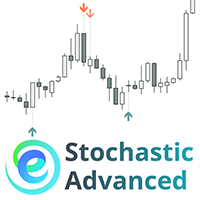
Индикатор " Stochastic Advanced " отображает сигналы индикатора ' Stochastic " прямо на графике без наличия самой кривой индикатора в нижней части экрана. Сигналы индикатора могут отображаться не только по текущему таймфрейму, но и по таймфрейму на уровень старше. Кроме этого мы реализовали систему фильтров по средней скользящей Инструкция/Мануал ( Обязательно читайте перед приобретением ) | Версия для МТ5 Преимущества
1. Отображение сигналов индикатора "Stochastic" прямо на графике без наличия

The Strategy Tester product is an indicator where you can both test and run strategies. There are 64 strategies in total in this indicator. It uses 3 indicators. You can test tens of thousands of strategies by changing the parameter settings of these indicators. You can run 6 strategies at the same time. With this product, you will now create your own signals.
Recommendations and Features Used indicators: Macd, Bulls power, Bears power It works on all time frame Recommended time fram
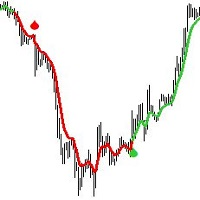
Introducing the Tear Drop Indicator: Your Gateway to Confident Forex Trading.
The Tear Drop Indicator is a powerful MetaTrader 4 tool designed to simplify trend identification and streamline entry point selection. Built upon customized Moving Average principles, this intuitive indicator offers traders an unparalleled advantage in navigating the forex market.
Key Features: 1. Customized Moving Average: The Tear Drop Indicator harnesses the power of customized Moving Averages, providing traders
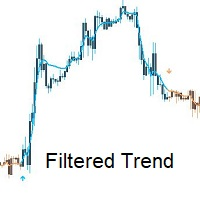
Introducing Filtered Trend: Your Reliable Companion in Forex Trading.
Filtered Trend is a powerful MetaTrader 4 indicator that revolutionizes trend identification and entry point selection in the forex market. Built upon customized Moving Average principles, this intuitive indicator offers traders a simple yet effective tool for navigating the complexities of currency trading.
Key Features: 1. Customized Moving Average: Filtered Trend leverages customized Moving Averages to provide traders wit

Benefits of the Surfboard indicator :
Entry signals without repainting If a signal appears and is confirmed, it does NOT disappear anymore, unlike indicators with repainting, which lead to major financial losses because they can show a signal and then remove it. perfect opening of trades The indicator algorithms allow you to find the Peak and floor position to enter a deal (buy or sell an asset), which increases the success rate for each and every trader using it. Surfboard works with any asset
The Strategy Tester product is an indicator where you can both test and run strategies. There are 64 strategies in total in this indicator. It uses 3 indicators. You can test tens of thousands of strategies by changing the parameter settings of these indicators. You can run 6 strategies at the same time. With this product, you will now create your own signals.
Recommendations and Features Used indicators: Osma, Money Flow index, Stochastic It works on all time frame Recommended time

The Strategy Tester product is an indicator where you can both test and run strategies. There are 64 strategies in total in this indicator. It uses 3 indicators. You can test tens of thousands of strategies by changing the parameter settings of these indicators. You can run 6 strategies at the same time. With this product, you will now create your own signals.
Recommendations and Features Used indicators: Rsi, Bears power, Stochastic It works on all time frame Recommended time frame

The Strategy Tester product is an indicator where you can both test and run strategies. There are 64 strategies in total in this indicator. It uses 3 indicators. You can test tens of thousands of strategies by changing the parameter settings of these indicators. You can run 6 strategies at the same time. With this product, you will now create your own signals.
Recommendations and Features Used indicators: Rsi, Osma, DeMarker It works on all time frame Recommended time frame H1 You

The Strategy Tester product is an indicator where you can both test and run strategies. There are 64 strategies in total in this indicator. It uses 3 indicators. You can test tens of thousands of strategies by changing the parameter settings of these indicators. You can run 6 strategies at the same time. With this product, you will now create your own signals.
Recommendations and Features Used indicators: Stochastic, Macd, Williams Percent Range It works on all time frame Recommended time fr

Фильтр Колмогорова - Журбенко можно рассматривать как специальную оконную функцию, предназначенную для устранения спектральной утечки. Этот фильтр оптимален для сглаживания стохастических (в том числе и финансовых) временных рядов. Индикатор, построенный на основе этого фильтра содержит следующие параметры: iLength - период исходного прямоугольного окна, применяемого для построения фильтра. Допустимое значение 2 - 255. iDegree - порядок фильтра. Если iDegree=0, то получится простая скользящая с

Binary GURU — это индикатор с точностью 75%+ для торговли бинарными опционами и внутридневной торговли в 18:02 (+3 GMT). Индикатор не перерисовывается и не меняет своих показаний. Binary GURU предназначен для определения мест, где цена совершит разворот. Индикатор фиксирует как развороты тренда, так и откаты, что позволяет повысить эффективность его использования. При использовании индикатора значительно расширяются возможности анализа, на графике хорошо видны не только места коррекции и разворо

Tra le tecniche alternative di trading più utilizzate dagli investitori, uno spazio interessante va dato alla strategia Ichimoku cloud che si basasulle nuvole (kumo).
Queste ultime sono il vero fulcro del sistema di trading Hichimoku Kinko Hyo. Molti erroneamente pensano che l’Ichimoku Kinko Hyo sia un semplice indicatore trend following, mentre invece è un vero e proprio sistema di trading completo .
Infatti grazie a UN SOLO grafico (sia pure molto complesso) ci dà una visione completa
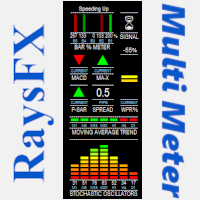
Questo indicatore è studiato per analizzare:
Lo Stochastic Oscillators , la Moving Averages , il MACD , il crossover MA , e per finire i Parabolic SAR. Il tutto viene racchiuso in un grafico che indicherà con frecce e spettri il momento ideale per aprire un trade. "La precisione dei segnali dipende sempre dai valori impostati, con i valori stock si ha un ottima affidabilità "
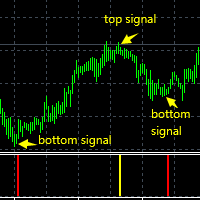
The super trade signals channel index system automatically calculates the supporting lower track and resistance upper track according to the fluctuation amplitude of K-line at this stage and the position of space.
The super trade signals channel indicator system will automatically calculate and detect the supporting lower rail line and resistance upper rail line at the position of K line in real time. When the price of K line touches the supporting lower rail line, it will automatically prompt
Индикатор Strong Reversal Points H1 показывает стрелками сильные разворотные точки на таймфрейме H1. Индикатор не перерисовывает! Для максимального винрейта торгуйте только на таймфрейме H1 и только 3 (три) основные валютные пары: EURUSD, GBPUSD, USDCAD! Обязательно! Перед торговлей или тестом (прогоном в тестере) убедитесь в том, что в вашем терминале MT4 установлен правильный час открытия торгов в Нью-Йорке (параметр Terminal_NewYork_Open_Hour). Нужен час открытия Нью-Йорка именно по времени в
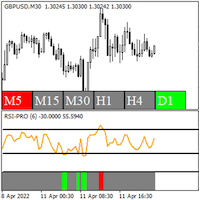
RSI Pro Indicator - Shows accurate RSI signals with modifiable price applications - Shows accurate RSI overbought and oversold levels - Shows multiple timeframe RSI overbought and oversold conditions on a single chart - 3 green bar sections in a row is an uptrend pattern - 3 red bar sections in a row is a downtrend pattern
The RSI Pro Indicator is a highly useful tool for determining overbought and oversold conditions and spotting RSI patterns, as well as spotting overbought and oversold condi
Become a constantly profitable 5-star forex trader!
We offer a few indicators to support you understand and analyse the market! With our strategies you will improve your trading system and bacome an expert...
We have indicators for trend direction, market direction and others.. for multi-time frames and that covers all majors or your favorite trading symbols! Some of them offer a customizable calculation parameters... or Graph features!
See how powerful they are! The are also easy-to-use tr
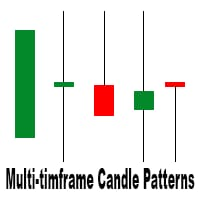
This is a multi-timeframe candle patterns indicator. It scans the chart for Hammer , Engulfing candle , Doji candle and Three white soldiers / black crows setups.
FEATURES: Main panel showing timeframe s from M5 - W1, last signal and last signal time of the selected candle pattern. You can switch between the timeframes by clicking on them. A panel with buttons to switch from one candle pattern to another on the main panel. Arrows to help you locate the candle pattern. A scale showing you what ca
Become a constantly profitable 5-star forex trader!
We offer a few indicators to support you understand and analyse the market! With our strategies you will improve your trading system and bacome an expert...
We have indicators for trend direction, market direction and others.. for multi-time frames and that covers all majors or your favorite trading symbols! Some of them offer a customizable calculation parameters... or Graph features!
See how powerful they are! The are also easy-to-use tr
Become a constantly profitable 5-star forex trader!
We offer a few indicators to support you understand and analyse the market! With our strategies you will improve your trading system and bacome an expert...
We have indicators for trend direction, market direction and others.. for multi-time frames and that covers all majors or your favorite trading symbols! Some of them offer a customizable calculation parameters... or Graph features!
See how powerful they are! The are also easy-to-use t
Become a constantly profitable 5-star forex trader!
We offer a few indicators to support you understand and analyse the market! With our strategies you will improve your trading system and bacome an expert...
We have indicators for trend direction, market direction and others.. for multi-time frames and that covers all majors or your favorite trading symbols! Some of them offer a customizable calculation parameters... or Graph features!
See how powerful they are! The are also easy-to-use tr

Три основных валютных рынка в мире:
Нью-Йорк (время США), Лондон (время Европы) и Токио (время Азии).
Лучшее время для торговли на рынке Форекс — это когда основные торговые рынки пересекаются. Как правило, большинство трейдеров участвуют в этих торговых сессиях, которые обеспечивают большую ликвидность и меньшие спреды между валютными парами, которыми торгуют инвесторы. , выберите эти периоды времени для торговли, вам будет легче зарабатывать деньги.
Я разработал индикатор, который может по

The Awesome Oscillator (AO) is one of the most popular indicators that are used to measure momentum in the stock and commodity markets. It was developed by Bill Williams, a famous charting enthusiast and technical analyst who approached the markets on a psychological level. In this article, we will detail the calculations used to compile the Awesome Oscillator to then move on to applying the indicator in practice. We are also going to look at how the AO is different from other oscillators, as we
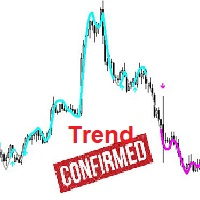
Introducing the Trend Confirmation Indicator: Your Gateway to Confident Forex Trading.
The Trend Confirmation Indicator is a powerful MetaTrader 4 tool meticulously designed to simplify trend identification and streamline entry point selection in the forex market. Built upon customized Moving Average principles, this intuitive indicator offers traders an unparalleled advantage in navigating currency trading with precision and confidence.
Key Features: 1. Customized Moving Average: The Trend Co

This indicator gives entry signals in trend direction and also trend direction there is tow mode of signals for tow type of trading 1 - swing trading 2- scalping On scalping mode signals have small stop loss and big R/R On swing mode can be waited more for TP or SL . Non-Repaint Indicator suitable for all currency and all time frame Detect UpTrend , DownTrend and SideTrend (Possibility of Changing Trend) There is tow mode for signals (Scalp Mode , Swing Mode) Pop up alert , email , Push not

Среднее Лемера можно рассматривать как оконную функцию, весовые коэффициенты которой зависят от значений используемых при расчете переменных. Это среднее является нелинейным, так как при его расчете используется возведение в степень. Характеристики индикатора зависят от двух параметров: iPeriod - период индикатора, допустимое значение больше или равно 2; iPower - показатель степени, который используется прирасчете значений индикатора. Допустимый интервал от -32 768 до 32 767
При iPower = 0 мы

This indicator is a powerful assistant that shows bullish/bearish zones on the chart and the candlestick patterns that happen on any timeframe. It shows zones based on changes in price and 25 defined patterns which are shown as bullish or bearish on the chart after close of the candle, so there is no repaint. Also, you can select other timeframes in order to see the patterns happening on them. Patterns There are 25 defined patterns in this indicator. Eight patterns can be bullish or bearish, 8 p
Узнайте, как легко и просто купить торгового робота в MetaTrader AppStore - магазине приложений для платформы MetaTrader.
Платежная система MQL5.community позволяет проводить оплату с помощью PayPal, банковских карт и популярных платежных систем. Кроме того, настоятельно рекомендуем протестировать торгового робота перед покупкой, чтобы получить более полное представление о нем.
Вы упускаете торговые возможности:
- Бесплатные приложения для трейдинга
- 8 000+ сигналов для копирования
- Экономические новости для анализа финансовых рынков
Регистрация
Вход
Если у вас нет учетной записи, зарегистрируйтесь
Для авторизации и пользования сайтом MQL5.com необходимо разрешить использование файлов Сookie.
Пожалуйста, включите в вашем браузере данную настройку, иначе вы не сможете авторизоваться.