 Все заказы
 Правила
Техническое задание
The Indicator is composed by
a. 1 HI 1 LOW for Years, Months, Weeks, Days. ( 1 colour for each HI LOW tot. 4 coloured lines)
b. Open/Close price for Year, Month, Week, Day.
PART ONE
3 HI LOW
Fig.1 The idea of the Indicator. You can see Yearly, Monthly and Weekly HI Low.
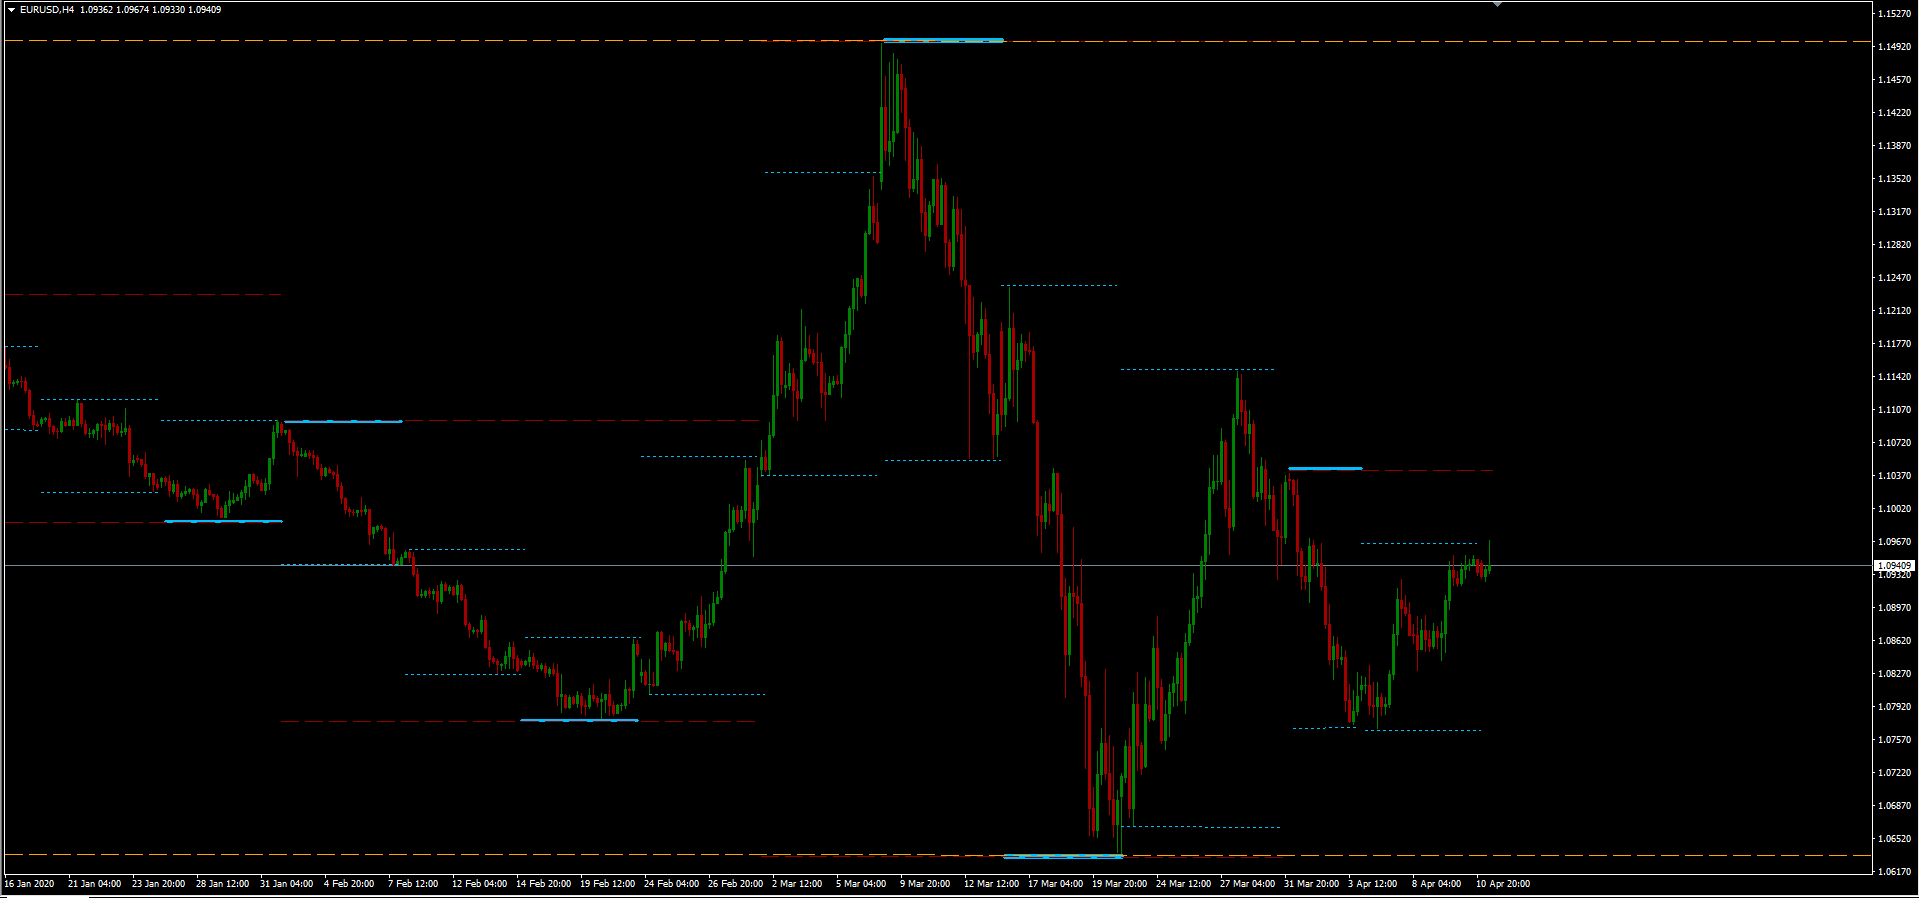
THE CURRENT YEAR, MONTH, WEEK, DAY ARE 0. Going back to the past adding +1 to each period.
So we have one period/session composed by:
Years 0 (2020) Month 0 ( April) Week 0 ( current week) Day 0 (current Day).
The previous period/session is +1.
Example
2020 is Year 0, 2019 is Year 1, 2018 is Y2, 2017 is Y3 and so on.
April is Month 0, March is M1, Febbruary is M2, Gennuary is M3 and so on.
Current week is Week 0, last week is W1, last week of March is W3 and so on.
Today is 14th April Day 0, 13th April is D1, 10th April is D2 and so on. (12th and 11th are saturday and sunday, not included in the count).
Monthly chart show yearly hi low only;
Weekly chart show yearly and monthly hi low only;
from Daily chart to H2 show yearly, monthly, weekly hi low only;
from H1 to M1 show yearly, monthly, weekly, daily hi low.
Fig.2 you can see 3 hi lines at the same price (of course) Y0, M1, W4 (called HY0M1W4*)
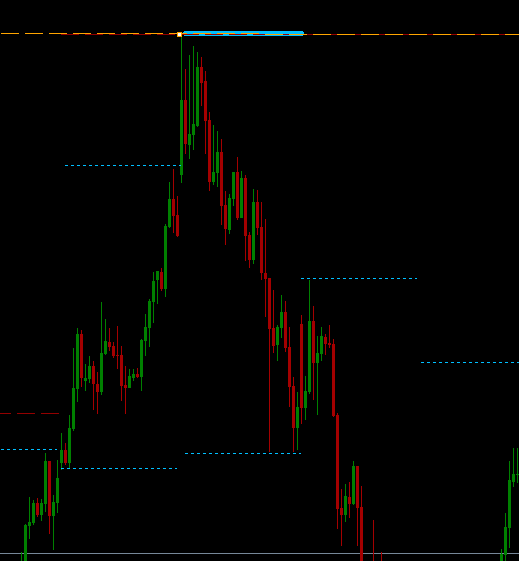
So the resulted line has to show this level in a different way like in the picture.
In Fig.3 it' s clear what i mean. In this case Monthly and Weekly are at the same price so the resulted hi low lines has to be different (marked).
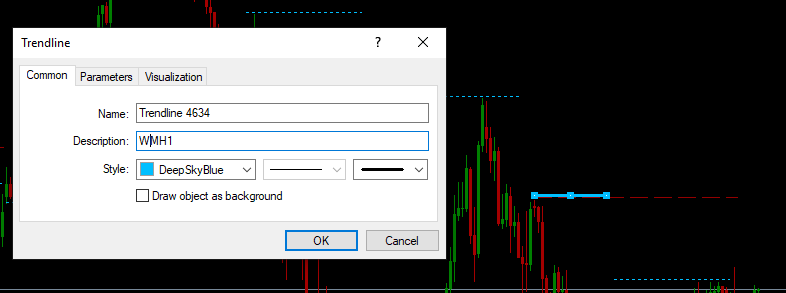
In the description you can see the name of the Hi Low result (called HW1M1*).
* The name of the hi low lines i assigned for it. For mathematical reason can be different or more logical.
The colours of HI Low can be:
Year = Dark Green
Month = Dark Red
Week = Dark Magenta
Day = DeepSkyBlue
(or two different colour for hi and low like Dark for Low lines and Light for Hi lines)
Of course the chance to customize colours and lines!
PART TWO
OPEN CLOSE PRICE
What I want to see is Open/Close price of every year, month, week, day.
Monthly chart show O/C of years only;
Weekly chart show O/C of years and months only;
from Daily chart to H2 chart show O/C of years, months and weeks only;
from H1 to M1 chart show O/C of years, months, weeks and days.
(Open and Close can be coloured at the same way of HI LOW,
Open Dark Close Light)
The idea is to see open and close price leaving the chart as clean as possible.
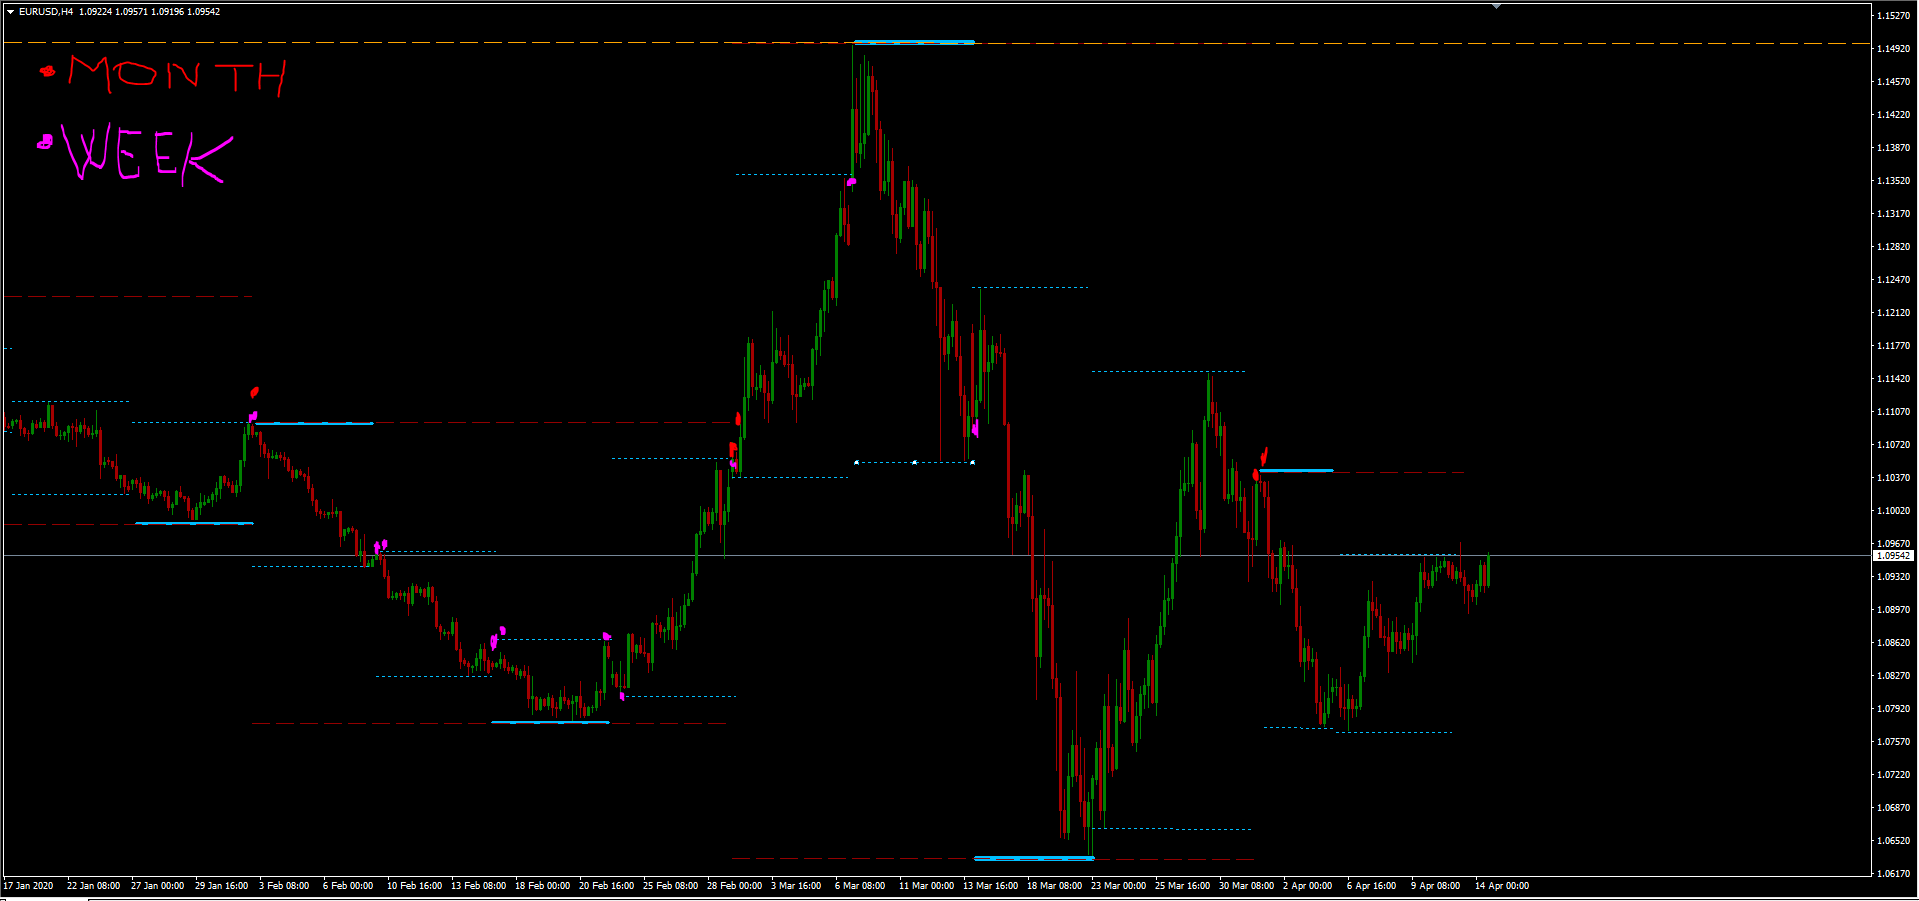
I though if could be possible to mark the price for the "Current period" ( Year 0, Month 0, Week 0, Day 0) in the price axis and the historical data in the chart.
I though at small coloured dot with same colour of the Hi Low lines and if you click on it you can see the price.
I accept suggestion for this issue
In Fig. 4 one of my ideas of the indicator
Example
On Monday start a new daily session of a new weekly session of a new monthly session.
The Open price is the same for all the parameters. Showed in the chart something like that: M0W0D0+open price or 0MWD+open price or open price+m0w0d0.
Panel Control (minimizable)
You can switch on/off all parameters you want one by one.
Contact me for any question or suggestion.