The Indicator is composed by
a. 1 HI 1 LOW for Years, Months, Weeks, Days. ( 1 colour for each HI LOW tot. 4 coloured lines)
b. Open/Close price for Year, Month, Week, Day.
PART ONE
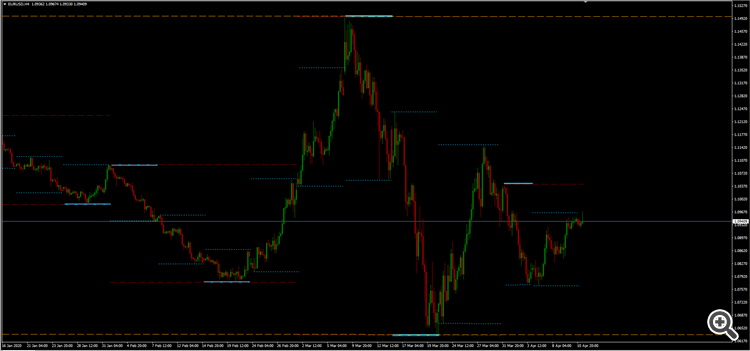
3 HI LOW
Fig.1 The idea of the Indicator. You can see Yearly, Monthly and Weekly HI Low.

THE CURRENT YEAR, MONTH, WEEK, DAY ARE 0. Going back to the past adding +1 to each period.
So we have one period/session composed by:
Years 0 (2020) Month 0 ( April) Week 0 ( current week) Day 0 (current Day).
The previous period/session is +1.
Example
2020 is Year 0, 2019 is Year 1, 2018 is Y2, 2017 is Y3 and so on.
April is Month 0, March is M1, Febbruary is M2, Gennuary is M3 and so on.
Current week is Week 0, last week is W1, last week of March is W3 and so on.
Today is 14th April Day 0, 13th April is D1, 10th April is D2 and so on. (12th and 11th are saturday and sunday, not included in the count).
Monthly chart show yearly hi low only;
Weekly chart show yearly and monthly hi low only;
from Daily chart to H2 show yearly,
monthly, weekly hi low only;
from H1 to M1 show yearly, monthly, weekly,
daily hi low.
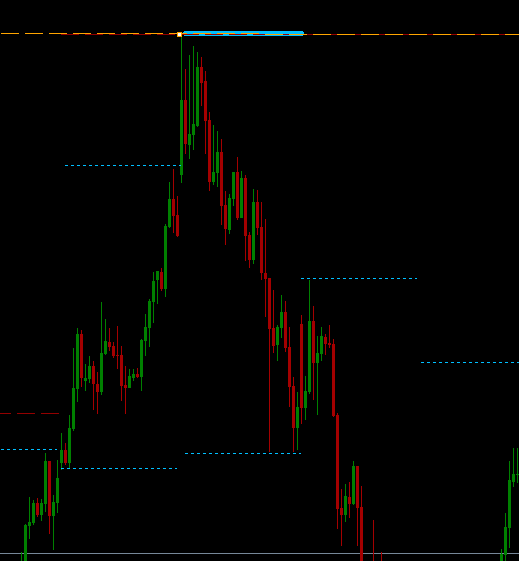
Fig.2 you can see 3 hi lines at the same price (of course) Y0, M1, W4 (called HY0M1W4*)

So the resulted line has to show this level in a different way like in the picture.
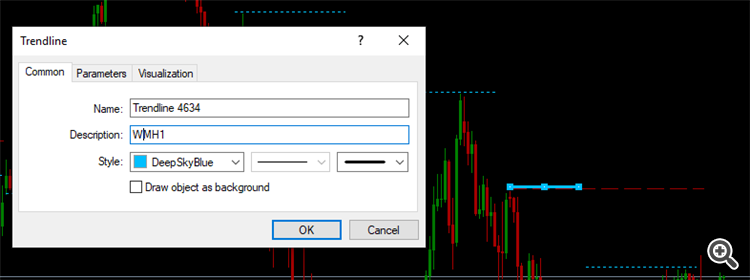
In Fig.3 it' s clear what i mean. In this case Monthly and Weekly are at the same price so the resulted hi low lines has to be different
(marked).

In the description you can see the name of the Hi Low result (called HW1M1*).
* The name of the hi low lines i assigned for it. For mathematical reason can be different or more logical.
The colours of HI Low can be:
Year = Dark Green
Month = Dark Red
Week = Dark Magenta
Day = DeepSkyBlue
(or two different colour for hi and low like Dark for Low lines and Light for Hi lines)
Of course the chance to customize colours and lines!
PART TWO
OPEN CLOSE PRICE
What I want to see is Open/Close price of every year, month, week, day.
Monthly chart show O/C of years only;
Weekly chart show O/C of years and
months only;
from Daily chart to H2 chart
show O/C of years, months and weeks only;
from H1 to M1 chart show O/C of years,
months, weeks and days.
(Open and Close can be coloured at the same way of HI LOW,
Open Dark Close Light)
The idea is to see open and close price leaving the chart as clean as possible.
I though if could be possible to mark the price for the "Current period" ( Year 0, Month 0, Week 0, Day 0) in the price axis
and the historical data in the chart.
I though at small coloured dot with same colour of the Hi Low lines and if you click on it you can see the price.
I accept suggestion for this issue
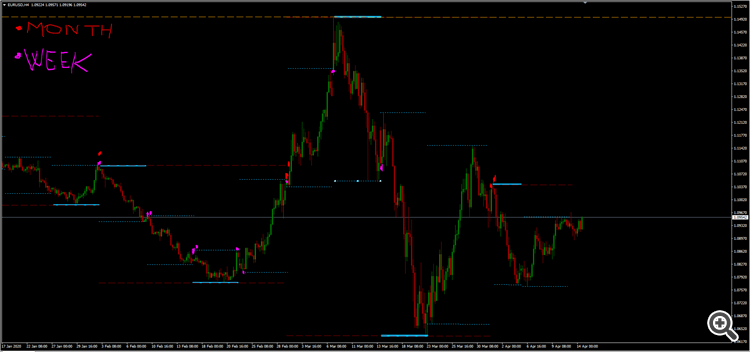
In Fig. 4 one of my ideas of the indicator

Example
On Monday start a new daily session of a new weekly session of a new monthly session.
The Open price is the same for all the parameters. Showed in the chart something like that: M0W0D0+open price or 0MWD+open price or open
price+m0w0d0.
Panel Control (minimizable)
You can switch on/off all parameters you want one by one.
Contact me for any question or suggestion.
비슷한 주문
I want to buy the EA today, Provide me with demo ex5, proof of profitability and Proof that the EA is profitable in your application. *NO Martingale* or Avaraging down
I am looking for a professional MQL4 developer to build a fully automated MT4 Expert Advisor (EA) for XAUUSD (Gold only). PLATFORM: - MetaTrader 4 (MT4) - Broker: Hankotrade (ECN conditions) - Symbol: XAUUSD only GENERAL RULES: - Fully automated EA (no manual confirmation required) - NO martingale - NO grid - NO hedging - One trade at a time - Works on live and demo accounts - Must allow manual stop/disable at any
i want to develop martingale base ea with some risk managemnet i will provide the trade ac id password need to study the strategy then i need competle flexible risk management that can be changed and set accorddingly when it required. ac number -13145 pass- View@1234 server- ambitious capital
I'm seeking an experienced MQL5 developer to create a robust Expert Advisor (EA) that integrates 4 powerful strategies into a single, cohesive system. The EA will trade XAUUSD exclusively and adhere to strict risk management principles, avoiding grid and martingale techniques. *Strategy Overview* The EA will incorporate the following strategies, each with its own unique approach: 1. *High Timeframe Trend Reversal*
Here are the ThinkScript codes from ThinkorSwim in a Text (.txt) file- I placed a hashmark (#) by the name of each indicator or system with the code underneath - let me know if you have any questions as you convert these into TradingView - thanks i will be looking for graet developer to build for this project
Hi, I’m searching for a developer who already has a high‑performance Gold EA that can beat the results shown in my screenshot. If you have such an EA, please reply with: - A brief description of how it works (grid, scalping, SMC, etc.) - Backtest results and the set files you used - Whether you’re willing to make minor tweaks so I can use it as my own If the performance looks good, we can discuss adjustments and next
cần người tạo EA y thay đổi hình ảnh gửi đầy đủ tính năng như hình giá cả có thể tăng thêm khối lượng mong muốn viết giống hình không khác ROBOT HƠI NHIỀU TÍNH NĂNG MỌI NGƯỜI CÓ THỂ ĐƯA GIÁ THAM KHẢO
Require the development of a high-speed HFT, fully automated trading Expert Advisor (EA) for MetaTrader 5 , optimized for live trading on both Deriv and Exness . The EA must be designed for fast execution, low latency, and reliability on real-money accounts , with full compatibility across broker-specific contract specifications, tick sizes, tick values, pricing formats, and volume rules. It should automatically
Here's the TradeStation ELD files that i want to convert to tradingview pine script (unprotected so you can see codes for indicators and systems/strategies) - let me know what you think it would cost? thanks i will be looking for great developer that will bid it for it and get started
Project Overview I am looking for an experienced MT5 (MQL5) developer to modify an existing Account Protection EA and, if required, extend it with custom logic. This is NOT a strategy or trading EA . The EA is purely for risk management, drawdown protection, alerts, and trading lock , suitable for prop-firm and managed accounts . Core Requirements 1. Alerts & Monitoring Alert on trade entry and trade exit Alert when