The Indicator is composed by
a. 1 HI 1 LOW for Years, Months, Weeks, Days. ( 1 colour for each HI LOW tot. 4 coloured lines)
b. Open/Close price for Year, Month, Week, Day.
PART ONE
3 HI LOW
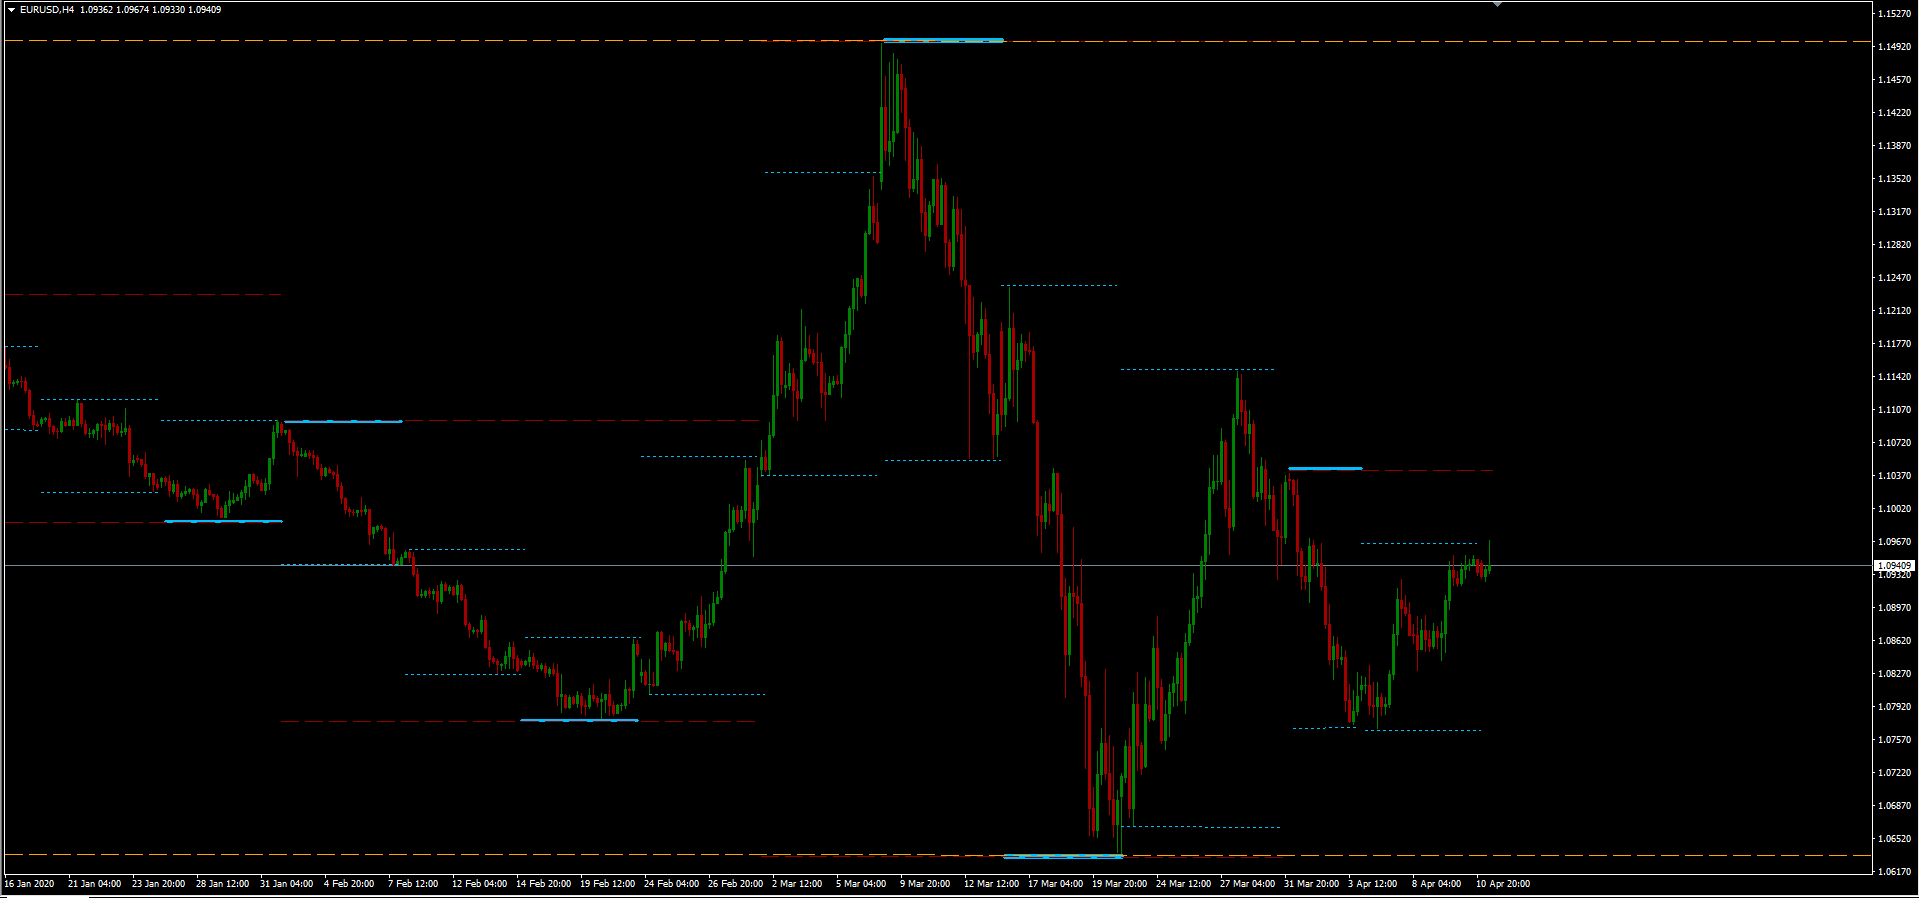
Fig.1 The idea of the Indicator. You can see Yearly, Monthly and Weekly HI Low.
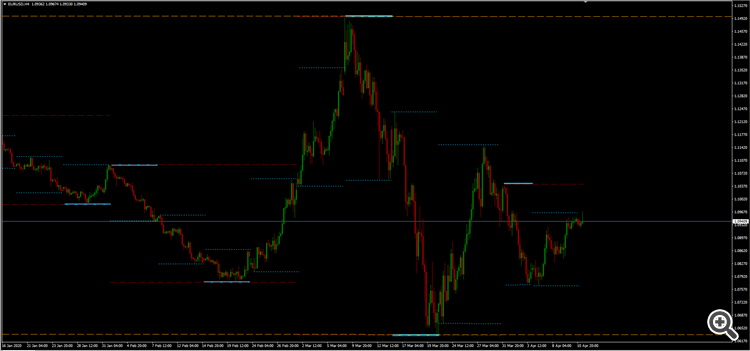
THE CURRENT YEAR, MONTH, WEEK, DAY ARE 0. Going back to the past adding +1 to each period.
So we have one period/session composed by:
Years 0 (2020) Month 0 ( April) Week 0 ( current week) Day 0 (current Day).
The previous period/session is +1.
Example
2020 is Year 0, 2019 is Year 1, 2018 is Y2, 2017 is Y3 and so on.
April is Month 0, March is M1, Febbruary is M2, Gennuary is M3 and so on.
Current week is Week 0, last week is W1, last week of March is W3 and so on.
Today is 14th April Day 0, 13th April is D1, 10th April is D2 and so on. (12th and 11th are saturday and sunday, not included in the count).
Monthly chart show yearly hi low only;
Weekly chart show yearly and monthly hi low only;
from Daily chart to H2 show yearly,
monthly, weekly hi low only;
from H1 to M1 show yearly, monthly, weekly,
daily hi low.
Fig.2 you can see 3 hi lines at the same price (of course) Y0, M1, W4 (called HY0M1W4*)
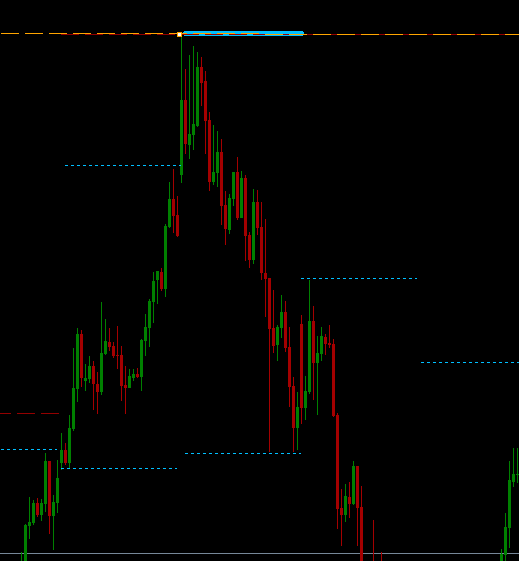
So the resulted line has to show this level in a different way like in the picture.
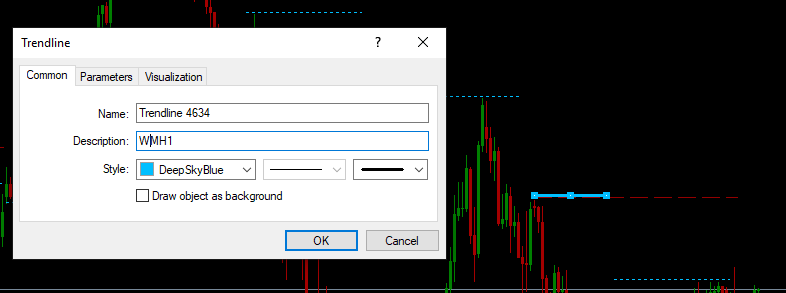
In Fig.3 it' s clear what i mean. In this case Monthly and Weekly are at the same price so the resulted hi low lines has to be different
(marked).
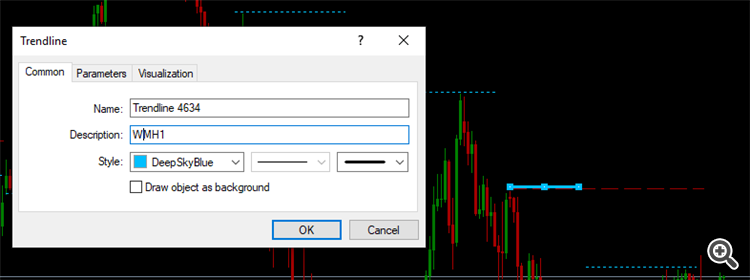
In the description you can see the name of the Hi Low result (called HW1M1*).
* The name of the hi low lines i assigned for it. For mathematical reason can be different or more logical.
The colours of HI Low can be:
Year = Dark Green
Month = Dark Red
Week = Dark Magenta
Day = DeepSkyBlue
(or two different colour for hi and low like Dark for Low lines and Light for Hi lines)
Of course the chance to customize colours and lines!
PART TWO
OPEN CLOSE PRICE
What I want to see is Open/Close price of every year, month, week, day.
Monthly chart show O/C of years only;
Weekly chart show O/C of years and
months only;
from Daily chart to H2 chart
show O/C of years, months and weeks only;
from H1 to M1 chart show O/C of years,
months, weeks and days.
(Open and Close can be coloured at the same way of HI LOW,
Open Dark Close Light)
The idea is to see open and close price leaving the chart as clean as possible.
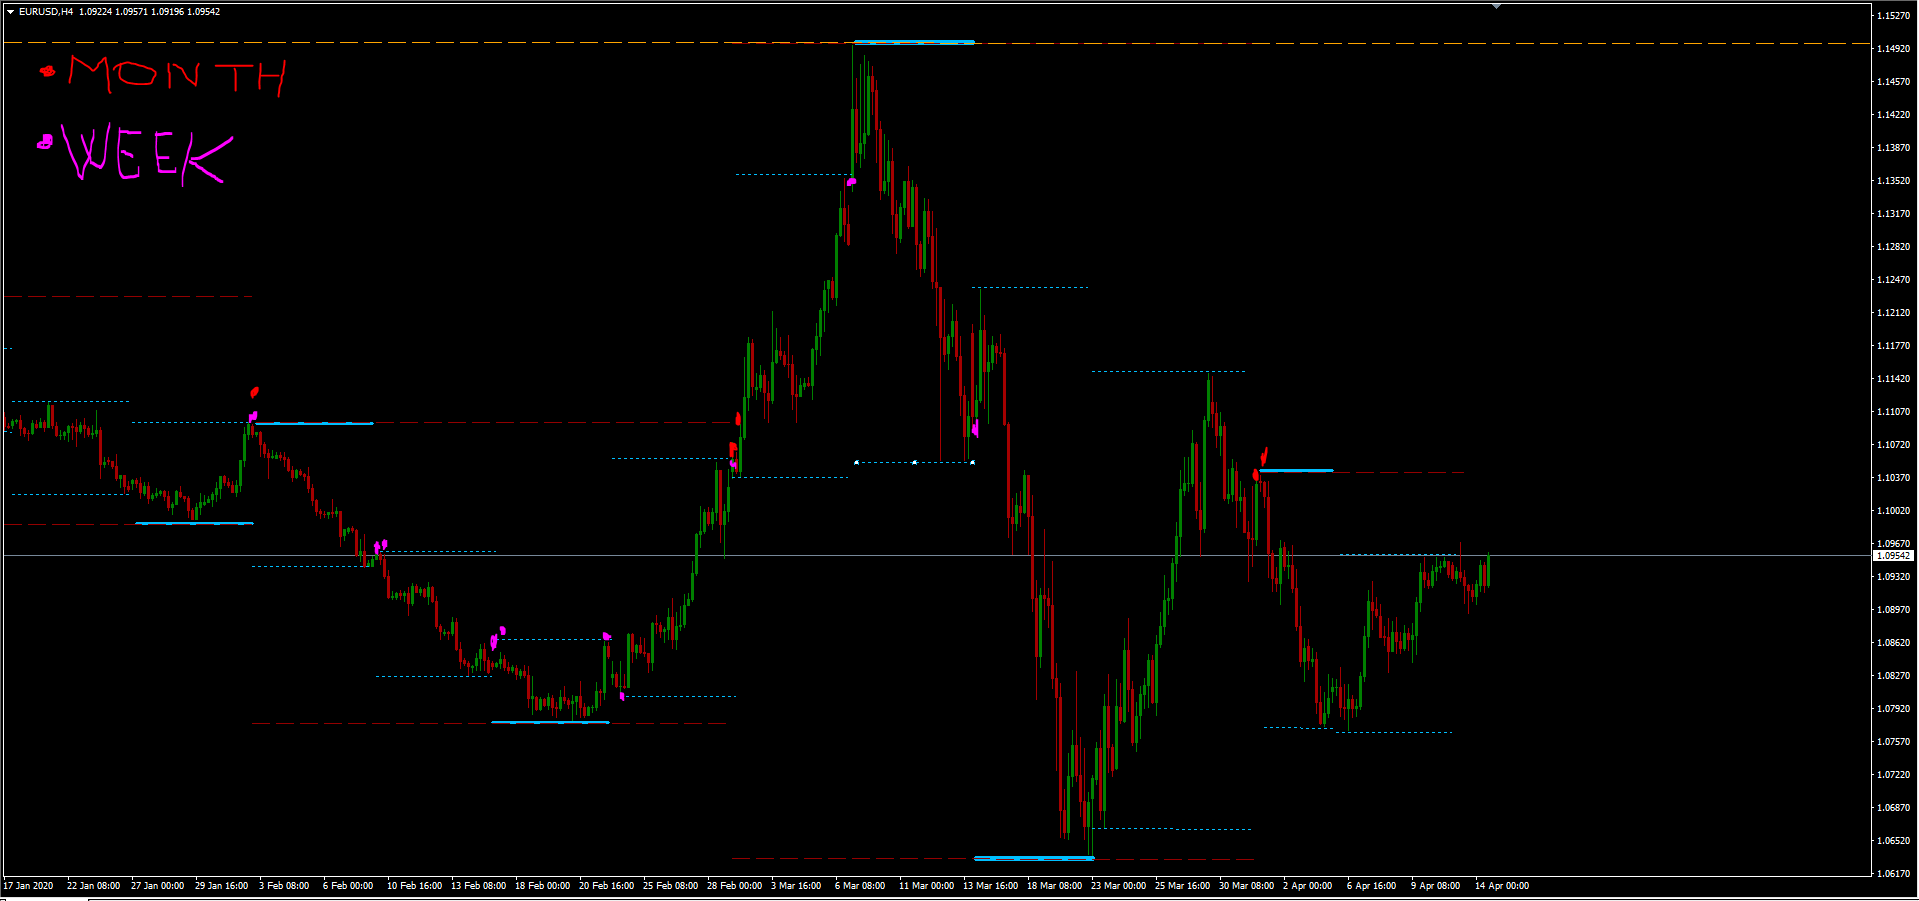
I though if could be possible to mark the price for the "Current period" ( Year 0, Month 0, Week 0, Day 0) in the price axis
and the historical data in the chart.
I though at small coloured dot with same colour of the Hi Low lines and if you click on it you can see the price.
I accept suggestion for this issue
In Fig. 4 one of my ideas of the indicator
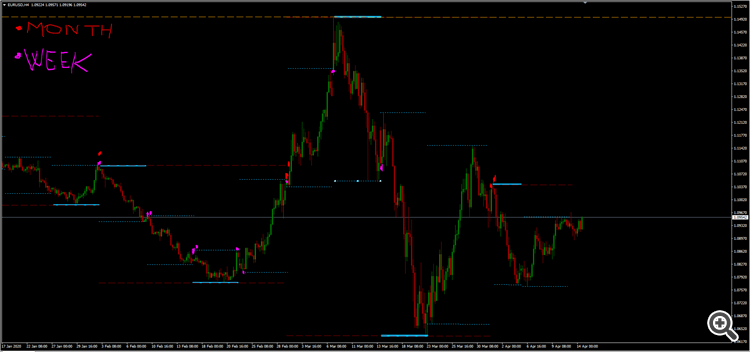
Example
On Monday start a new daily session of a new weekly session of a new monthly session.
The Open price is the same for all the parameters. Showed in the chart something like that: M0W0D0+open price or 0MWD+open price or open
price+m0w0d0.
Panel Control (minimizable)
You can switch on/off all parameters you want one by one.
Contact me for any question or suggestion.
Commandes similaires
I need a fully automated custom Expert Advisor for MetaTrader 5 (MQL5). The EA is intended for use on a The5ers $100,000 2-Step prop-firm account. IMPORTANT DELIVERY REQUIREMENT: I must receive the complete editable .mq5 source code as well as the compiled .ex5 file. Compiled-only delivery is NOT acceptable. The EA must be coded specifically for this project and must not copy trades, use external trading signals or
I need a professional XAUUSD signal indicator for MetaTrader 5, written entirely in MQL5 (.mq5). IMPORTANT: This is NOT an auto-trading EA. It must never open, close or modify trades. It only analyzes XAUUSD and generates signals + MT5 push notifications. 1. Multi-timeframe analysis: H4 → H1 → M30 → M15 → M10 → M5 → M1. 2. Detect market structure: - Swing High / Swing Low - BOS - MSS - CHOCH - Bullish/Bearish HTF
i have indicator for Trading View, also copy for NT, i need someone to improve and check the NT version (indicator is simple is volume density koncept)…. when i put same settings on TV version and NT version i have diffrerent results, but this can be because diffrent market data or fact that TV sending tick info in blocks , not tick by tick like NT8 on both. I(ndicator base on counting volume) so besied that is it
Hey guys, I’ve got an MT4 HFT EA that’s showing strong results on an IC Markets demo account, and I'm looking to move it over to MT5. Does anyone have a solid MT5 version that performs well on IC Markets? Having the source code (MQL5) included would be awesome. Thanks for any leads
Freelance Task — EA Recovery Layer Hello. I have a ready-made MQL5 EA. The signals, SL/TP and lot calculation should essentially not be touched. I need a recovery system added. I am not a programmer — below is how the robot should behave. What stays Entry only from an EA signal. Stop-loss is not a new signal. Trailing is already built into my EA — recovery does not implement its own trailing. If trailing is disabled
Most of the expert is already coded . Create a panel to show the Ratio for the Range . Trigger is based on ratio . Show Distribution / project starts after we clear Distribution
I am looking for an experienced MQL5 developer who can BOTH research trading strategies and develop a commercial-quality MetaTrader 5 Expert Advisor. This is NOT simply a coding job. The developer is free to choose the trading logic, indicators, entry method, exit method, timeframe architecture and strategy type. I do not require the EA to copy or resemble any existing commercial EA. My priority is: ROBUST LONG-TERM
Project Description I am looking for an experienced MQL5/MT5 Expert Advisor developer to develop an automated trading EA for XAUUSD on the M3 timeframe , running on an Exness account . The EA will automate a manual strategy based on SNR/GAP zones , using two setup types: Price Rejection Price Correction The EA should identify valid BUY/SELL setups around predefined SNR/GAP areas, apply configurable RSI, SMA, EMA and
I need an MT5 Expert Advisor for XAUUSD (Gold) running on an Exness account. STRATEGY LOGIC The exact entry and exit rules will be provided in writing before development starts. Please quote for a single rule-based strategy with clearly separated logic, so the rules can be adjusted later without rewriting the whole EA. RISK MANAGEMENT (this is the priority of the project) - Risk per trade as a percentage of account
Hello everybody, I'm looking for an experienced MQL4/MQL5 developer to optimize a High-Frequency Trading (HFT) Expert Advisor for both MT4 and MT5. The EA performs consistently and profitably on demo accounts, but when it is run on Raw and Standard live accounts under what appear to be the same trading conditions, it begins generating losses. I do not have the original source code (.mq4/.mq5); I only have the
 Toutes les commandes
 Règles