Обсуждение статьи "Комбинаторика и теория вероятностей для трейдинга (Часть III): Первая математическая модель"
I have been with forex for three years, I am a hobbyist looking for, I treat it as a good mind exercise and a puzzle :) but at the same time I believe that there is a metamodel :) although you have to remember that Forex is not our business, it is someone's business in which this someone has goal to earn money, our money :)
While testing simple EA models, I asked myself what was generating the price / current candlestick chart.
1. In the Order Book we see buy / sell offers (no market orders are visible there)
2. Offers have price and volume (aggregated)
3. The market buyer / seller comes and places the order on the market, and the deal is carried out with the closest price from the offers "order book" and price moves to this place.
If this is true, then in special cases the price may be changed
a) by a large distance with a small amount of volume, or
b) by a small distance with a very large amount.
I started to wonder because the only thing that drives the price is the incoming on-market orders that fulfill the pending offers.
Offers may wait, be changed, etc., but these changes in the price itself do not change, only an incoming and executed on-market order causes it.
... and we do not see the on-market order itself, we do not know when it will come, with what volume and at what price.
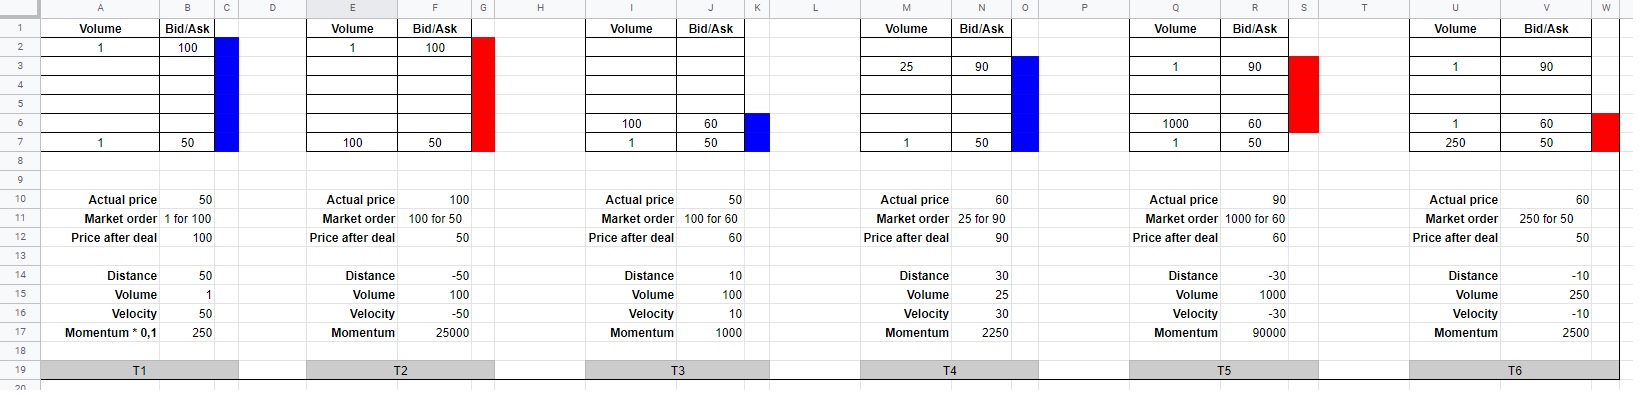
I drew an example of the price movement in excel
I do not know if I understand it well and I do not know if this quality can be used
.
Автор красавчик! Глубоко! Я реально осознаю что делает автор, и возьму на себя смелость сказать, что знаю, к какому результату он в конечном итоге придет. Но как всегда далее следует большое НО. Самое сложное далее - это что делать с полученной информацией? Т.к. однозначного ответа в конце туннеля нет. Хотя .....
Спасибо, тут действительно пока еще больше вопросов, нежели ответов. Конкретно что с этой моделью можно сделать? Ну например можно полностью смоделировать трендовые стратегии различной сложности без того чтобы прибегать к тестированию в тестере, также данная модель теперь полностью может описать CarryTrade. На основе нее можно составить уравнения для поиска экстремумов прибыльности этой стратегии и вычислять наиболее прибыльные конфигурации для конкретного брокера(все это можно делать на лету в советнике). Но конечно же не в голом виде, а с некоторыми дополнениями. Это только что я могу придумать ).
I have been with forex for three years, I am a hobbyist looking for, I treat it as a good mind exercise and a puzzle :) but at the same time I believe that there is a metamodel :) although you have to remember that Forex is not our business, it is someone's business in which this someone has goal to earn money, our money :)
While testing simple EA models, I asked myself what was generating the price / current candlestick chart.
1. In the Order Book we see buy / sell offers (no market orders are visible there)
2. Offers have price and volume (aggregated)
3. The market buyer / seller comes and places the order on the market, and the deal is carried out with the closest price from the offers "order book" and price moves to this place.
If this is true, then in special cases the price may be changed
a) by a large distance with a small amount of volume, or
b) by a small distance with a very large amount.
I started to wonder because the only thing that drives the price is the incoming on-market orders that fulfill the pending offers.
Offers may wait, be changed, etc., but these changes in the price itself do not change, only an incoming and executed on-market order causes it.
... and we do not see the on-market order itself, we do not know when it will come, with what volume and at what price.
I drew an example of the price movement in excel
I do not know if I understand it well and I do not know if this quality can be used
.
Thanks for the support ! And with regards to your conclusions, everything is really so, by the way, I myself have recently considered the same thoughts approximately. The only problem is that on MT4 it is unlikely that it will give anything, there is not really a glass there. But on MT5, some brokers show a real order book. So far, I haven’t dealt with such advisors for obvious reasons. But in general, I can say that yes, everything is exactly as you described. I am sure that you can use this where you can get the most accurate and reliable glass. By the way, the levels are also based on these considerations. If we connect the theory of probability, then it will be possible to compose differential equations of price movement, based on the data of the order book. I think this is not difficult to do. I could.
By the way, we do not know when the market order will come, in fact, we know, there is a probability of coming, we cannot know more. These differential equations will be probabilistic, and their capabilities will only include calculating the odds, since the price is a probabilistic model, it never has a clear future. In such cases, probabilities are used and instead of a clear future we get a clear probability, that's the trick.
Dzięki za wsparcie! A jeśli chodzi o twoje wnioski, wszystko jest naprawdę tak, nawiasem mówiąc, sam ostatnio rozważałem w przybliżeniu te same myśli. że problem jest problem, że na MT jest mało, cokolwiek, tak naprawdę nie ma tego problemu. Ale na MT5 maklerzy śledcze wyznaczniki. Do tej pory nie trzeba tłumaczyć, więc nie ma możliwości czynienia z takimi doradcami. Ale ogólnie mogę powiedzieć, że tak, wszystko jest w nawierzchni takie, jak opisałeś. Jestem pewien, że możesz to tam, gdzie możesz uzyskać dokładne i jasne. Nawiasem mówiąc, poziomy są również oparte na tych rozważaniach. Jeśli połączymy teorię prawdopodobieństwa, to na podstawie danych z księgi zleceń będzie skomponować. Myślę, że nie jest na trudnej sytuacji. Mógłbym.
Swoją tak nie ma drogi, kiedydzie warstwy rynku, w rzeczywistości w rzeczywistości, że jest prawdopodobieństwo, że nie możemy wiedzieć więcej. Teoretyczne stypendystyczne będą tylko probabilistyczne, a ich możliwości będą miały status równy prawnie, ponieważ cena jest modelem probabilistycznym, nigdy nie ma jasnych danych przyszłoś W takich przypadkach używających się prawdopodobieństw i bezpieczniej, aby zapewnić sobie bezpieczeństwo, to jest sztuczka.
Myślimy o dokładnie podobnej rzeczy. Kiedy zrozumiałem, co i dlaczego cena się zmienia, zrozumiałem też, że na danym poziomie cenowym jest kupujący/sprzedawca, który jej „broni”.
Wiadomo, że mali handlarze niczego nie obronią, ale można szukać dużych śladów.
Opracowałem szybkie EA (proste), które oblicza fizyczną wartość momentu pędu dla każdej świecy (ponieważ jestem fizykiem) i teraz jest kilka ciekawych rzeczy:
1. Zasada zachowania pędu, czyli suma pędów jest stała w czasie. Należy pamiętać, że pęd jest wektorem.
2. Potrafię dostrzec świece, które mają bardzo wysoki moment pędu i zaznaczyć ich poziom oraz wg. dla mnie te poziomy są przynajmniej poziomami cieczy dostawcy lub dobrymi liniami S/D. Testując do UE, podzieliłem rozmiar pędu na trzy: bardzo duży, duży i średni. Możesz wyraźnie zobaczyć, które świece generują poziomy i jak cena zareaguje na nie w przyszłości. Według mnie możesz spróbować tutaj stworzyć strategię.
3. Zauważyłem, że ważne poziomy są wyznaczane przez świece, o których wizualnie nigdy bym nie podejrzewał, że generują ważny poziom.
4. Dodatkowo mogę sprawdzić dynamikę danej waluty w kilku odstępach czasu i zobaczyć, co się dzieje. Np. dla H1 patrz i handluj liniami S / D z D1.
5.i co najważniejsze, dziś się domyśliłem, teraz pracuję nad łapaniem świec o wysokim momencie obrotowym na kilku walutach, np. EU, UJ, GU itp. aby sprawdzić, czy są w jakiś sposób zsynchronizowane lub czy pieniądze w jakiś sposób płyną.
W komentarzach ciężko mówić :)
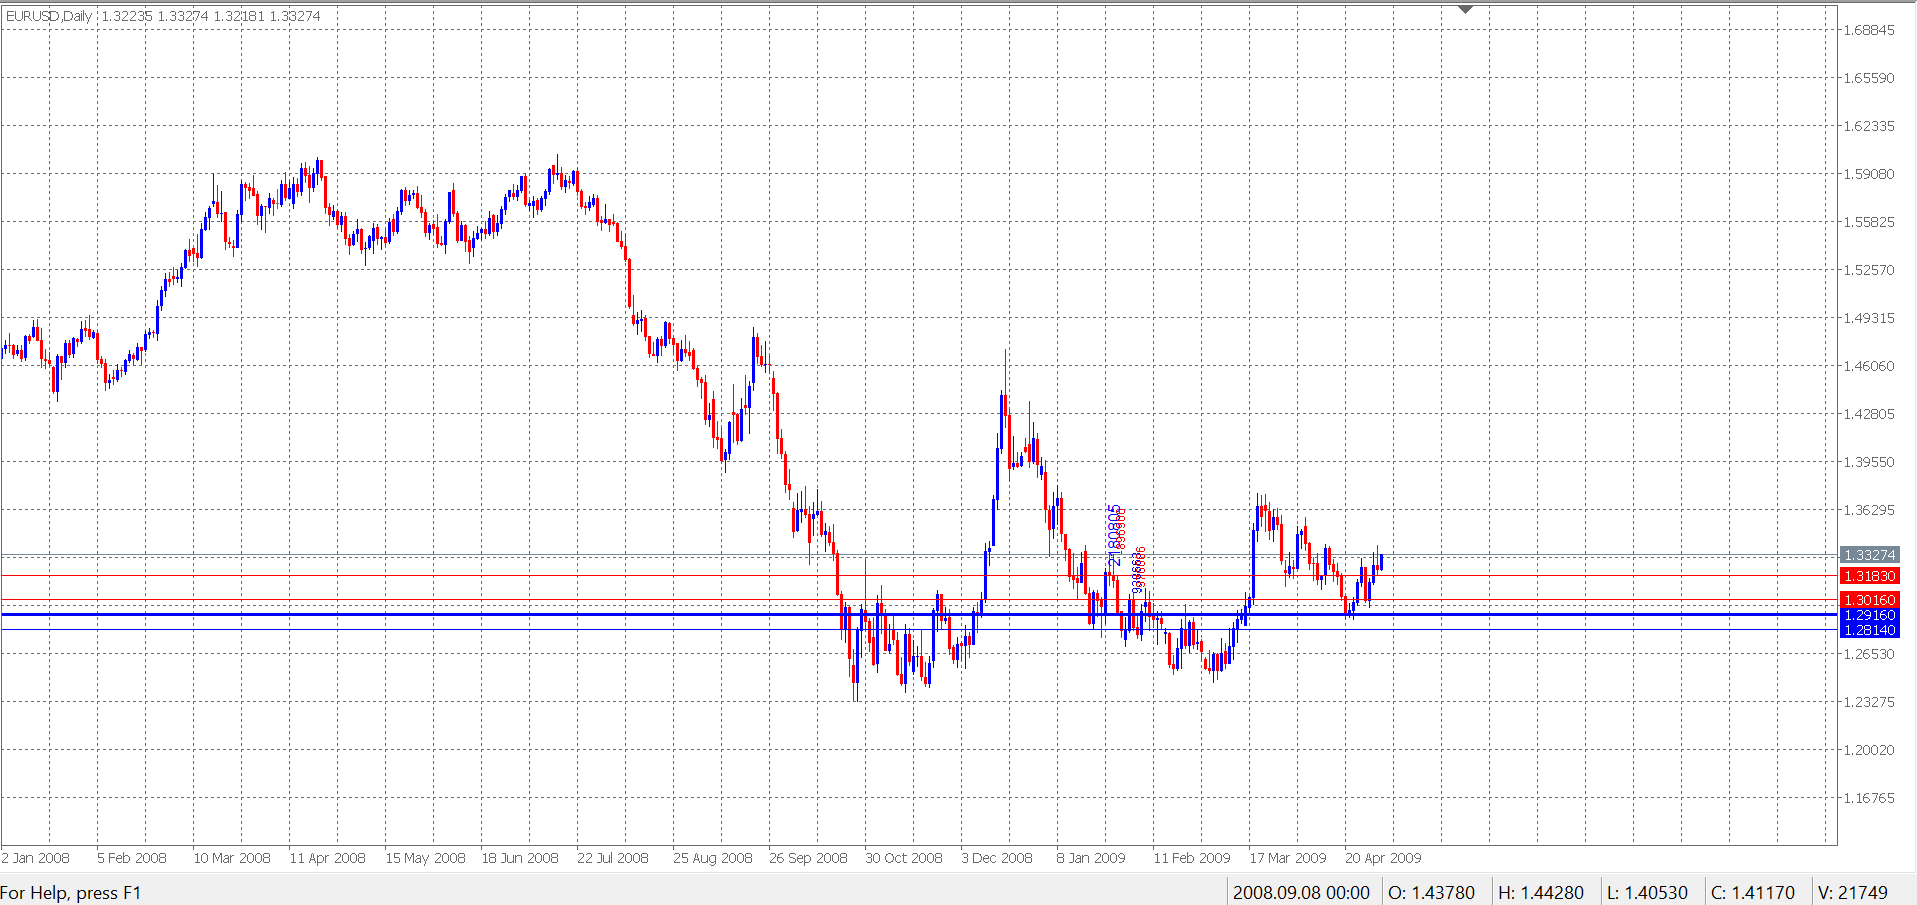
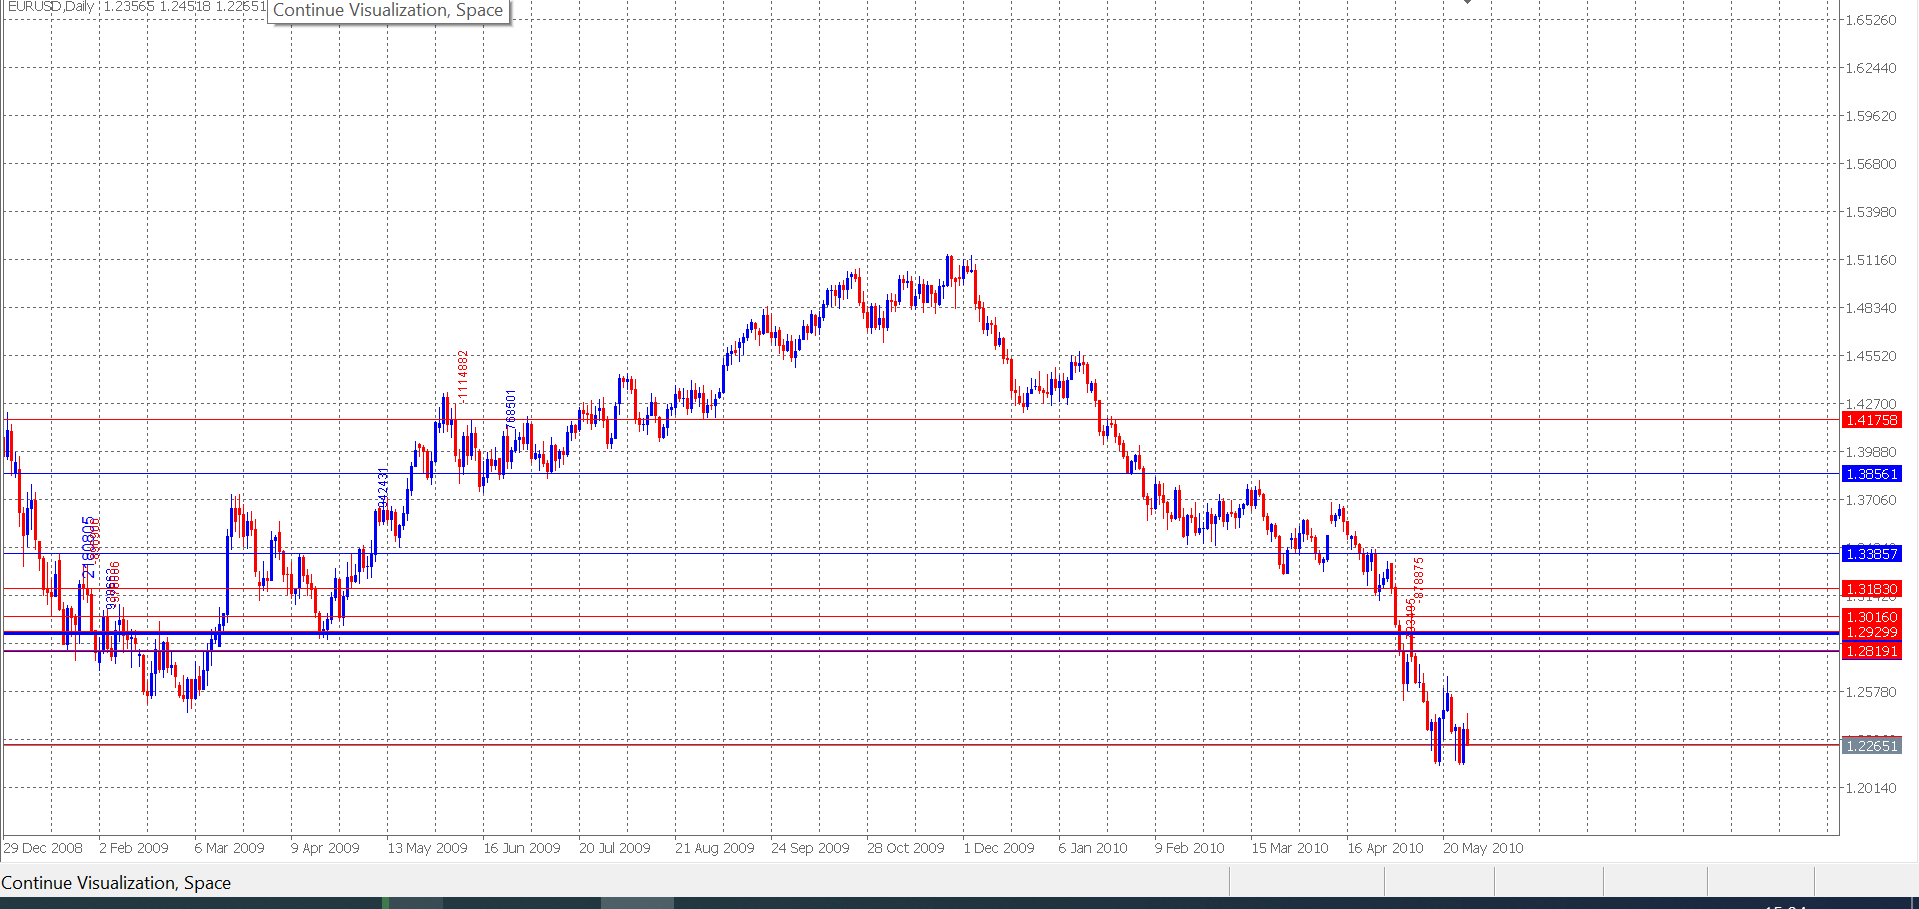
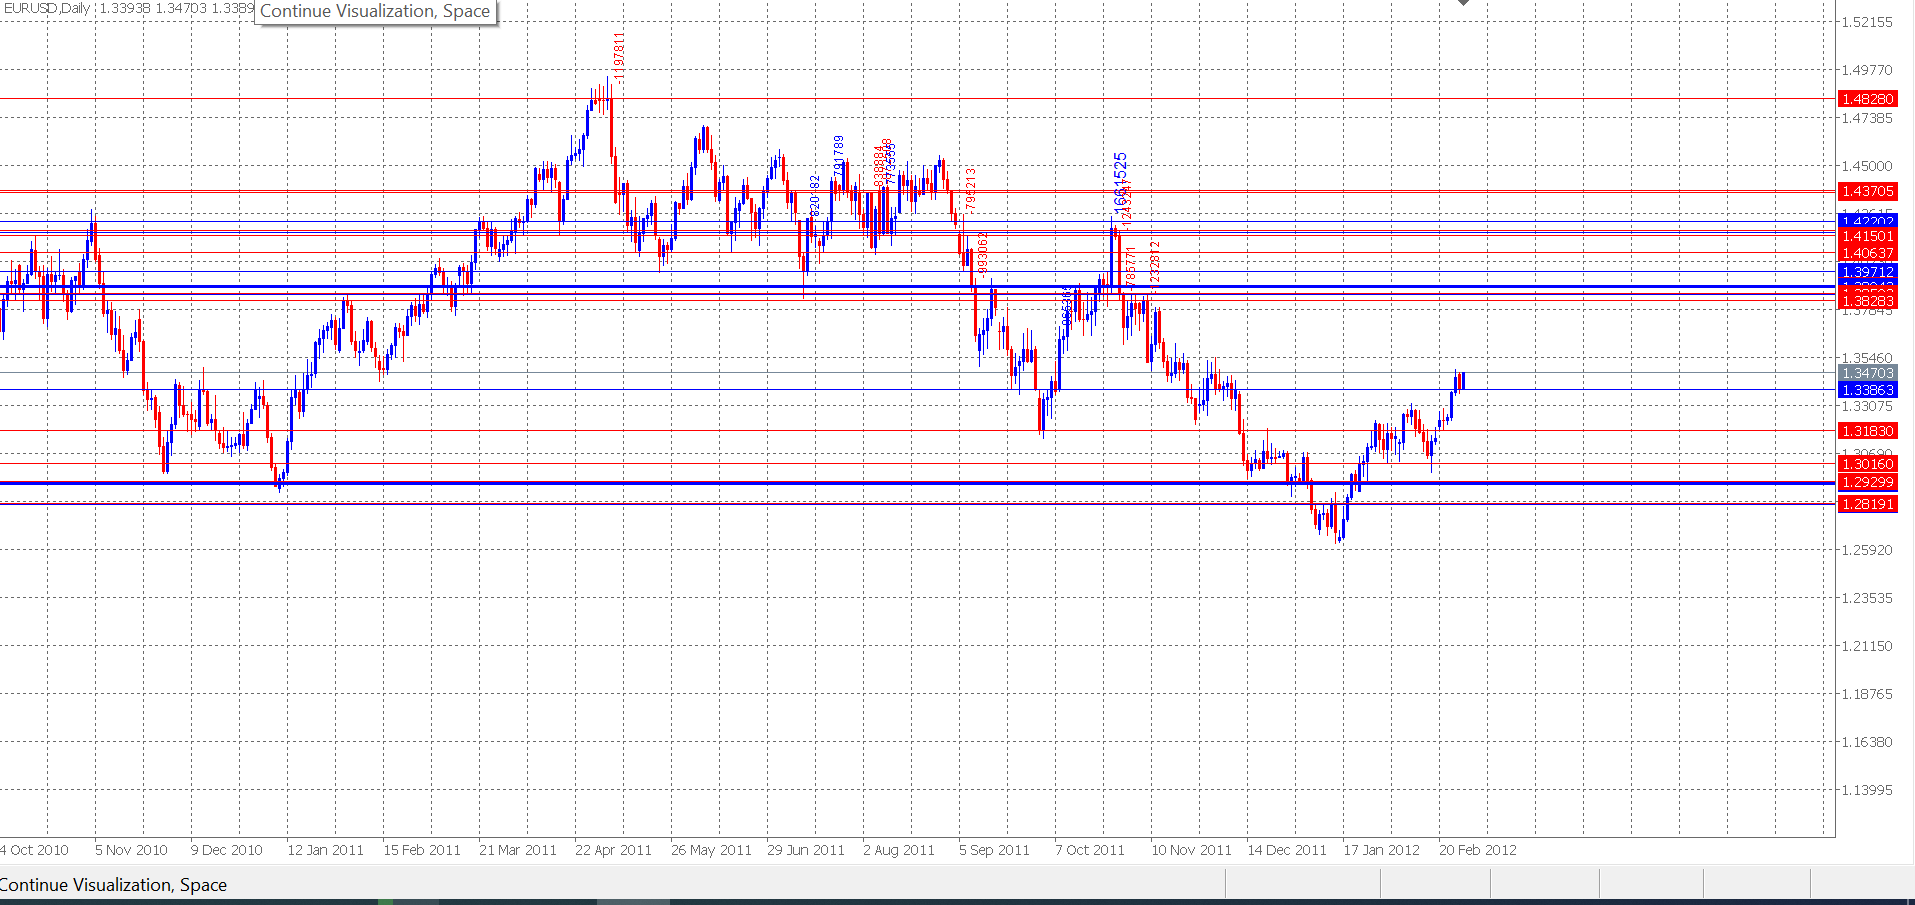
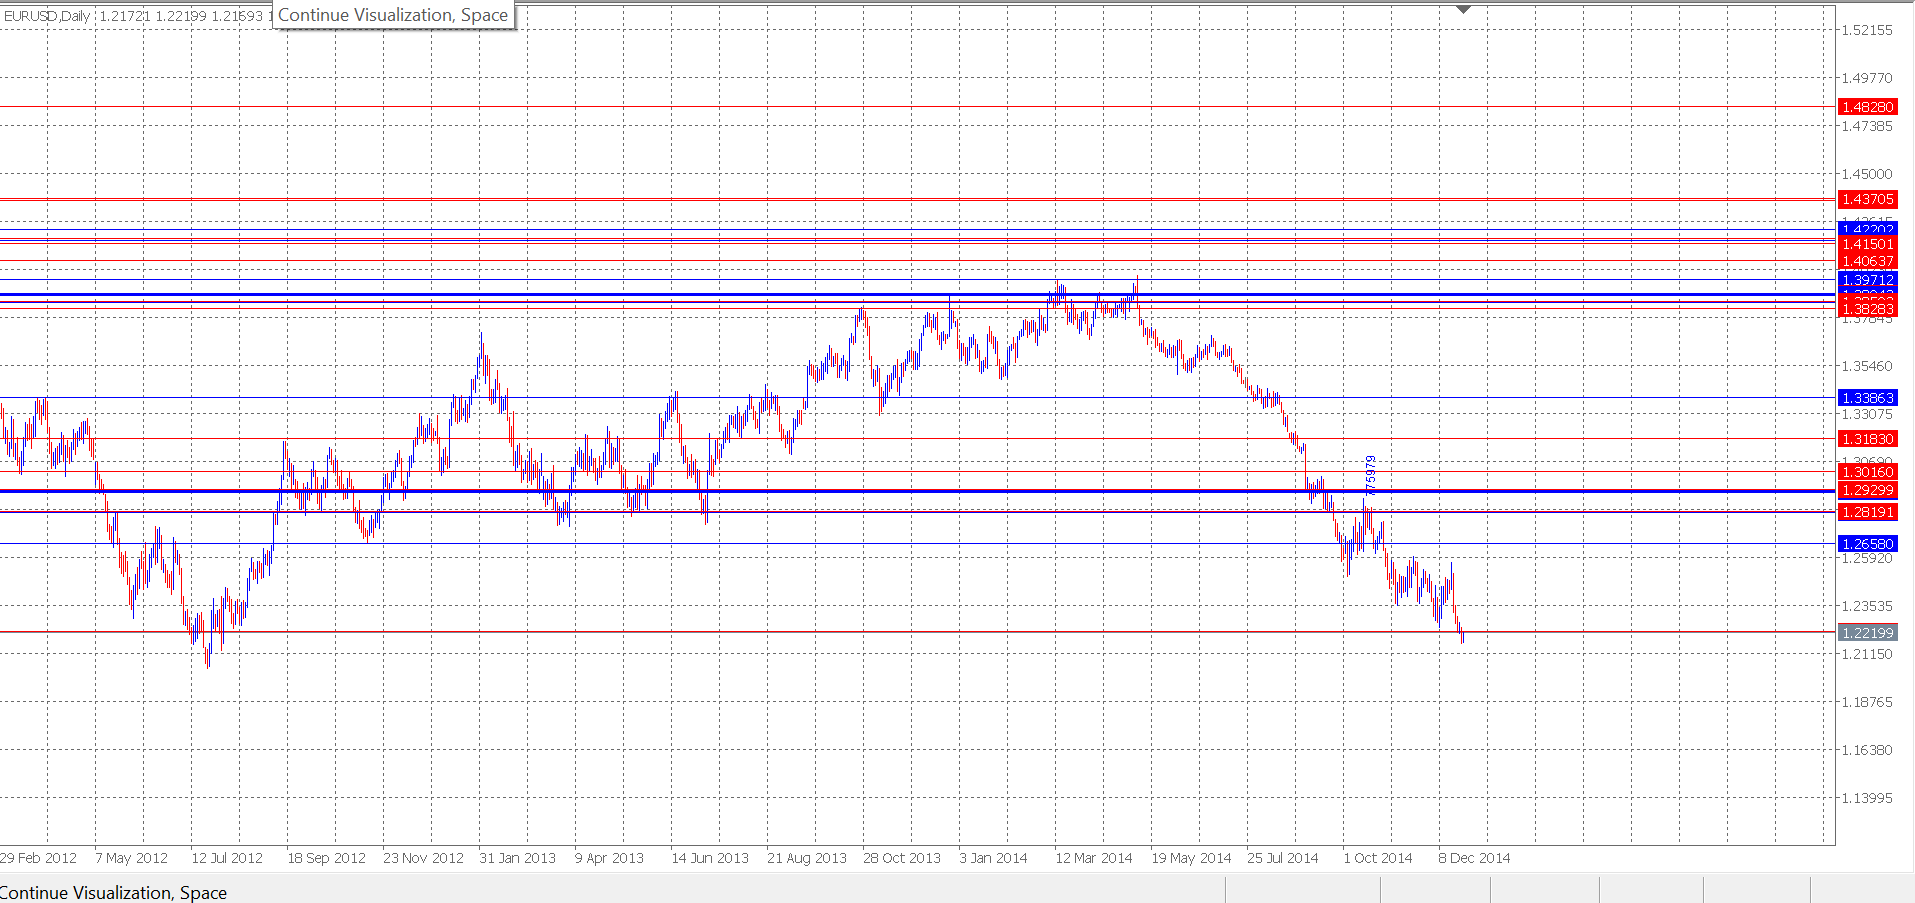
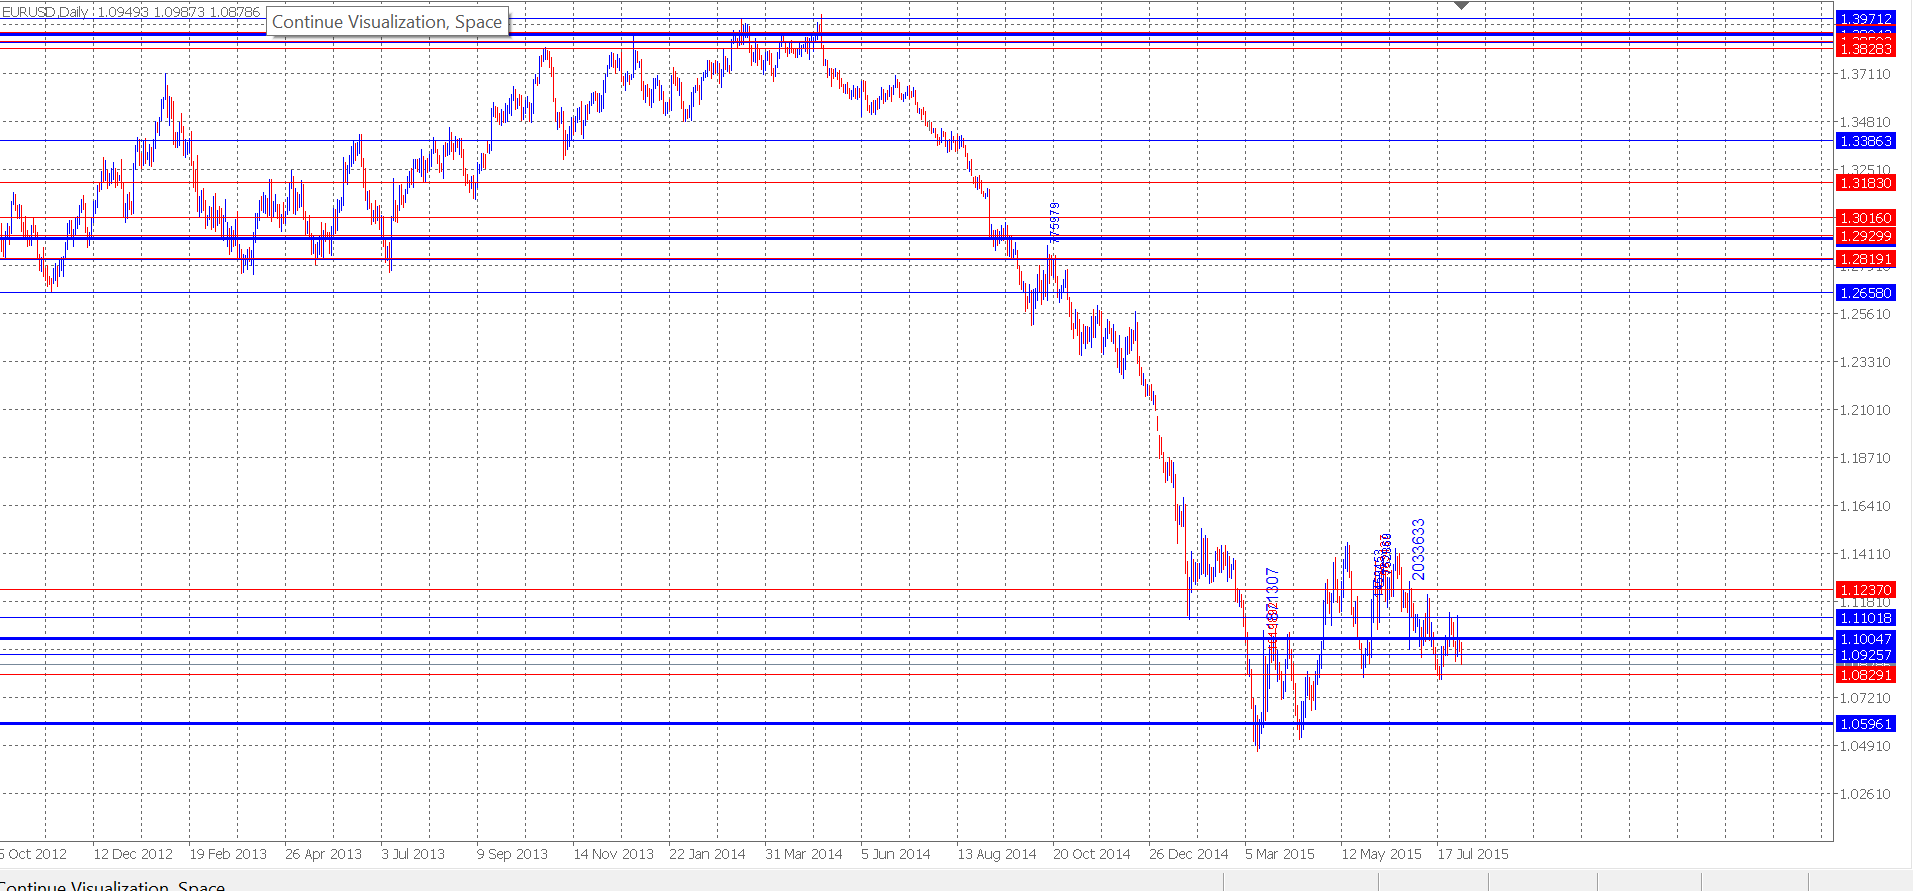
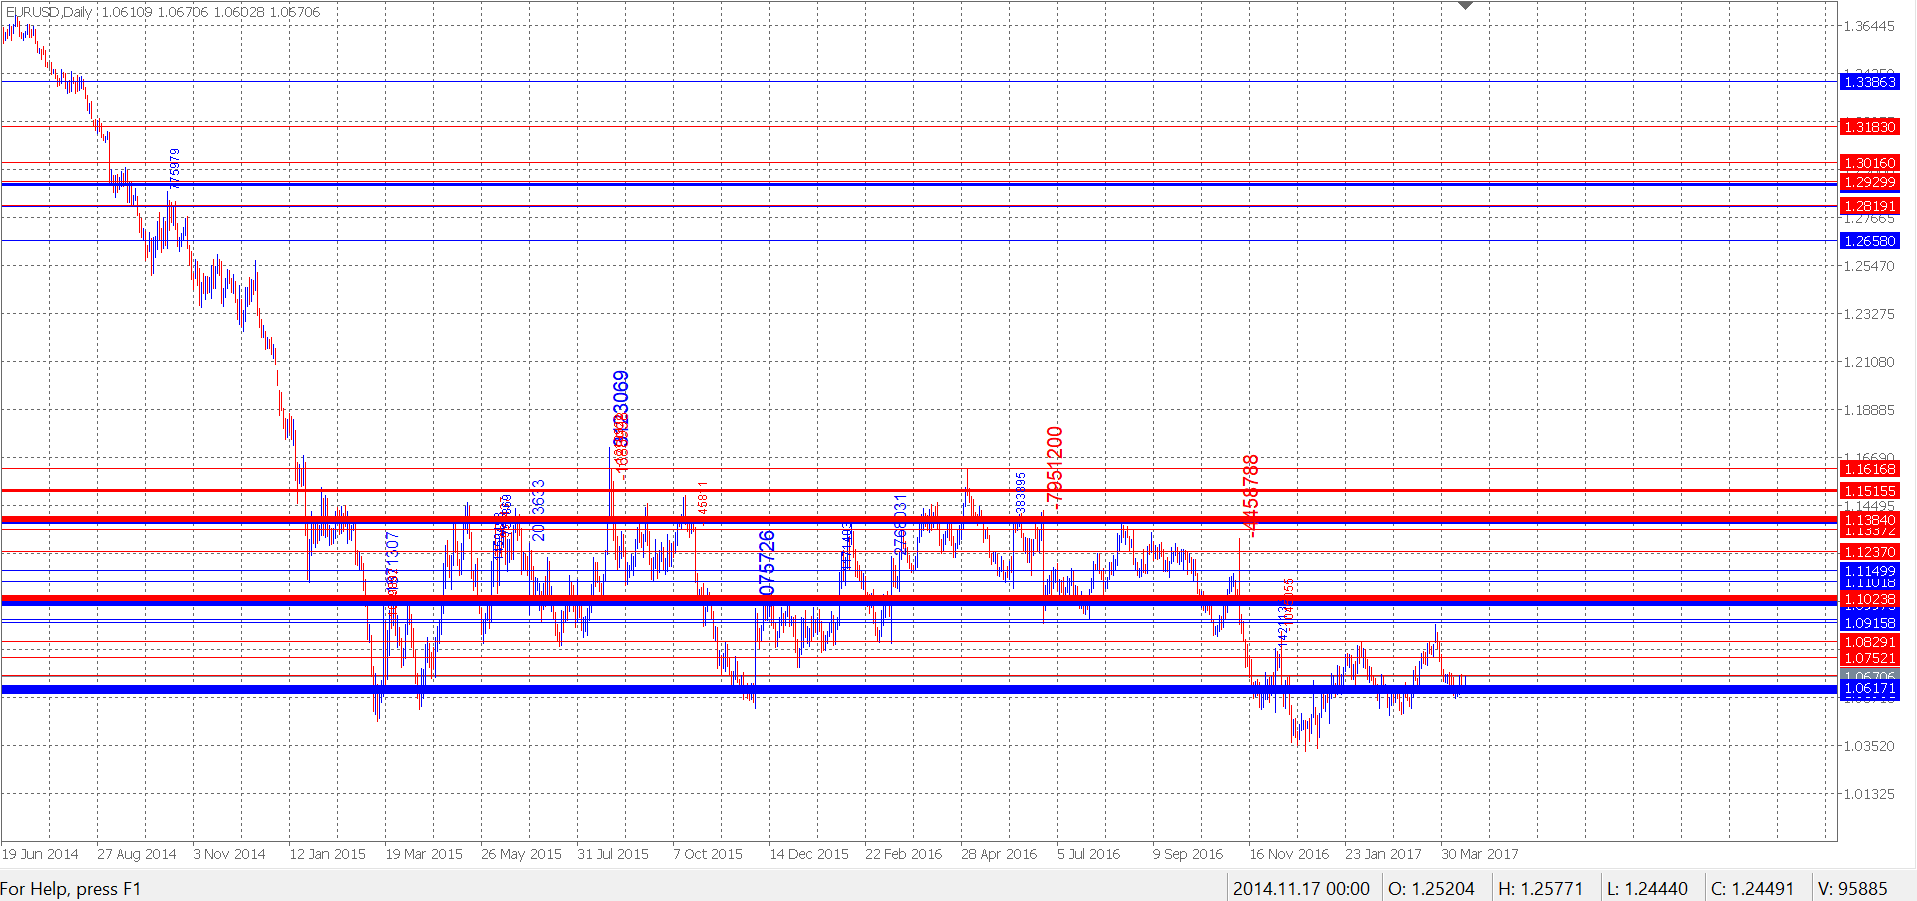
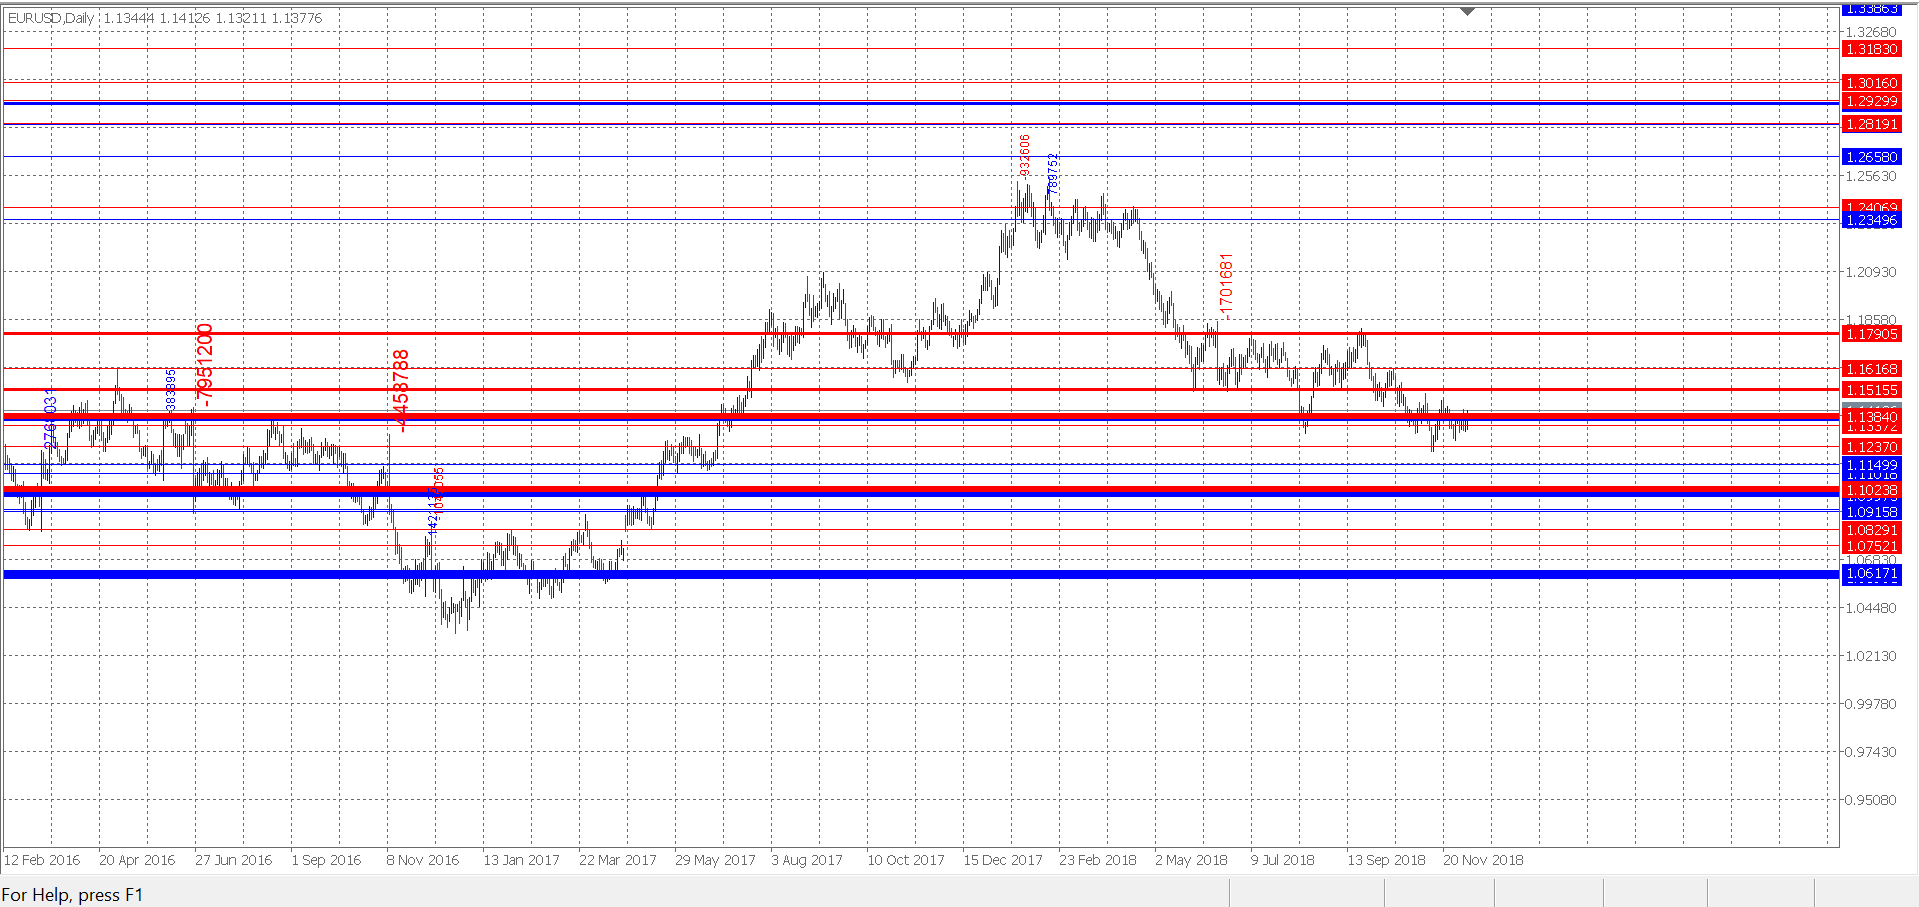
Załączam kilka zrzutów ekranu z generowania poziomów, poziomy pojawiają się na świecach, które mają etykietę z wartością momentu. Możesz zobaczyć poziom na żywo, kiedy nadchodzi wielki moment i jak cena zachowuje się w stosunku do niego później. Na przykład w latach 2015-2017 można zobaczyć piękną walkę niedźwiedzi z bykami.
I have been with forex for three years, I am a hobbyist looking for, I treat it as a good mind exercise and a puzzle :) but at the same time I believe that there is a metamodel :) although you have to remember that Forex is not our business, it is someone's business in which this someone has goal to earn money, our money :)
While testing simple EA models, I asked myself what was generating the price / current candlestick chart.
1. In the Order Book we see buy / sell offers (no market orders are visible there)
2. Offers have price and volume (aggregated)
3. The market buyer / seller comes and places the order on the market, and the deal is carried out with the closest price from the offers "order book" and price moves to this place.
If this is true, then in special cases the price may be changed
a) by a large distance with a small amount of volume, or
b) by a small distance with a very large amount.
I started to wonder because the only thing that drives the price is the incoming on-market orders that fulfill the pending offers.
Offers may wait, be changed, etc., but these changes in the price itself do not change, only an incoming and executed on-market order causes it.
... and we do not see the on-market order itself, we do not know when it will come, with what volume and at what price.
I drew an example of the price movement in excel
I do not know if I understand it well and I do not know if this quality can be used
.
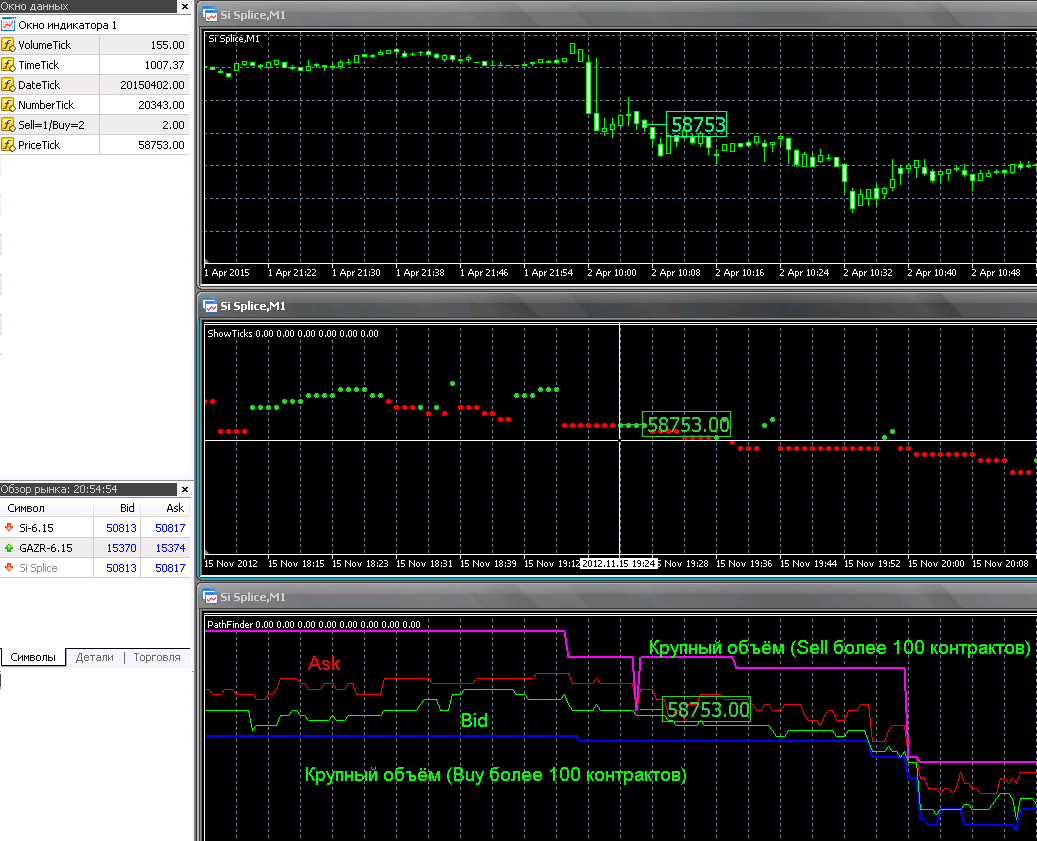
Иллюстрация написанного Вами, посмотрите, пожалуйста.
Новая статья Комбинаторика и теория вероятностей для трейдинга (часть III): Опубликована первая математическая модель:
Автор: Евгений Ильин
- Бесплатные приложения для трейдинга
- 8 000+ сигналов для копирования
- Экономические новости для анализа финансовых рынков
Вы принимаете политику сайта и условия использования
Опубликована статья Комбинаторика и теория вероятностей для трейдинга (Часть III): Первая математическая модель:
Закономерным продолжением темы стала потребность разработки многофункциональных математических моделей для задач трейдинга. В связи с этим в данной статье я буду описывать весь процесс разработки первой математической модели для описания фракталов с нуля. Данная модель должна стать важным кирпичиком и быть многофункциональной и универсальной, в том числе для того, чтобы нарастить теоретическую базу для дальнейшего развития ветки.
Если схематично изобразить как будет выглядеть принцип вложенности фракталов, то можно его изобразить вот так:
На данном рисунке четыре состояния, символизирующие разные фракталы, но которые могут быть выражены через друг друга. Переход от одного состояния к другому возможно с помощью любой цепи. Справа нарисована произвольно выбранная цепь, а чуть ниже показано, что эта цепь может быть сколь угодно большой длины и сложности, при этом можно проходить через одно и то же состояние неограниченное число раз. Все это означает, что формула для вычисления среднего количества шагов фрактала может быть представлена в качестве цепочки произведений, которые представляют собой уровни вложенности фракталов.
Автор: Evgeniy Ilin