Tekущая картина - кому интерессно...

 
                          Table 4   Global foreign exchange market turnover by currency pair1   Daily averages in April, in billions of US dollars and percentages   Currency pair 1998 2001 2004 2007 2010   Amount % Amount % Amount % Amount % Amount %                           USD/EUR . . 372 30 541 28 892 27 1 101 28   USD/DEM 309 20 . . . . . . . .   USD/FRF 60 4 . . . . . . . .   USD/XEU 17 1 . . . . . . . .   USD/OthEMS 178 12 . . . . . . . .   USD/JPY 292 19 250 20 328 17 438 13 568 14   USD/Oth 140 9 152 12 251 13 498 15 445 11   USD/GBP 122 8 129 10 259 13 384 12 360 9   USD/AUD 44 3 51 4 107 6 185 6 249 6   USD/CAD 52 3 54 4 77 4 126 4 182 5   USD/CHF 82 5 59 5 83 4 151 5 168 4   EUR/JPY . . 36 3 61 3 86 3 111 3   EUR/GBP . . 27 2 47 2 69 2 109 3   EUR/Oth . . 17 1 35 2 83 2 102 3   USD/HKD² 14 1 19 2 19 1 51 2 85 2   EUR/CHF . . 13 1 30 2 62 2 72 2   USD/KRW² 2 0 8 1 16 1 25 1 58 1   JPY/Oth 9 1 4 0 11 1 43 1 49 1   USD/SEK³ 3 0 6 0 7 0 57 2 45 1   USD/INR² 1 0 3 0 5 0 17 1 36 1   EUR/SEK³ . . 3 0 3 0 24 1 35 1   USD/CNY² 0 0 . . 1 0 9 0 31 1   USD/BRL² 3 0 5 0 3 0 5 0 26 1   USD/ZAR² 6 0 7 1 6 0 7 0 24 1   JPY/AUD² 1 0 1 0 3 0 6 0 24 1   EUR/CAD . . 1 0 2 0 7 0 14 0   EUR/AUD . . 1 0 4 0 9 0 12 0   JPY/NZD² 0 0 0 0 0 0 0 0 4 0   DEM/JPY 30 2 . . . . . . . .   DEM/GBP 36 2 . . . . . . . .   DEM/CHF 21 1 . . . . . . . .   DEM/FRF 10 1 . . . . . . . .   DEM/XEU 3 0 . . . . . . . .   DEM/OthEMS 37 2 . . . . . . . .   DEM/Oth 22 1 . . . . . . . .   OthEMS⁴ 4 0 . . . . . . . .   Other pairs 30 2 23 2 36 2 90 3 72 2   All currency pairs 1 527 100 1 239 100 1 934 100 3 324 100 3 981 100   1  Adjusted for local and cross-border inter-dealer double-counting (ie "net-net" basis).  2 Included as main currency pair from 2010. For more details on the set of currency pairs covered by the 2010 survey, see the statistical notes in Section IV. 3 Included as main currency pair from 2007.  4 OthEMS/OthEMS: the data cover local home currency trading only.   Источник: BIS                    
 

Sorentoспасибо за таблицу.Судя по ней - объемы основных пар растут, хотя процентное отношение пары в этой "корзине" примерно постоянно.

Подскажите, это что - Oth и OthEMS.

 
gss:

Sorentoспасибо за таблицу.Судя по ней - объемы основных пар растут, хотя процентное отношение пары в этой "корзине" примерно постоянно.

Подскажите, это что - Oth и OthEMS.

Другие... и другие в ЕС.

;)

 
прикрепляю файлик
Файлы:
rpfxf10b.zip  44 kb
 
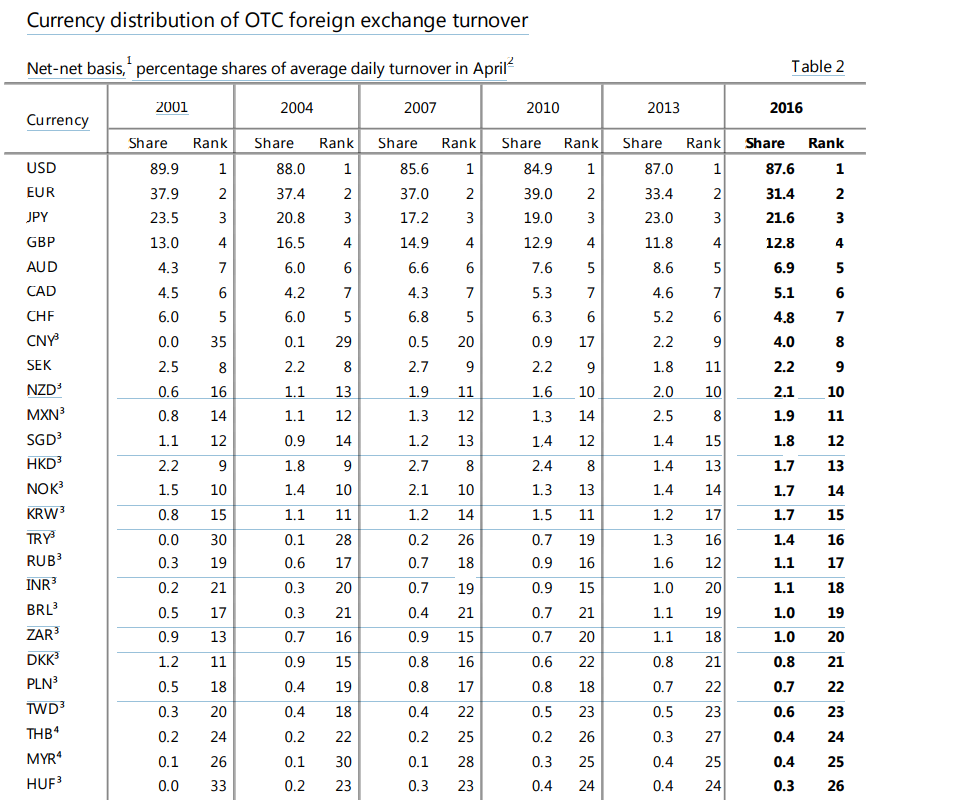
Triennial Central Bank Survey of foreign exchange and OTC derivatives markets in 2016
  • www.bis.org
Trading in foreign exchange (FX) markets averaged $5.1 trillion per day in April 2016, according to the 2016 Triennial Central Bank Survey of FX and over-the-counter (OTC) derivatives markets. This is down from $5.4 trillion in April 2013. FX spot trading declined for the first time since 2001, even as activity in FX derivatives continued to...
Причина обращения: