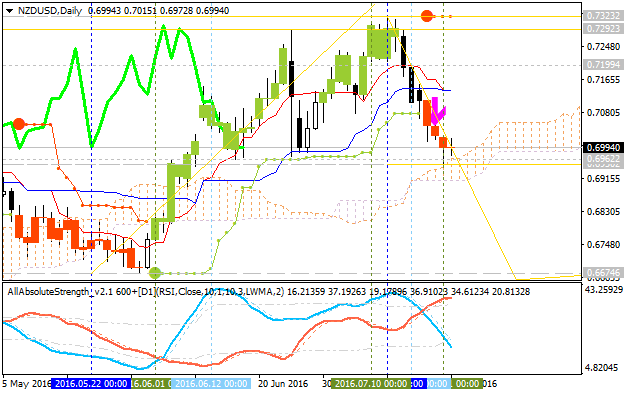
Next Week Forecast: the most interesting pair you can make money with - NZD/USD NZD/USD : breakdown with the bearish reversal . The pair is on secondary correction within the primary bullish condition
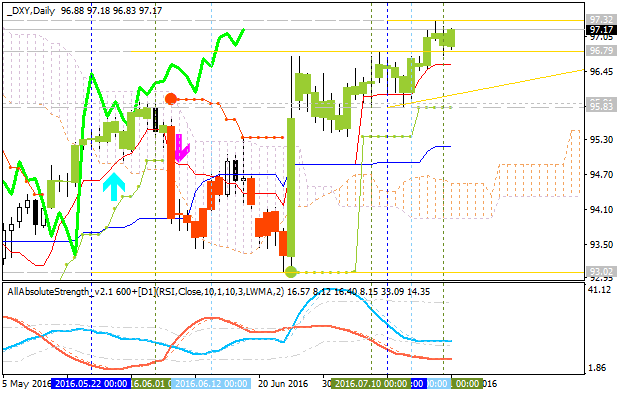
Dollar Index: End Of Week Technicals - Bullish To Continue or Correction To Be Started? This trading week ended with some dilemma: bullish trend to be continuing in case the price breaks 97.32
Forum on trading, automated trading systems and testing trading strategies Press review Sergey Golubev , 2016.07.22 11:44 Trading News Events: Canada Consumer Price Index (adapted from the article )
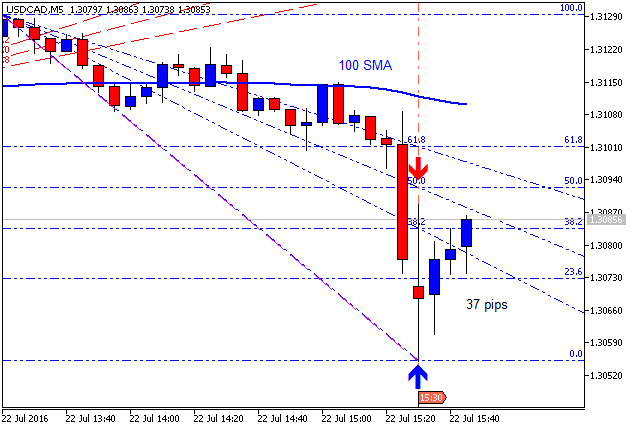
Trading News Events: Canada Consumer Price Index (adapted from the article ) 2016-07-22 12:30 GMT | [CAD - CPI core] past data is 0.3%, forecast data is 0.0%, actual data is 0.0% according to the
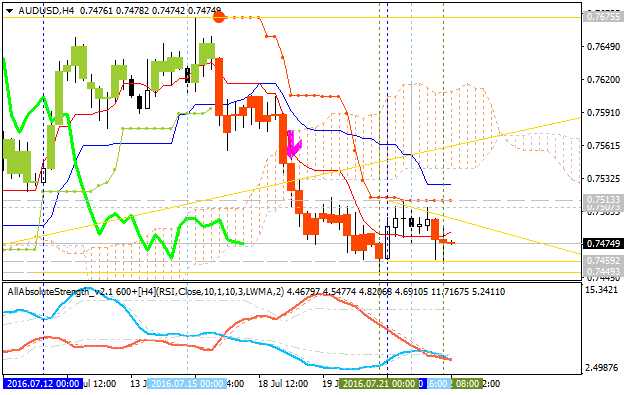
Technical Targets for AUD/USD by United Overseas Bank (based on the article ) H4 price is below Ichimoku for the bearish market condition with the ranging within the following key narrow s/r levels
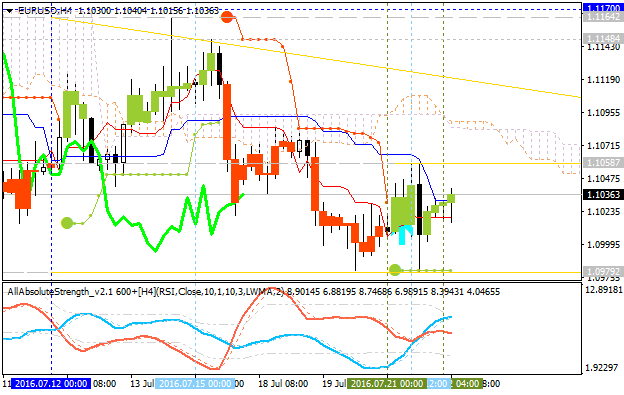
Technical Targets for EUR/USD by United Overseas Bank (based on the article ) H4 price is located below Ichimoku in the primary bearish area of the chart: price is on ranging within the following
AUD/USD Intra-Day Technical Analysis - bearish ranging within narrow levels (adapted from the article ) H1 price is located below 100 SMA/200 SMA reversal in the primary bearish area of the chart. The
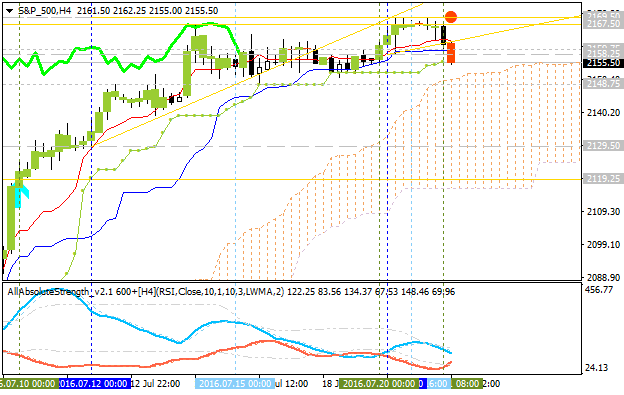
S&P 500 Intra-Day Technical Analysis - daily correction to be started H4 price is located above Ichimoku cloud in the bullish area of the chart. The price was bounced from 2169.50 resistance level to
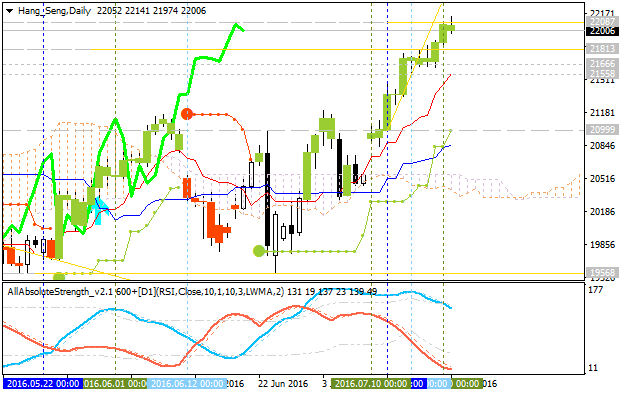
Hang Seng Index (HSI) Technical Analysis: new daily resistance on the way to the bullish continuation Daily price is continuing with the primary bullish trend with new 'top' to be formed for the
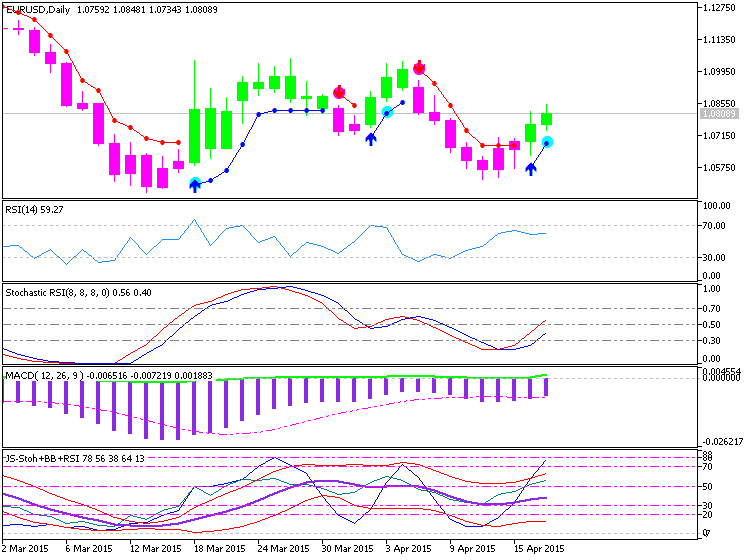
Introduction to Technical Indicators - Trend Following: Moving Averages, Ichimoku, ADX (based on the article ) Trend following indicators were created to help traders trade currency pairs that are
Introduction to Technical Indicators - Oscillators: RSI, Stochastics, CCI, MACD (based on the article ) Oscillators give traders an idea of how momentum is developing on a specific currency pair. When
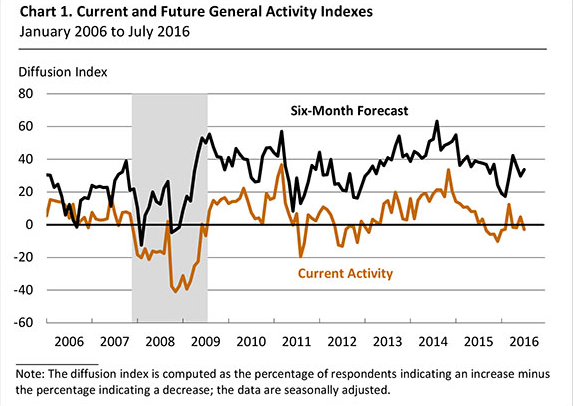
EUR/USD Intra-Day Fundamentals: Philadelphia Fed Business Outlook Survey and and 42 pips price movement 2016-07-21 12:30 GMT | [USD - Philly Fed Manufacturing Index] past data is 4.7, forecast data is
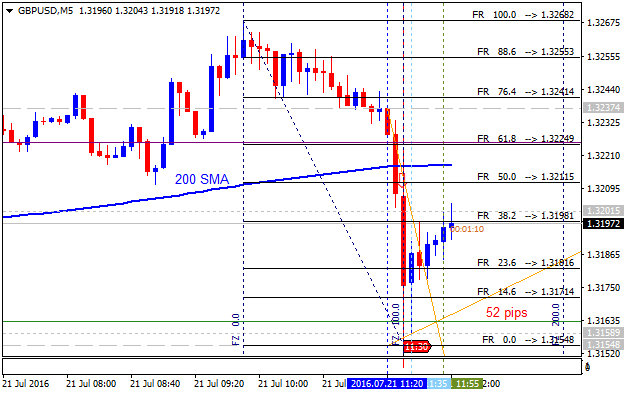
Forum on trading, automated trading systems and testing trading strategies Press review Sergey Golubev , 2016.07.21 11:11 GBP/USD Intra-Day Fundamentals: U.K. Retail Sales and and 52 pips price
Trading News Events: European Central Bank (ECB) Interest Rate Decision (adapted from the article ) 2016-07-21 11:45 GMT | [EUR - Minimum Bid Rate] past data is 0.00%, forecast data is 0.00%, actual
U.S. Commercial Crude Oil Inventories news event: bullish ranging above bearish reversal 2016-07-20 14:30 GMT | [USD - Crude Oil Inventories] past data is -2.5M, forecast data is -1.3M, actual data is
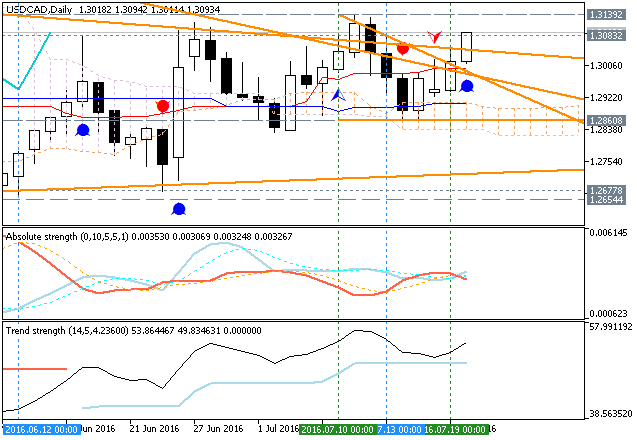
USD/CAD Technical Analysis - intra-day bullish breakout, daily bullish trend to be resumed, weekly possible bullish reversal Daily price is on bullish condition to be above Ichimoku cloud with the
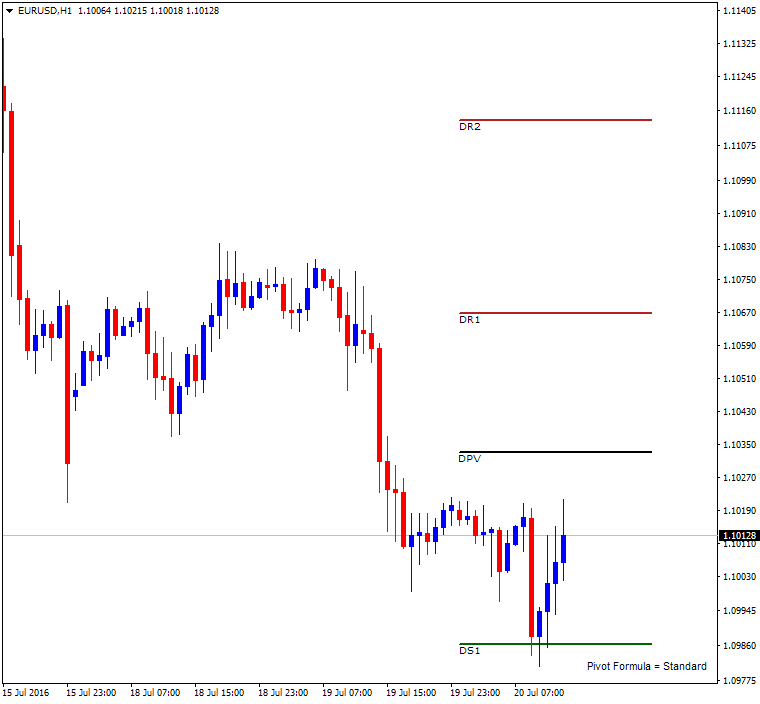
Interesting indicator was found in CodeBase: iPivot - indicator for MetaTrader 4 Yet another Pivot Point indicator but it's a bit different. Choose your preferred pivot formulas: Standard, Fibonacci