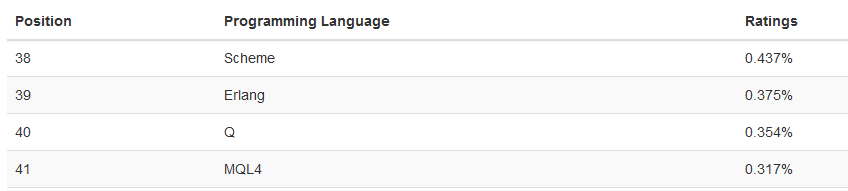
Это в дополнение к тому, что MQL4(и MQL5 - они оба слиты в один язык организаторами рейтинга) поднялся на 41 место в мировом рейтинге языков программирования TIOBE: http://www.tiobe.com/tiobe-index/
The U.S. Energy Information Administration’s Forecasts: $51 Per Barrel in 2017 (adapted from the article) Daily price is located within 100-day SMA/200-day SMA ranging area of the chart: the price is
The Economic Indicator Handbook: How to Evaluate Economic Trends to Maximize Profits and Minimize Losses by Richard Yamarone The Economic Indicator Handbook: How to Evaluate Economic Trends to
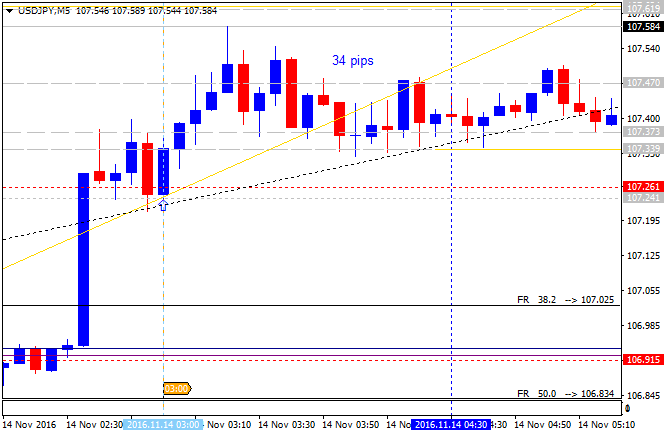
USD/JPY Intra-Day Fundamentals: BOJ Gov Kuroda Speaks and 34 pips range price movement 2016-11-14 01:00 GMT | [JPY - BOJ Gov Kuroda Speaks] past data is n/a, forecast data is n/a, actual data is n/a
Just some tools: Time, Forex sessions and Trade Hours monitor - indicator for MetaTrader 4 Indicator shows a different Forex sessions, market hours of the exchanges and user defined time lines
Fibonacci Analysis by Constance Brown Only someone who is both a successful trader and a successful writer could pull off what Constance Brown has accomplished in this book: distilling Fibonacci
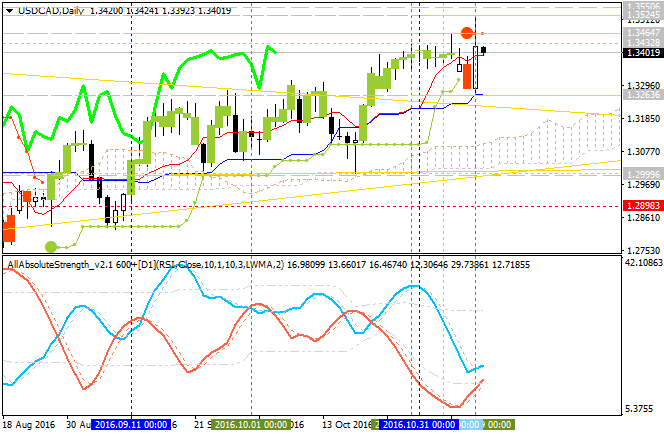
Daily price is above Ichimoku cloud in the bullish area of the chart. The price is on bullish breakout which was started in the beginning of the last week with 1.3524 resistance level to be tested above for 1.3551 bullish target to re-enter for the
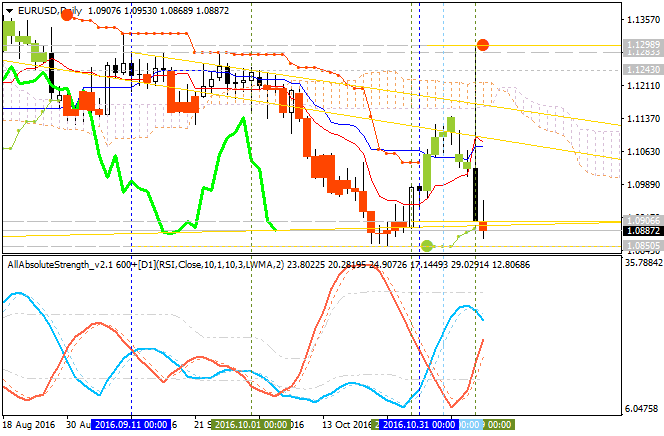
Daily price is on bearish breakout by 1.0850 support level to be testing to below for the bearish trend to be continuing with 1.0821 nearest target to re-enter. Chinkou Span line of Ichimoku indicator is located below the price indicating the bearish
Weekly Outlook: 2016, November 13 - November 20 (based on the article ) GDP data from Japan and Germany, Mario Draghi’s speech, Inflation figure from the UK and the US, Employment data from the UK
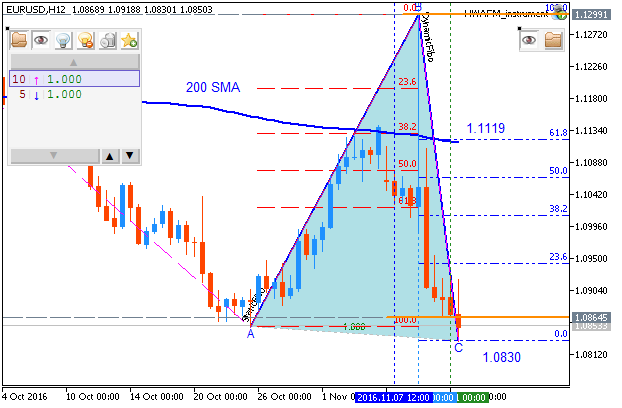
Weekly EUR/USD Outlook: 2016, November 13 - November 20 (based on the article ) EUR/USD had a volatile week around the US elections and eventually closed lower. Speeches by Draghi, inflation, and GDP
Financial Modeling of the Equity Market: From CAPM to Cointegration By Frank J. Fabozzi Financial Modeling of the Equity Market is the most comprehensive, up-to-date guide to modeling equity
The Butterfly Effect in Competitive Markets: Driving Small Changes for Large Differences by Rajagopal The discussion in this book provides a comprehensive introduction to the concept of market
Художник-иллюстратор Татьяна Никитина Старший преподаватель кафедры иллюстрации Московского государственного университета печати. Член Московского Союза Художников с 1994 года. Диплом всероссийского
Forum on trading, automated trading systems and testing trading strategies Press review Sergey Golubev , 2016.11.11 13:03 Trading News Events: University of Michigan Consumer Sentiment (adapted from
Trading News Events: University of Michigan Consumer Sentiment (adapted from dailyfx ) " A rebound in the U. of Michigan Confidence survey may spark a bullish reaction in the U.S. dollar and fuel the
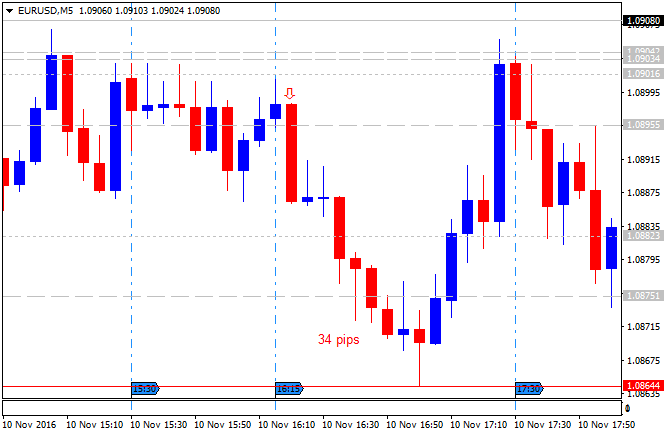
EUR/USD Intra-Day Fundamentals: FOMC Member Bullard Speaks and 34 pips price movement 2016-11-10 14:15 GMT | [USD - FOMC Member Bullard Speaks] past data is n/a, forecast data is n/a, actual data is
US Dollar Index Daily Technicals: ranging bullish (based on the article ) " Charts don’t predict. Rather, the interpretation of trend and identification of price levels aid in tactics. The most recent
There is some very popular type of trading: price crossing indicator's line. So, the following indicator may be used for this kind of trading: Swing line - extended version - indicator for MetaTrader
Trump Wins: EUR/USD A 'Confusing Story' - What's Next? - SocGen (based on the article ) Daily price is located below Ichimoku cliud and below Senkou Span line which is the virtual border between the
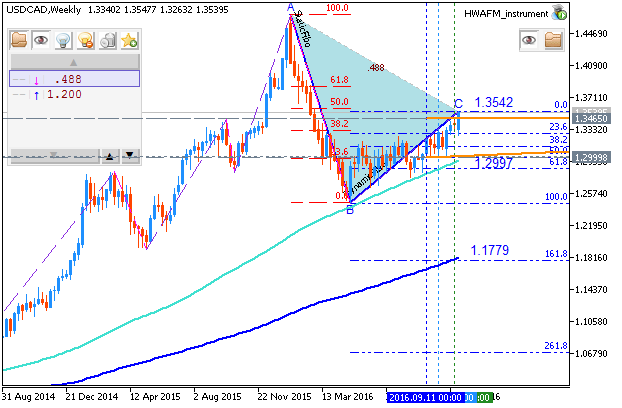
USD/CAD Technical Analysis: bullish reanging for the bullish continuation or to the correction to be started (based on the article ) The daily price is located above Ichimoku cloud in the bullish area