Termos de Referência
The EA is a robot based mostly on false break outs & bounces of trend lines ( next just TLs)
The first step is to choose if the EA will be done in MQL4 or MQL5 . In the robot will use just one indicator -ATR - Average True Range, mostly from 10 bars (number in bracket) and that could be count like this: Add High – Low values of last 10 bars and then divide by 10.
Because my English is not the best, for better understanding, all logical part are marked with numbers, letters,… , plus every important part has a picture or more with text too.
The job has more than 1 part and in one of following part it will include a testing too. Every next part will just add more features, that will be just tuned the ATS for better profits.
(This section on the beginning of the 1st part of the job, not have to be finished now, it is informative, but take it to account, it will need to be done later and if you can do it, you can choose when will you do it.)
Setting a feature option for a chat window using EA.
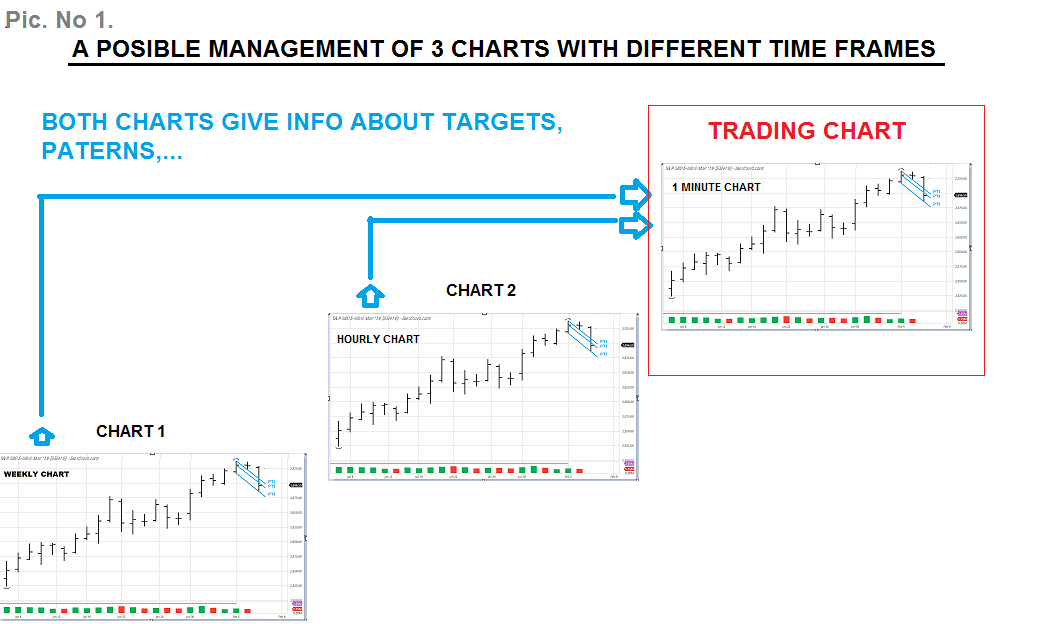
The trading system can be used for any time frame but the cooperation of more time frames do the biggest profits. In the final version, there will be 4 or 5 different time frame charts. So, there will be very helpful, if each “new time frame chart window” will have these options features before opening it: a) time frame, b) how many bars to use for displaying a trend lines, c) option to allowed to generate a trades on the particular chart - this means “Yes” or “Not” function - ☑. The additional charts will pass information about lines, patterns & turning levels (possible profit targets) to main trading chart/-s. ( See pic 1.)
So here starts 1st part of the job.
Here is a content of the 1st part of the job:
1.) Different types of trend lines
2.) Creating trend lines
3.) Different layouts ofTLs
1. DIFFERENT TYPES OF TREND LINES (next just TLs)
For now we use 2 different types of TLs :
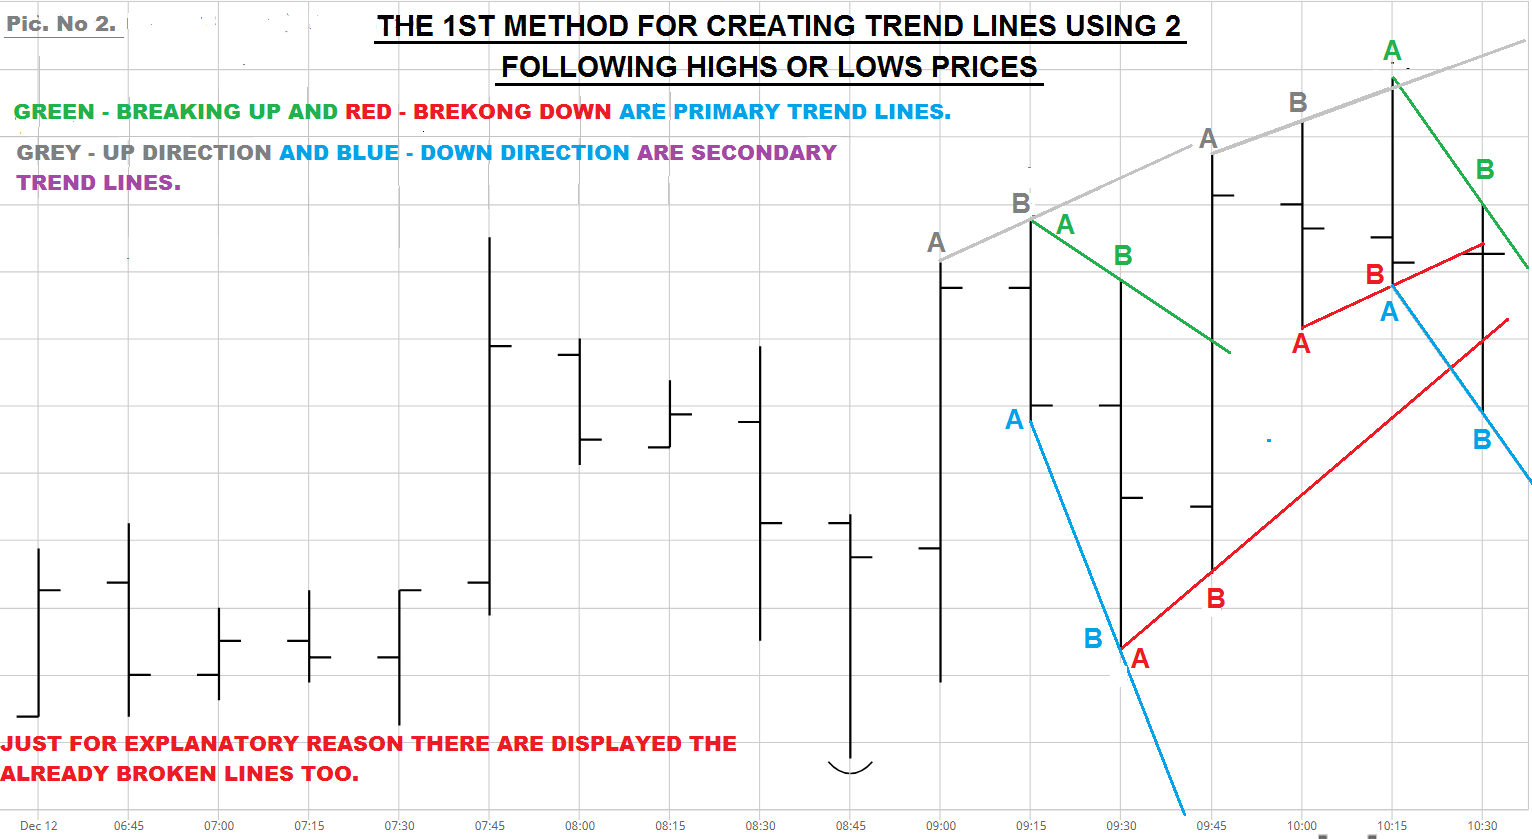
a) The Primary TLs. These are the lines what symbolize a trend and they are mostly used for breaking by price - as a trade Entry. For Uptrend are used Lows and for Downtrend are used Highs,
b) the Secondary TLs. The second most used type of TLs and they are opposite to previous, also called Channel TLs because they can create channels. But we do not use channels. The "secondary TLs" use High prices for Uptrend and Low prices for Downtrend. Any break out of these TLs are not directly used as an Entry to trade but they do a Bounces and patterns (both examples - Primary & Secondary TLs - see pic 2 in 2nd chapter.
2. CREATING TREND LINES
For creating a TL we need minimum 2 points. Here are the first 2 methods and both of them can be used for Primary and Secondary TLs.
I.) Using the last two Highs or Lows
The 1st simplest and most used way for creating TLs just takes actual “last two” Highs or Lows. These points are named “A” and “B”. (See pic 2.)
If any following bar @) :
a) has done just exact touch of the TL and not break it, then the TL just continues,
b) did break out of TL and then price moved “back” behind TL. If the original old TL what was ones broken – stop display it, we have the new 2nd creating point for new TL.
c) did not touch the TL and price first coms close to a TL and then return to the Open of the particular bar, we have a new second point for new TL and the second point of the previous TL is now the new starting point of the new TL – we have the Gradation of TLs. Both, the original & new TLs are now displaying.
II.) Using the fractals
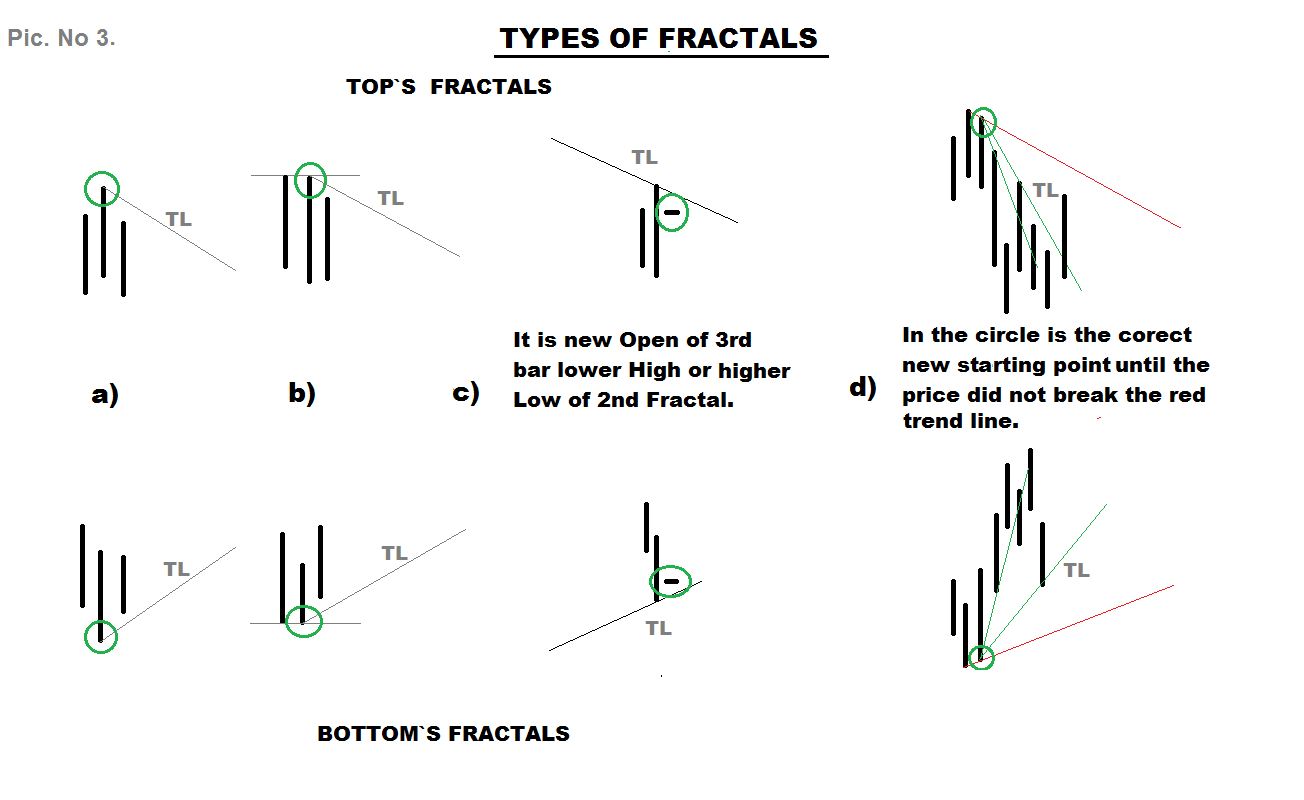
The second way of creating a TLs use a wrong named Fractals. For better understanding the first creating point is “1st fractal” and the second creating point is “2nd fractal.” All following types of fractals are on picture No 3 and it can say more than following text below.
So, a fractal could be:
a) one higher High between two lower Highs, or the opposite - one Lower Low between 2 higher Lows,
b) the last “same High or Low bars prices” of double, triple,… Top or Bottom. Means, when there occur instead “one” higher High or lower Low a multiple bars with the same prices and they are close to each other. Then the last & same High or Low will be the 1st starting point of a TL,
c) for Adjusting of TLs, it is about the “2nd (or any following) fractal-like”creating point of a TL and when 1st fractal is as lower Low (Bottom). The second fractal is as two bars where 1stbars higher Low + 2ndbars lower Low and when the 3rd bar has just “ the Open higher than Low of the middle bar”, we have a new line with 2ndfractal. The price of the 3rd bar of the 2nd fractal could be a breaking out bar of a TL, it means the TL could be broken in less than 1 min. at 1 min. time frame.
And the all is valid for the opposite way – a Top with Highs. There is not a condition that 1st fractal must be seen on a chart, see the general rules for displaying TLs.
d) it is for any reversal fractal and the example is about a Bottom-like, it actually combines 1stmethod of creating TLs. In the case that "the Low price of the 3rd" bar of a fractal is too close to the Low price of previous, middle bar and the Low price of following bars (4rd,...) is too far from Lows prices of the last two bars, "use as 1st creating point “the Low price of 3rd bar" until the price did not reach the TL – colored in red, created from Lows of middle bar and 3rd bar of the fractal. After the price touch this TL, use the middle bar Low price as a normal Fractal starting point of a TLs.
The same is valid for a Top-like fractal – made from Highs.
And when the price of the following bar (3rd) after middle bar(2nd) of any fractal, didn’t reach the TL, follow the points " a) and b) " from the previous ( 1st) method for creating TL - article I.) above, marked with @.
3. DIFFERENT LAYOUTS OF TREND LINES
This is not any kind of price action patterns, it is just about layouts and it could generate trades. It can call Branching and there are 2 types and both of them can be used for the primary and secondary TLs too:
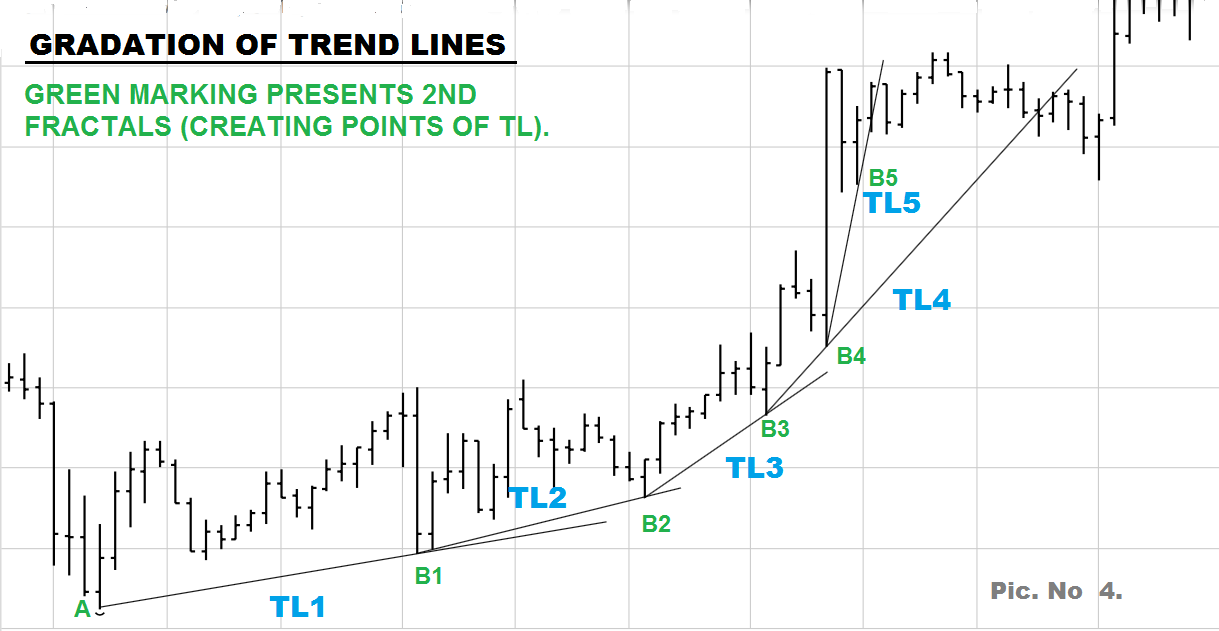
a) Gradation of TLs (see pic. 3) it occurs when new - minimum 2nd or any following fractal or creating point has a steeper position than the previous fractal. So, every 2nd or any following fractal (or creating point) of one TL, can be a 1st fractal of new TL and so on.
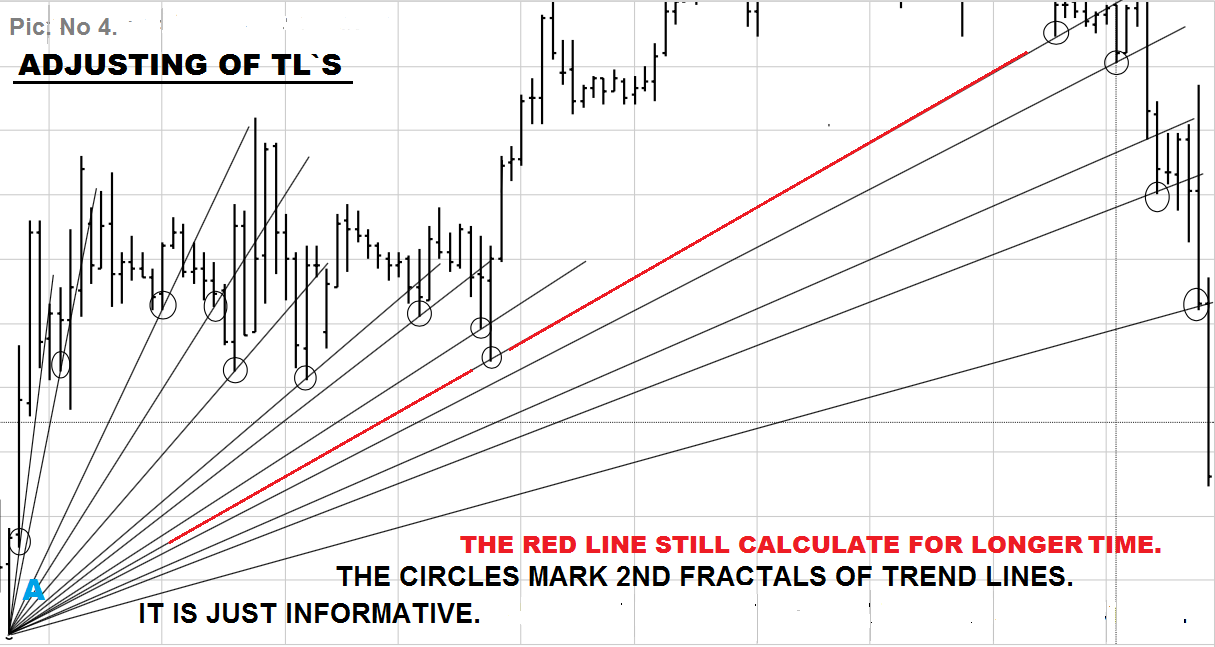
b) Adjusting of TLs, it mostly occurs in a far future, when a trend stopped and the price goes opposite to old trend and it generates a trades one by one.
On smaller time frames 1 min, 10 min,.. for an Adjusting of TLs the 1st fractal don’t need to see on the chart. The rule is explained in the last chapter.