Trabalho concluído
Termos de Referência
ON an existing indicator mql4 which display actually 9 group line currency ( AUD,CAD<CHF, ...., XAU) a STRETCH which display the lines depending on the width of the chart and not on the number of value ( display line value of 10 candles on chart of 20 candles)t function to an existing RSI currency strength indicator
=================================Please answer only if you already know how to do it and be able to show me before the agreement : Thank YOU ====================================
=====================The MAIN FUNCTION is to ADD the STRETCH on the actual indicator who already display the 9 lines group currency (line 1 for AUD, line 2 for CAD, line 3 for ....., line 9 for XAU or an other group)
Actually the indicator do not Strech the line means a parameter number of period is the actual display of each lines
( period = 10 means only 10 candles are displayed from current candle to 9 more back BUT beginning from the middle of the subwindow:
- for param price the lines begin from 0 level until current candle for the number of period we wish to see
- for param RSI the lines begin from 50 level until current candle for the number of period we wish to see
identical for the third computational mode ADX
This way is the mode STRECH false
When STRETCH true then the display will Strech the N periods of the parameter period on the full wide of the chart -1
Example :
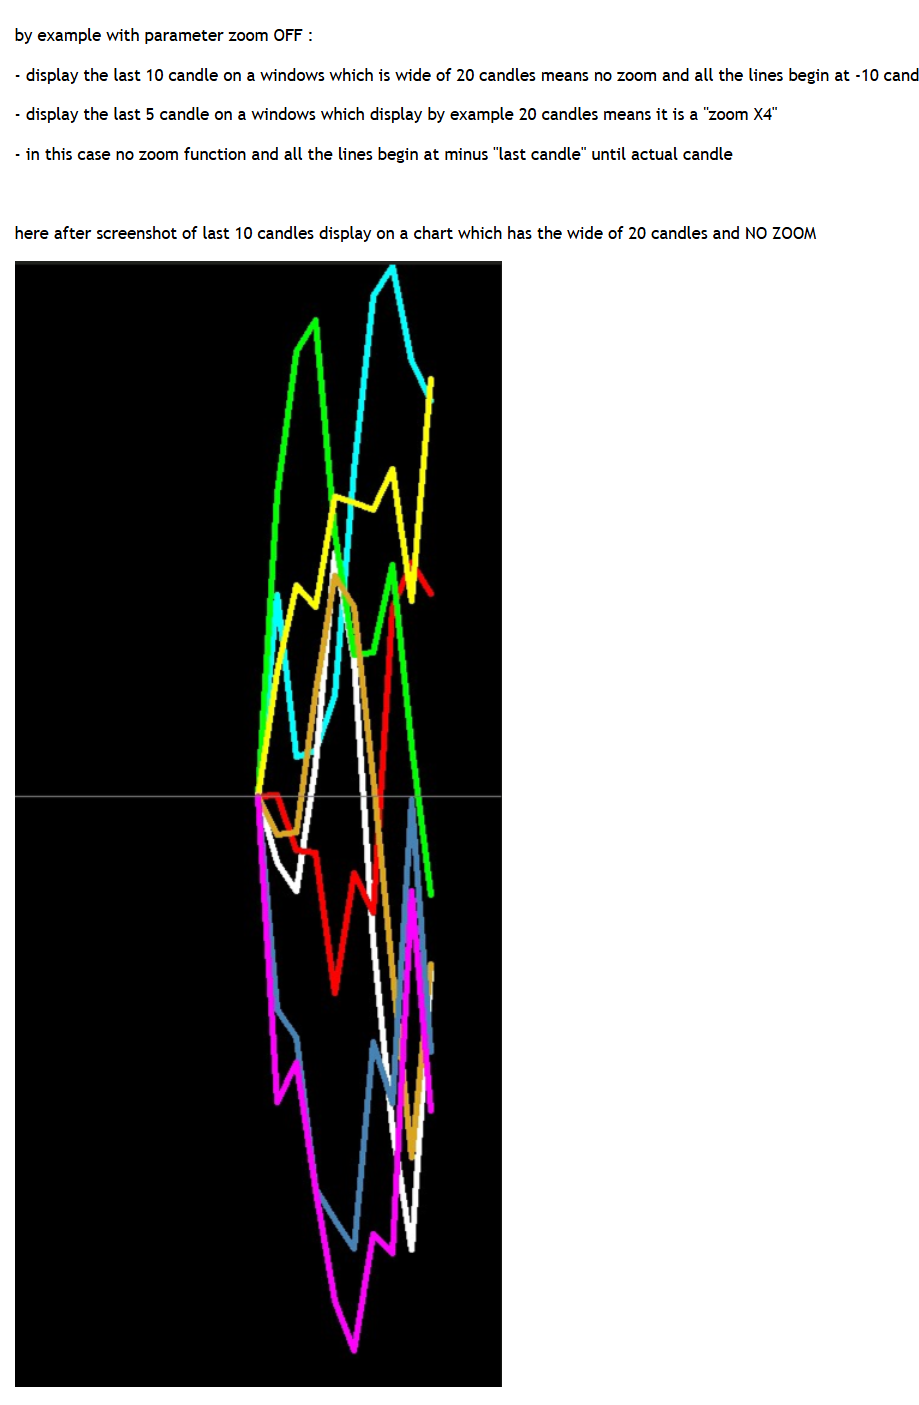
With STRETCH ON, the selected candles would be rescaled to fill the full chart MT4 (e.g., 10 candles stretched into 20 → Zoom X2).
With STRETCH OFF, the candles would display in their natural spacing, simply plotted from -N to 0
Each line displayed will show a dot for each period of N periods (if period is 10 then it will display on the line STRECHED or not 10 dots
======================UPDATES to make on the actual source to be more clear or to correct actual errors in the source code
1) display the indication of mode computational choosen which will be : PRICE NN (periods) or RSI NN XX(value of RSI) or ADX NN XX STRECH ON/OFF
actually the first upper left line of sub windows is taken but this display has to be deleted to display the computational mode choosen with parameters
IF you know how to not display the actual first line
or otherwise
the computational mode has to be displayed on last lower left line of the sub window indicator
In Param the choice of PRICE has to evident like PRICE : True or false and replace the label "Legacy flag" which actually allow the choice of PRICE (but not clear)
-------------
2) the indicator is heavy in cpu : found the reason due to an update not correct (before the indicator was not heavy CPU) probably coming from an loop inside the program near the display of line from 0 level or from 50 level line
⇒ in original source there was not this overload which freeze 2-3 secondes the mt4 instance
--------------
3) clean the display of label left or right (AUD CAD CHF ....) because if we change param X, Y, space between label then we have old label and new one mixed
and
reorganize the param of groups with 1 block for each of the 9 groups :
group1 show : true/false
group1 name : 3 to 6 characters (EUR .... XAU .... BTC ...
Group1 pairs in group : like EURUSD EURAUD ..... until 9 currencies could be indicated or at least 8 if problem of space
group1 line width : 0 to 10
group1 color : any color from the habitual little windows choice in MT4
and so on for group 2 until 9
=================================================================================================================
As i am in arbitration with the developper that i choose before , who say that he know how to do it but after 7 days was not able to stretch the line
i will ask before to choose the developper to see this functionality on a chart with 1 line in sub windows with theses characteristics :
1 line for the pair of the chart (EURUSD ?) beginning at -30 on a chart of 35 candles displayed for a RSI 5 close
for a period to display 10 , STRETCHED on 30 ( zoom-stretch factor X 3)
and on the same chart the same line without STRETCH (line begging at 0 level on the last 10 periods)
Thank you for your help
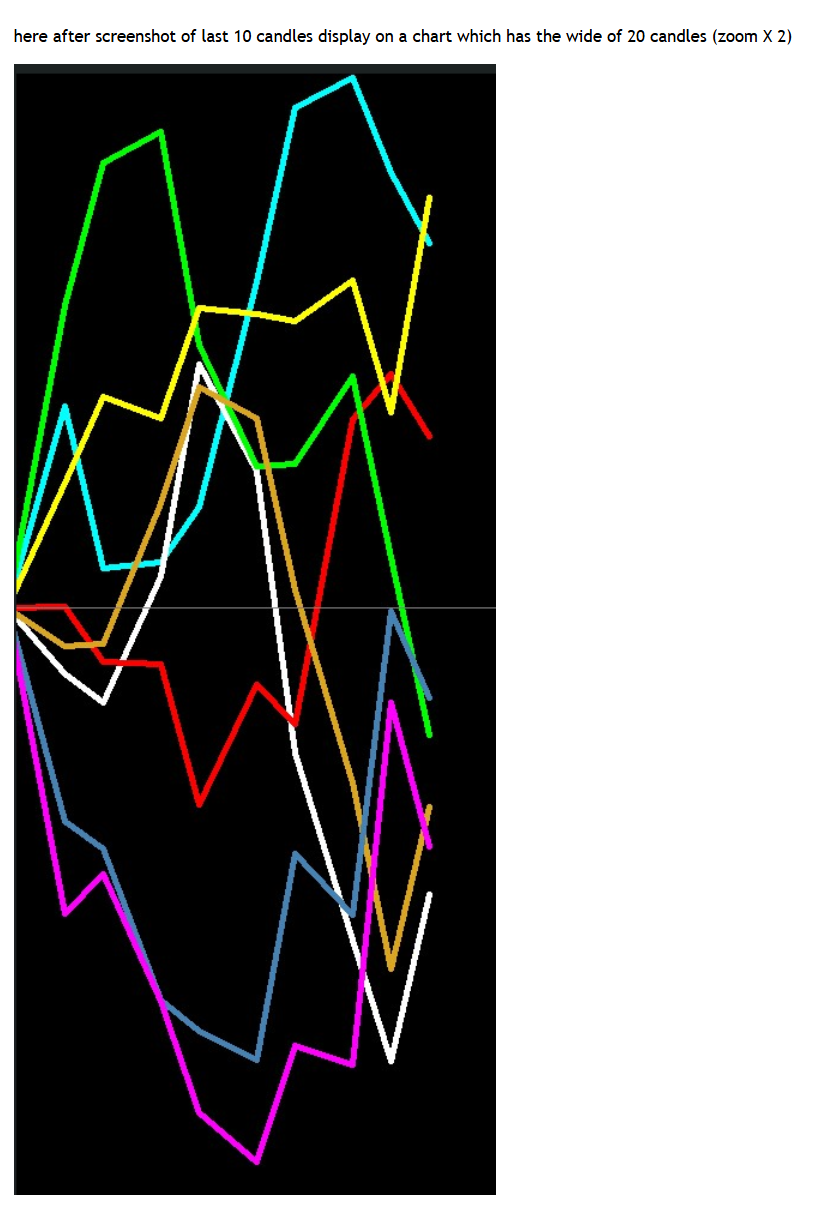
============================== examples of display with STRETCH ON then OFF ============================================
Here is what i wish to see:
and here what i see actually without any STRETCH even i choose the param corresponding :
================================== end ==============================