—
Generic Stuff
—
· CODE WILL BE MY PROPERTY ONCE FINISHED SO I CAN MARKET IT
· CODE MUST PASS MQL5 MARKET PLACE CHECKS
· It must also work exactly as what is showing in the video clip plotting the high lows. The video helps greatly to show exactly what is required.
—
SUMMARY
—
Video: https://drive.google.com/drive/folders/1JgeMfEYXF0i-UB8ogt0p4kUdlS_Efval?usp=sharing
Little over 4mins showing exactly how the high - low lines should move
I am looking for an indicator to plot the high/lows of the previous hour on the hourly candle.
It will need to draw a horizontal line on the hourly candle of the high or low.
How does it work?
Basically, we are looking for if a high or low breaks the previous high/low to confirm a trend direction.
If we have a blank chart to start, we would need to look back in time for the latest high or latest low.
This will help me to identify a trend. There would need to be calculations done every hour on the hourly candle close. Only once the recent high or low is broken by another candle, would you calculate back where the other high/low would be.
How to identify a recent low? The price has to break the most recent high.
Confirmation will only be once the recent high gets broken. The low will continue to move up as the highs get broken during each pull back in counter trend. If the candles are bouncing in between the high/low lines there is nothing to move each hour.
If the price is moving up each H1 candle close, then you do not need to move the Low horizontal line.
You would only move the Low line, when the next H1 candle does not break the most recent high horizontal line. Then if in a few hours it breaks the high line again, only then would you recalculate the low line. And visa versa for High lines.
Most recent low will only be confirmed once a new candle breaks the high line again.
Once it breaks the most recent high, you will look back on the chart at the previous candles and mark out the most recent low.
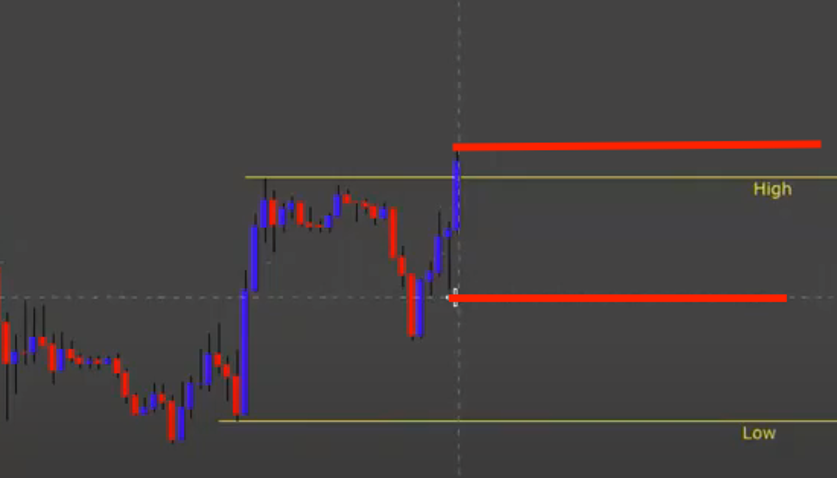
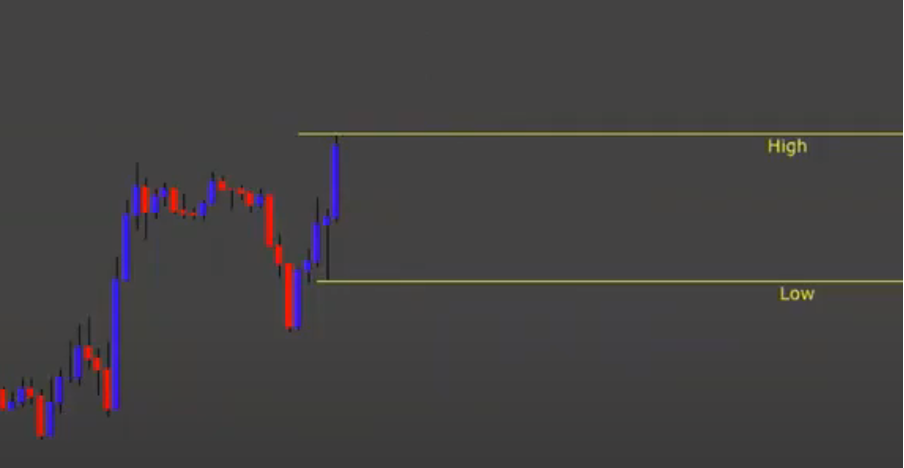
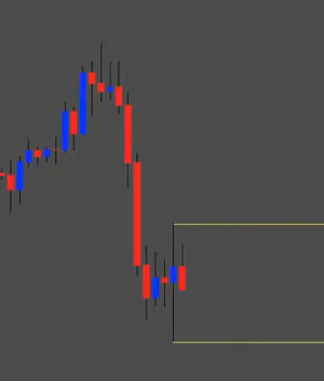
In the example above, the previous high/low is marked in yellow and written High/Low.
As you can see the blue candle breaks the previous high, as such the high line is now moved to the red line. Also, now the most recent low is confirmed as the high was broken, it is now also marked in red.
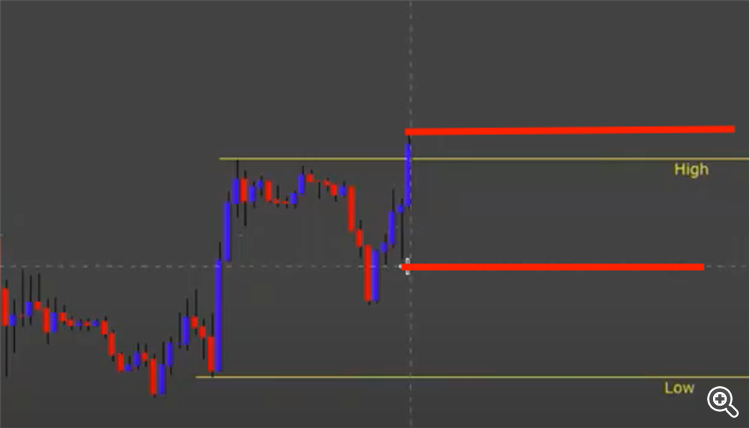
Final result will be:
Each candle after this high if it continues up will be a continuation of marking the highs.
UNTIL we get a counter trend move that does not take out the previous candles high.
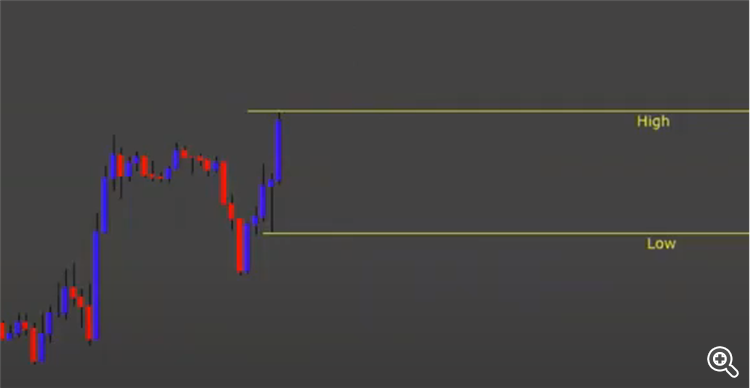
A candle with the wick on each side can also mark the high and low as seen here.
So I open EURUSD chart on H1 time frame. Then you click the horizontal line drawing tool and click on the high candle and the low candle
That’s how I would do it manually
And then grab that line and move it manually
—
Additions
—
· Users should be able to adjust the thickness of the horizontal lines
· Users should be able to adjust the colour of the horizontal lines
Pedidos semelhantes
I am looking for an experienced MQL5 developer to create a custom indicator for MetaTrader 5. The project requirements and indicator logic will be shared privately with the selected candidate to protect the concept and implementation details. Requirements: Strong experience with MQL5 indicator development. Ability to create clean, efficient, and well-structured code. Experience with custom buffers, chart objects
Hello, I am looking to develop a commercial-grade Expert Advisor for MT5 specifically optimized for XAUUSD (Gold). The underlying logic should be an intelligent, trend-filtered cost-averaging grid system focused on capital preservation. The EA must include the following functional architecture: 1. Core Strategy Structure: - Must feature a multi-strategy logic entry module. I want to use a combination of 3-4 standard
Generate a signal and place 2 arrows on the chart when these conditions happen. Rules: Levels up:price is below the Kijunsen and Senku A value is less than Senku B value Kijun sen close = previous kijun sen close; Kijun sen close value is LESS than Senku B close value Senkou B close = previous senku B close. Levels down: price is above Kijunsen. Senku A value is above Senku B value
i need the EA same working on trading view chart with same specifications of enter in a trade and sl/tp open 2 trades and 1 trade set tp1 & second trade set to tp 3 but sl should move to breakeven when tp1 hit and go to tp2 sl on tp1
preciso de um programa paracido com o CAP channel com botao de refresh e opcaos de alterar o periodo. utilizava um muito bom, mas o vendedor acredito ter sido excluido da comunidade, sumiu. e o que tinha parou de funcionar
Требуется напи сать пользовательский форекс-индикатор на основе стандартного индикатора ZigZag для торговой платформы МТ5 с фильтрацией колен (граней) по их минимальной длине. Пояснение: используя стандартный индикатор ZigZag для МТ5, добавить в его настройки функцию\опцию задания минимальной длины граней зигзага (чтобы индикатор игнорировал мелкие грани, а рисовал \ отмечал только те грани, длина которых составляет
ZigZag based on oscillators is needed The idea of the indicator Create a ZigZag indicator, which is constructed based on extreme values determined using oscillators. It can use any classical normalized oscillator, which has overbought and oversold zones. The algorithm should first be executed with the WPR indicator, then similarly add the possibility to draw a zigzag using the following indicators: CCI Chaikin RSI
EA specification for MT5 developer (coder‑ready spec) You can copy‑paste this directly into an MQL5 Freelance job. --- 1. General * Platform: MetaTrader 5 (MT5) * Type: Expert Advisor (EA) * Markets: Major FX pairs (configurable list via inputs) * Execution: Market orders only * Timeframes: EA must work on any timeframe, but I will mainly use it on M15–H1 --- 2. Indicators & definitions * EMA 20: Exponential Moving
looking for a highly experienced mql5 developer to build a professional trading ea based on multi timeframe top down analysis and market structure concepts the system should combine higher timeframe context with lower timeframe execution and provide both precise logic and clean visual representation on chart ⸻ core requirements • implementation of multi timeframe logic higher timeframe bias combined with lower
Hey I need help with the development of my ea. I am using a built in indicator and a custom indicator. It shouldn't take too long. I will tell you the conditions and then I just need some help with the coding but I have some experience. Thanks we can chat on whatsap or telegram