Trabalho concluído
Termos de Referência
The new indicator could possibly be based on the free indicator
"candles_seconds".
Show the number of candles in the chart!
Example Sell Trade:
1 Rise candle and 2 Fall candles = 3 candles visible in the chart
New chart M1...."Tick Candle", Time Frame exchangeable.
Important:
The indicator is integrated into the EA of runwiseFX.
The objects that the indicator creates should be created during initialization and only deleted during deinitialization. The indicator should only delete objects created by it and not others that are on the chart, e.g. from an EA with a panel.
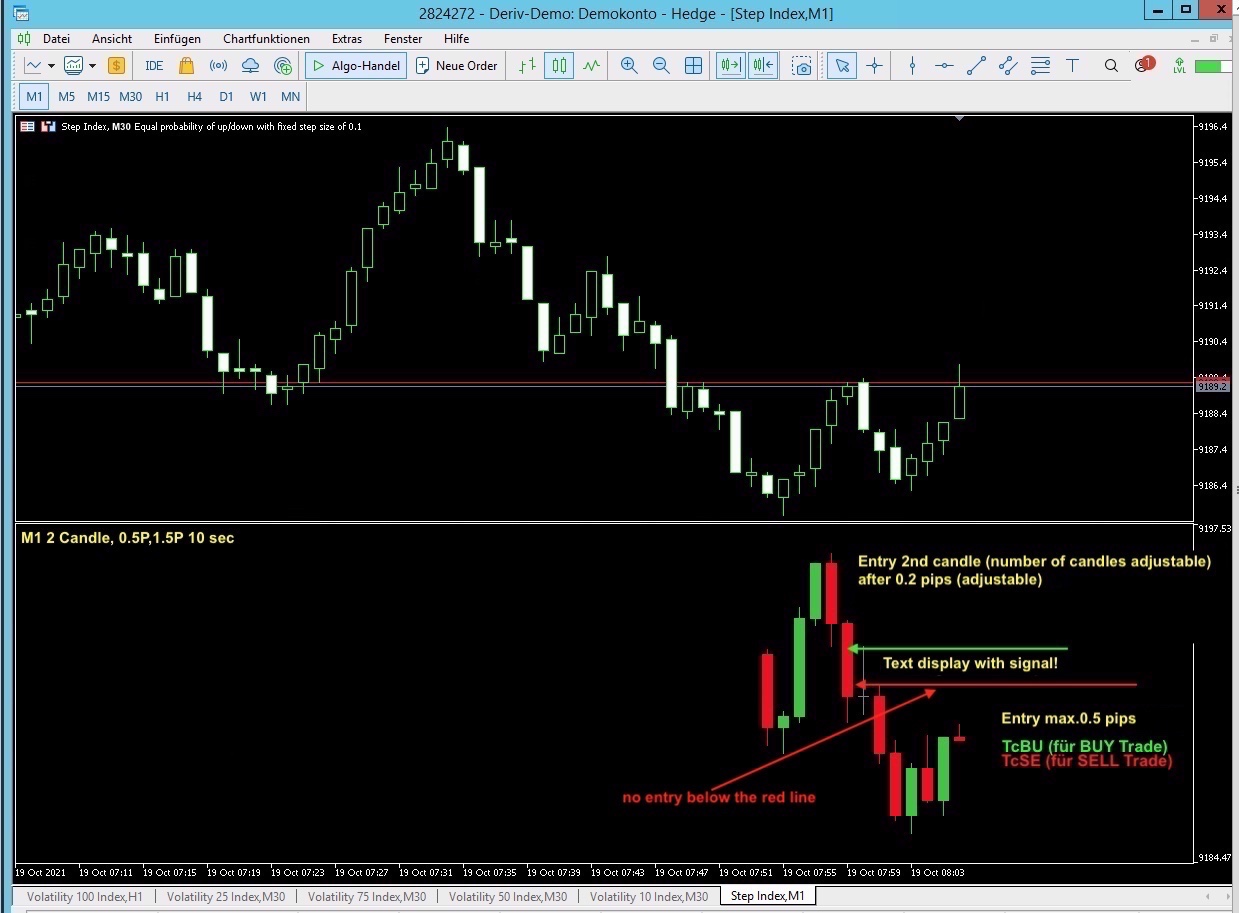
Show candles setting M1 at the top left of the chart e.g. M1, 2 Candle, 0.5P, 1.5P:
Candles:
Fall candles setting = 1,2,3,4,5 (number of candles in a row)
Rise Candles Setting = 6,7,8,9,10 (number of candles in a row)
Signal Text = true:
Show text in the chart. It must also be possible to hide text in the chart.
Show text on the far right in the middle of the chart.
Signal Text = TcBU for BUY Trade (color = lime)
Signal Text = TcSE for SELL Trade (color = red)
Signal Text = false:
BUY Trade (marking with line or arrow, candle color lime, color index = 0)
SELL Trade (marking line or arrow, candle color red, color index = 1)
Setting for indicator:
| Tick Candle M1 - - - - - - - - - - - - - - - - - - - - - - - - - - - - - - - - - - - - - - - - - | |||
| Sell Setting - - - - - - - - - - - - - - - - - - -- - - - - - - - - - - - - - - - - - - - - - - - - | |||
| Rise Candles | : | 6 | |
| Fall Candles | : | 2 | |
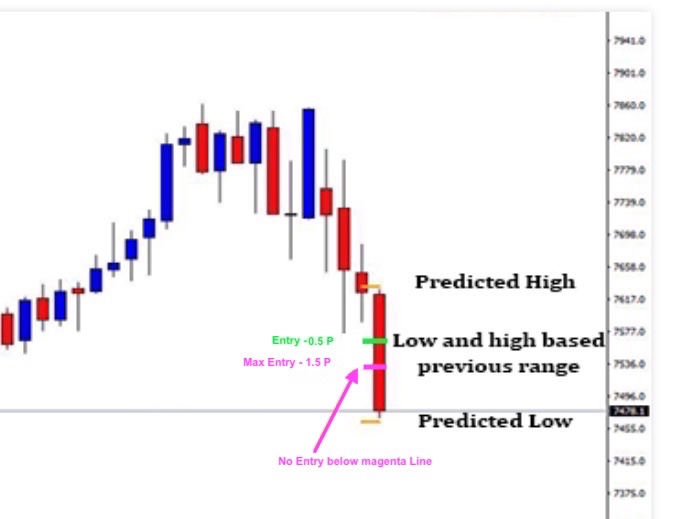
| Min Pips | : | 0.5 (green line on candle, see picture) | |
| Max Pips | : | 1.5 (red line on candle, see picture) | |
| Buy Setting M1- - - - - - - - - - - - - - - - - - - - - - - - - - - - - - - - - - - - - - - - - - | |||
| Fall Candles: | : | 1 | |
| Rise Candles | : | 7 | |
| Min Pips | : | 0.5 (green line on candle, see picture) | |
| Max Pips | : | 1.5 (red line on candle, see picture) | |
| (Keine Zahlen kein Text) - - - - - - - - - - - - - - - - - - - - - - - - - - - - - - - - - - - | |||
| Color Index | : | false | |
| Show Signal Text on Chart | : | true | |
| SignalBull | : | clrLime | |
| TxtSignalBull | : | Rs1BU | |
| SignalBear | : | clrRed | |
| TxtSignalBear | : | Rs1SE | |
| TimeFrame | : | PERIOD_M1 | |
Generate SELL signal:
Sell Signal Color Index = 1
SELL signal when:
1st condition
M1 the 1 candle (adjustable) is a rise candle.
M1 = 6 (6,7,8,9,10 - adjustable, 6 = 1 candle rise)
2nd condition
M1 the 2 candles (in a row) is a fall candle.
M1 = 2 (1,2,3,4,5- adjustable, 2 = 2 case candles in a row)
3rd condition
Marking in the respective candle at signal, same color as text (arrow, line, any ...)
If the 2nd condition is met, an arrow or line (lime color) must be displayed on the candle after exceeding 0.5 pips.
M1 = 0.001 (Min Pips adjustable, arrow or line, any ... from the start of the current candle)
M1 = 1.5 (Max Pips (adjustable arrow, line, any ... from the start of the current candle, if the price exceeds this line, no Sell signal may be sent.)
If conditions 1 to 3 are met, a sell signal should be generated after crossing the min pips line (TcSE + index = 1)
Generate BUY signal:
BUY Signal Color Index = 0
BUY signal when:
1st condition
M1 the 1 candle (adjustable) is a case candle.
M1 = 1 (1,2,3,4,5- adjustable, 6 = 1 candle rise)
2nd condition
M1 the 2 candles (in a row) is a fall candle.
M1 = 7 (6,7,8,9,10- adjustable, 2 = 2 case candles in a row)
3rd condition
Marking in the respective candle at signal, same color as text (arrow, line, any ...)
If the 2nd condition is met, an arrow or line (lime color) must be displayed on the candle after exceeding 0.5 pips.
M1 = 0.001 (Min Pips adjustable, arrow or line, any ... from the start of the current candle)
M1 = 1.5 (Max pips (adjustable arrow, line, any ..., from the start of the current candle, if the price exceeds this line, no buy signal may be sent.)
If conditions 1 to 3 are met, a buy signal should be generated after crossing the min pips line (TcBU + color index = 0)